Renoprotective effects of brown adipose tissue activation in diabetic mice
棕色脂肪激活对糖尿病小鼠的肾脏保护作用
Funding information: National Natural Science Foundation of China, Grant/Award Numbers: 81870612, 81628004, 31400992, 81470047; Science and Technology Planning Project of Guangdong Province, Grant/Award Number: 2013B022000061; Wu Jieping Medical Foundation, Grant/Award Number: 320.6750.15198
Abstract
enBackground
Brown adipose tissue (BAT) has been regarded as a potential target organ to combat obesity and related metabolic disorders. However, the effect of BAT activation on the development of diabetic kidney disease (DKD) remains unclear.
Methods
Diabetic mice were induced by streptozotocin (STZ) combined with a high-fat diet. To activate BAT, mice were administered 1 mg/kg per day, i.p., CL316,243, a β3-adrenergic receptor agonist, for 4 weeks. Blood glucose, serum lipids, adipokines, 24-hour urinary albumin, 8-hydroxydeoxyguanosine (8-OHdG), and circulating microRNA (miRNA) levels were analyzed, in addition to renal pathology. Histological changes (fibrosis, inflammation) were evaluated in the kidneys, as was the expression of oxidative stress-related genes. Renal signaling pathways (fibroblast growth factor [Fgf]21/β-klotho/FGF receptor 1c and AMP-activated protein kinase[AMPK]/sirtuin 1 [Sirt1]/peroxisome proliferator-activated receptor-γ coactivator-1α [Pgc1α]) were also evaluated.
Results
Compared with untreated STZ-diabetic mice, CL316,243 treatment reduced blood glucose, albeit not significantly (20.58 ± 3.55 vs 23.60 ± 3.90 mM), and significantly decreased triglycerides and low-density lipoprotein cholesterol and increased high-density lipoprotein cholesterol. Simultaneously, BAT activation significantly decreased 24-hour urinary albumin (34.21 ± 6.28 vs 70.46 ± 15.81 μg/24 h; P < 0.05) and 8-OHdG, improved renal fibrosis, inflammation, and oxidative stress, and ameliorated renal morphological abnormalities. In addition to enhancing BAT activity, CL316,243 significantly increased serum adiponectin concentrations and renal Fgf21 sensitivity, and reactivated the renal AMPK/Sirt1/Pgc1α signaling pathway. Furthermore, CL316,243 treatment increased levels of some circulating miRNAs and downregulated expression of their target genes in the kidney.
Conclusions
Activating BAT could improve kidney injury in diabetic mice via metabolic improvements and renal AMPK activation by beneficial adipokines and miRNAs.
摘要
zh背景
棕色脂肪组织(brown adipose tissue, BAT)是潜在的防治肥胖及相关代谢紊乱的器官, 目前BAT激活对糖尿病肾脏病(diabetic kidney disease, DKD)的影响尚不清楚。
方法
对链脲佐菌素(STZ)联合高脂饮食诱导的糖尿病小鼠, 连续4周每天给予1 mg/kg的β3-肾上腺素能受体激动剂CL316,243以激活BAT, 观察其对小鼠血糖、血脂、脂肪因子、24 h尿白蛋白、8-羟基脱氧鸟苷(8-OHdG)、循环microRNA分子(miRNA)水平、肾脏组织病理、肾脏纤维化、炎症及氧化应激的影响, 并对肾脏成纤维细胞生长因子Fgf 21/β-klotho/FGFR1c和AMPK/Sirt1/Pgc1α信号通路进行分析。
结果
CL316,243干预组的糖尿病小鼠的血糖水平呈降低趋势(20.58±3.55 vs. 23.60±3.90 mmol/L), 且甘油三酯和低密度脂蛋白胆固醇明显降低, 而高密度脂蛋白胆固醇明显升高。同时, BAT激活显著降低糖尿病小鼠的24 h尿白蛋白水平(34.21±6.28 vs. 70.46±15.81 μg/24 h;P<0.05)和8-OHdG水平, 明显改善肾脏纤维化、炎症和氧化应激, 并改善肾脏形态学异常。CL316,243干预不仅增强了糖尿病小鼠的BAT活性, 还显著提高了血清脂联素水平和肾脏Fgf 21敏感性, 激活了肾脏AMPK/Sirt1/Pgc1α信号通路。此外, CL316,243干预可显著增加某些循环miRNAs水平, 并下调相应的肾脏靶基因表达。
结论
BAT激活可显著改善糖尿病小鼠的代谢紊乱, 增加血中脂肪因子水平、上调循环中某些miRNAs表达、激活肾脏AMPK信号通路, 从而发挥对糖尿病小鼠的肾脏保护作用。
1 INTRODUCTION
Diabetic kidney disease (DKD) is one of the major causes of end-stage renal disease (ESRD). Current treatments, including various pharmacological strategies and changes in lifestyle, are only partially effective in preventing progression of DKD.1 It is very important to explore new targets to improve the outcomes.
Lipotoxicity has been implicated in the pathophysiology of DKD.2 Recent studies have shown that various adipokines, such as adiponectin and fibroblast growth factor (FGF) 21, are involved in the regulation of renal metabolism.3 In addition, adipose-derived circulating microRNAs (miRNAs) have been demonstrated to regulate the metabolism of other tissues.4 Various miRNAs play an important role in the kidney.5 These findings reveal that adipose tissue may be closely related to the development of DKD. Unlike white adipose tissue, brown adipose tissue (BAT) is a mitochondria-rich tissue that is specialized in non-shivering thermogenesis through consumption of fatty acids and glucose.6 Many previous rodent studies have revealed that activation of BAT for 4 weeks can regulate energy metabolism and glucose homeostasis.7, 8 In 2009, BAT was found to be functional in adult humans,9 and was recently proved to be activated in humans by β3-adrenergic receptor agonists.10 Activation of BAT has been considered to be associated with immunity against obesity, diabetes, and related metabolic diseases.11 In addition, as an endocrine organ, BAT can secrete adipokines to regulate metabolism.12 Chronic stimulation of BAT for 30 days also contributes to the release of adipokines, which have beneficial effects on the kidneys.13, 14 Together, these findings suggest that activation of BAT may have beneficial effects in preventing the development of DKD. However, the relationship between BAT and DKD has not been reported before.
In the present study we administered the β3-adrenergic receptor agonist CL316,243 to stimulate BAT in type 2 diabetic (T2D) mice to investigate the effects of BAT activation on kidney disease. Our hypothesis was that BAT activation would attenuate the development of DKD by improving metabolism and increasing levels of beneficial adipokines and miRNAs, which could activate downstream signaling pathways in the kidney.
2 METHODS
2.1 Animals
Male C57BL/6J mice, aged 6 weeks (n = 30), were purchased from Guangdong Medical Laboratory Animal Center (Guangzhou, China). All animals were maintained in a specific pathogen-free (SPF) barrier facility at Southern Medical University (Guangzhou, China). Mice were kept at 22°C under a 12-hour light-dark cycle and had free access to water and diet. All animal experiments were conducted in accordance with the regulation of the Animal Care and Use Committee of the Southern Medical University.
2.2 Induction of the diabetic mouse model and CL316,243 treatment
Mice were randomly divided into two groups and fed either a chow diet (Control) or high-fat diet (HFD; 5.24 kcal/g; 60% kcal from fat, 20% kcal from carbohydrate; Guangdong Medical Laboratory Animal Center). To induce hyperglycemia, after 4 weeks of feeding the HFD, mice (n = 22) received a single intraperitoneal injection of streptozotocin (STZ; 120 μg/g body weight in 10 mM sodium citrate buffer, pH 4.5; S0130; Sigma, Shanghai, China),15 whereas the mice in the Control group (n = 8) were injected with an equivalent volume of citrate buffer. Mice were considered diabetic when their blood glucose concentrations exceeded 250 mg/dL. At Week 8, diabetic mice (n = 18) were randomly divided into two groups, a diabetic control group (DM-Con; n = 9) and a diabetic group treated with the β3-adrenergic receptor agonist CL316,243 (DM + CL; n = 9). Mice in the DM + CL group were administered 1 mg/kg, i.p., CL316,243 daily for 4 weeks, whereas mice in the DM-Con group received saline only. Throughout the experiment, the Control and diabetic mice were fed chow diet and the HFD, respectively. Food intake, body weight, and blood glucose were measured every week. At Week 12, blood was collected from the left ventricle under anesthesia (sodium pentobarbital of 50 mg/kg through intraperitoneal injection) after 4 hours of fasting; serum was stored at −80°C until analysis. Mice were killed by cervical dislocation, and adipose tissues and kidneys were harvested and immediately frozen in liquid nitrogen until further analysis.
2.3 Assessment of renal function, oxidative stress, and Fgf21 concentrations
At Weeks 8, 10, and 12, mice were placed individually in metabolic cages to collect 24-hour urine samples. Urinary albumin and 8-hydroxydeoxyguanosine (8-OHdG) concentrations were measured by ELISA (Bethyl Laboratories, Montgomery, Texas; Cusabio, Barksdale, USA, respectively). Serum creatinine (Cr) was measured using a commercially available kit (Nanjing Jiancheng Bioengineering Institute, Nanjing, China), and FGF21 protein in the renal cortex was determined by ELISA (Elabscience Biotechnology, Wuhan, China).
2.4 Measurement of serum parameters
During the experiment, random blood glucose levels were measured using an Accu-Chek glucose monitor (Roche, Shanghai, China). Serum adiponectin and Fgf21 concentrations were determined by ELISA (Elabscience Biotechnology). Triglycerides (TG), high-density lipoprotein cholesterol (HDL-C) and low-density lipoprotein cholesterol (LDL-C) were measured using commercially available kits (Nanjing Jiancheng Bioengineering Institute).
2.5 Extraction of ribonucleic acid (RNA) and quantitative real-time polymerase chain reaction (qRT-PCR)
The renal cortex and adipose tissues were snap frozen in liquid nitrogen, and RNA was extracted with TRIzol (Takara, Dalian, China). The quality of the RNA was determined using a NanoDrop ND-1000 Spectrophotometer (Thermo Fisher Scientific, Waltham, Massachusetts). The cDNA was synthesized by using an M-MLV Kit (Invitrogen, Carlsbad, California). Real-time quantitative polymerase chain reaction (qPCR) was performed in a Roche Lightcycler 480II (Roche, Basle, Switzerland) using a SYBR Green qPCR Kit (Takara). Relative gene expression was calculated using the 2−ΔΔCt method and 18 s as an internal control.16 The primers used are listed in Table 1.
| Gene name | Gene symbol | Primers (5′-3′) |
|---|---|---|
| Fibronectin | Fn | Forward: TAGCCCTGTCCAGGAGTTCA |
| Reverse: CTGCAAGCCTTCAATAGTCA | ||
| Collagen 1 | Col1 | Forward: GCAGGAGGTTTCGGCTAAGT |
| Reverse: GCAACAAAGTCCGCGTATCC | ||
| Transforming growth factor-β1 | Tgfβ1 | Forward: CCACCTGCAAGACCATCGAC |
| Reverse: CTGGCGAGCCTTAGTTTGGAC | ||
| Tumor necrosis factor-α | Tnfα | Forward: CATCTTCTCAAAATTCGAGTGACAA |
| Reverse: TGGGAGTAGACAAGGTACAACCC | ||
| Interlekin-1β | Il-1β | Forward: GTCTTTCCCGTGACCTTC |
| Reverse: ATCTCGGAGCCTGTTAGTGC | ||
| Uncoupling protein 1 | Ucp1 | Forward: AGGCTTCCAGTACCATTAGGT |
| Reverse: CTGAGTGAGGCAAAGCTGATTT | ||
| Peroxisome proliferator-activated receptor-γ coactivator-1α | Pgc1α | Forward: CCCTGCCATTGTTAAGACC |
| Reverse: TGCTGCTGTTCCTGTTTTC | ||
| Cd36 | Cd36 | Forward: TGTGTTTGGAGGCATTCTCA |
| Reverse: TTTTGCACGTCAAAGATCCA | ||
| Adipose triglyceride lipase | Atgl | Forward: TGTGGCCTCATTCCTCCTAC |
| Reverse: TCGTGGATGTTGGTGGAGCT | ||
| Cytochrome c oxidase subunit 2 | Cox2 | Forward: CCATCCCAGGCCGACTAA |
| Reverse: AATTTCAGAGCATTGGCCATAGA | ||
| Klotho beta | Klb | Forward: CAGGCCCATTGTTACCTTGT |
| Reverse: CTCCAAAGGTCTGGAAGCAG | ||
| Fibroblast growth factor receptor 1c | Fgfr1c | Forward: AATACCACCGACAAGGAAATGG |
| Reverse: AGTTACCCGCCAAGCACGTA | ||
| 18S | Forward: AGCCTGCGGCTTAATTTGAC | |
| Reverse: CAACTAAGAACGGCCATGCA |
2.6 Isolation of miRNAs and real-time qPCR
Serum total RNA was isolated using the miRcute serum/plasma miRNA isolation kit (TianGen, Beijing, China) and reverse transcribed using a miRNA First-Strand cDNA Synthesis kit (TianGen) according to the manufacturer's instructions. Because of the the lack of a stable endogenous serum miRNA, samples were spiked with a synthetic Caenorhabditis elegans mir-39 miRNA mimic (cel-mir-39) as a control to monitor changes in RNA recovery. The real-time qPCR was performed in a Roche LightCycler480II using the miRcute miRNA Detection Kit (TianGen). Relative expression of target miRNAs was calculated using the comparative 2-ΔΔCt method with external control. In virtue of the lack of a stable endogenous serum miRNA, samples were spiked with a synthetic C. elegans mir-39 miRNA mimic (cel-mir-39) as a control to monitor changes in RNA recovery. cel-mir-39 was the external control. Primers for miR-26a, miR-30b, miR-30c, miR99a, miR100, miR181a, and the external control were designed by the authors. Primer sequences of these miRs as follows:miR-30b-5p: 5'-GCGTCCTGTAAACATCCTACACTCAGCT-3'miR-99a-5p: 5'-GCGTAACCCGTAGATCCGATCTTGTG-3'miR-100-5p: 5'-GCGTAACCCGTAGATCCGAACTTGTG-3'miR-181a-5p: 5'-GCGTCCAACATTCAACGCTGTCGGTGAGT-3' The universal reverse primer and primers for miR-26a and miR-30c were purchased from TianGen (Beijing, China).
2.7 Western blotting
Total protein from the renal cortex and adipose tissues was extracted using RIPA Lysis Buffer (Beyotime, Shanghai, China), and protein concentrations were measured by the bicinchoninic acid assay (Takara). Proteins (40 μg) were electrophoresed by 10%-15% sodium dodecyl sulfate-polyacrylamide gel electrophoresis (Bio-Rad, Hercules, California) and then transferred to polyvinylidene difluoride membranes (Merck Millipore, Billerica, Massachusetts). After membranes had been blocked, with 5% non-fat milk or 5% BSA they were hybridized overnight at 4°C with primary antibodies against transforming growth factor (Tgf)-β1 (1: 500 dilution; Santa Cruz Biotechnology, Santa Cruz, California), collagen 1 (Col1; 1:200 dilution; Abcam, Cambridge, MA), fibronectin (Fn; 1: 500 dilution; R&D, Minneapolis, MN), tumor necrosis factor (Tnf)-α (1: 500 dilution; ABclonal, Boston, MA), NADPH oxidase 1 (Nox1; 1: 500 dilution; GeneTex, Irvine, CA), superoxide dismutase 1 (Sod1; 1: 200 dilution; Santa Cruz Biotechnology), NAD(P)H dehydrogenase 1 (Nqo1; 1: 200 dilution; Santa Cruz Biotechnology), phosphorylated (p-) AMP-activated protein kinase (AMPK; 1: 1000 dilution; CST, Danvers, MA), total AMPK (1: 500 dilution; CST), sirtuin 1 (Sirt1; 1: 2000 dilution; Abcam), peroxisome proliferator-activated receptor-γ coactivator-1α (Pgc1α; 1: 1000 dilution; Novus Biologicals, Littleton, CO), uncoupling protein 1 (Ucp1) (1: 500 dilution; Santa Cruz Biotechnology), and β-actin (1: 500; ZSGB-BIO, Beijing, China). The membranes were then incubated with an appropriate horseradish peroxidase-conjugated secondary antibody for 1 hour, whose signal was visualized using enhanced chemiluminescence (ECL) reagents (Tanon, Shanghai, China) and quantified by GelPro32 (Media Cybernetics, Silver Springs, MD, USA). The membranes were washed for 3 times(8 minutes per time) with Tris-buffered saline containing 0.1% Tween-20(TBST) after the overnight incubation with the primary antibodies.Then the membranes were incubated with secondary antibody.
2.8 Histological examination
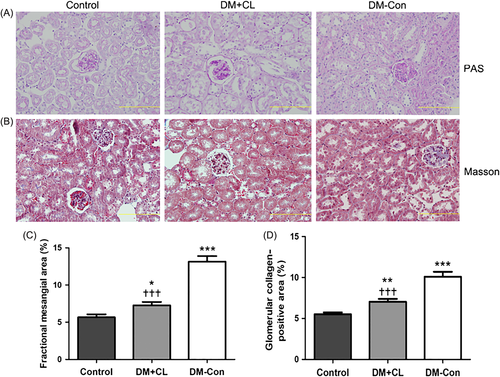
Renal tissues were fixed for 48 hours with 4% paraformaldehyde, dehydrated, embedded in paraffin, and cut into 4-μm slices, before being stained with periodic acid-Schiff (PAS) and Masson's trichrome to assess mesangial matrix expansion and collagen deposition, respectively. More than 25 glomeruli per group were counted, and the mean was used for analysis. All sections were evaluated under an Olympus (Tokyo, Japan) BX40 upright light microscope.
2.9 Statistical analysis
Data are expressed as the mean ± SEM. Two-tailed Student's t tests were used to compare two independent groups, and one-way analysis of variance (ANOVA) was used to examine the significance of differences among three independent groups. Dunnett's test or the least significant difference (LSD) test was used for multiple comparisons. Statistical analyses were performed in SPSS 20.0 (IBM Corp., Armonk, New York). P < 0.05 was considered significant.
3 RESULTS
3.1 Effects of CL316,243 on metabolic parameters in diabetic mice
Blood glucose concentrations were higher in diabetic than Control mice (by approximately 3-fold). There was a non-significant decrease in blood glucose concentrations in mice in the DM + CL compared with DM-Con group (20.58 ± 3.55 vs 23.6 ± 3.9 mM, respectively; Figure 1A). As shown in Figure 1B, serum TG (1.32 ± 0.19 vs 0.53 ± 0.02 mM) and LDL-C (1.00 ± 0.10 vs 0.21 ± 0.04 mM) concentrations were higher in the DM-Con than Control group (P < 0.001), and this was reversed by CL316,243 treatment (P < 0.01). In contrast, serum HDL-C was higher in the DM + CL group than in the Control and DM-Con groups (4.44 ± 0.28 vs 2.84 ± 0.17 and 3.32 ± 0.23 mM, respectively; P < 0.01). Kidney weight and the kidney weight/body weight ratio were higher in the DM-Con group than in the Control and DM + CL groups (P < 0.05; Table 2). In addition, food intake was increased in the DM-Con group compared with the Control group (P < 0.01). However, there was a obvious increase in food intake in DM + CL group compared with the Control and DM-Con groups (P < 0.01; Table 2).

| Parameters | Control | DM + CL | DM-Con |
|---|---|---|---|
| BW (g) | 29.91 ± 0.97 | 30.51 ± 0.55 | 29.24 ± 0.70 |
| KW (g) | 0.20 ± 0.02 | 0.22 ± 0.01† | 0.27 ± 0.02** |
| KW/BW (×10−3) | 6.40 ± 0.42 | 6.94 ± 0.37†† | 9.03 ± 0.49** |
| RBG (mM)2 | 8.30 ± 0.46 | 20.58 ± 3.55* | 23.6 ± 3.87** |
| Food intake (kcal/day per mouse) | 11.82 ± 0.31 | 18.92 ± 0.80*** ,†† | 15.72 ± 0.50** |
| Serum Cr (μM) | 22.79 ± 6.79 | 23.4 ± 5.43 | 24.65 ± 5.25 |
| Urine volume (mL) | 1.84 ± 0.22 | 2.77 ± 1.20† | 11.50 ± 2.09* |
- Data are the mean ± SEM (n = 7–9 per group).
- BW, body weight; Cr, creatinine; DM + CL, diabetic mice treated with CL316,243; KW, kidney weight; RBG, random blood glucose.
- * P < 0.05
- ** P < 0.01
- *** P < 0.001 compared with the control (normal) group
- † P < 0.05;
- †† P < 0.01 compared with the diabetic control (DM-Con) group.
3.2 Effects of CL316,243 on 24-hour urinary albumin and 8-OHdG
Urinary albumin excretion was higher in diabetic than Control mice (by approximately 7fold). By 4 weeks after CL316,243 treatment, there was a decrease in urinary albumin excretion in the DM + CL compared with DM-Con group (34.21 ± 6.28 vs 70.46 ± 15.81 μg/24 h, respectively; P < 0.05; Figure 2A). Consistent with the results above, high level of urinary 8-OHdG in diabetic mice was decreased by CL316,243 treatment significantly (P < 0.001; Figure 2B).

3.3 Effects of CL316,243 on interscapular BAT and epididymal adipose tissues
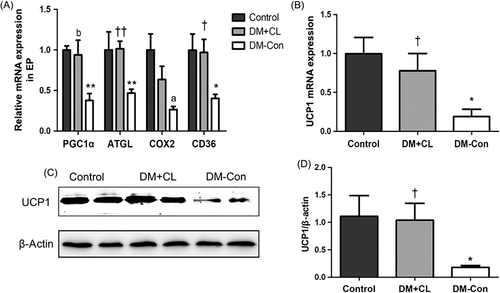
There were decreases in both Ucp1 mRNA and protein in the BAT of DM-Con compared with Control mice (P < 0.05), and these levels were restored by CL316,243 treatment (Figure 3B,C). In addition, compared with DM-Con group, CL316,243 treatment of diabetic mice increased the expression of the mitochondrial and fatty acid metabolism-related genes Pgc1α, Cd36, and adipose triglyceride lipase (Atgl) in epididymal adipose tissue (Figure 3A).
3.4 Systemic and renal adipokine expression
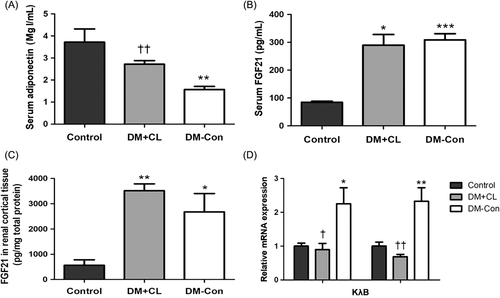
Serum adiponectin concentrations were lower in DM-Con than Control mice, but were restored by CL316,243 treatment (P < 0.01; Figure 4A). In contrast, serum Fgf21 concentrations were upregulated in DM-Con compared with Control mice (P < 0.001), and were not affected by CL316,243 treatment (Figure 4B). In renal cortical tissue, Fgf21 protein expression was in accordance with serum concentrations (Figure 4C). Interestingly, there were significantly increases in Fgf21-related components, including β-klotho and FGF receptor1c (Fgfr1c), in DM-Con compared with Control mice, which were abrogated by CL316,243 treatment (P < 0.05; Figure 4D).
3.5 Effects of CL316,243 on serum miRNAs and related target genes in the kidney
Some circulating miRNAs, such as miR-26a, miR-30b, miR-30c, miR-99a, miR-100, and miR-181a, were increased in diabetic mice. Three of these miRNAs (miR-30b, miR-30c, and miR-99a) were increased in the DM-CL group compared with the other two groups (P < 0.05; Figure 5A). Based on the present and previous studies,16-19 four (Ctgf, Snail1, Nox4, Egr1) candidate related genes in the kidney were identified and tested, namely connective tissue growth factor (Ctgf), snail family zinc finger 1 and early growth response factor 1 (Egr1), the 3′-untranslated region of which could be targeted by miR-26a, miR-30b, miR-30c, miR-99a, and miR-181a. The renal expression of these target genes, verified to be associated with renal fibrosis,20, 21 was suppressed by CL316,243 treatment compared with that in the DM-Con group (P < 0.05; Figure 5B).

3.6 Effects of CL316,243 on renal fibrosis, inflammation, and oxidative stress-related molecules
The mRNA expression of fibrotic markers, namely Tgfβ1, Col1, and Fn, and inflammatory markers, namely Tnfα and Il-1β, was increased in DM-Con compared with Control mice (P < 0.05; Figure 6A). Furthermore, western blotting assays revealed that protein levels were consistent with mRNA expression (Figure 6B–F). However, the increased production of Tgfβ1, Col1, Fn, and Tnfα observed in DM-Con mice was significantly attenuated by CL316,243 treatment (P < 0.05; Figure 6B–F).
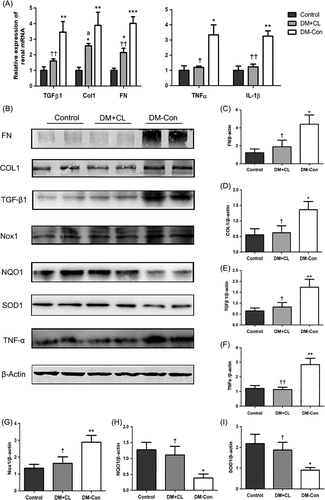
Western blotting analysis showed that Sod1 and Nqo1 levels were reduced in DM-Con compared with Control mice, but that CL316,243 treatment enhanced renal Sod1 and Nqo1 expression (P < 0.05; Figure 6B,H–I). Expression of renal NADPH oxidase 1 (Nox1) was increased in DM-Con compared with Control mice, and was reduced by CL316,243 treatment (P < 0.05; Figure 6B,G).
3.7 Effects of CL316,243 on renal histological changes
More serious collagen accumulation was observed in DM-Con than Control mice, which was improved by CL316,243 treatment (P < 0.001; Figure 7B,D). Similarly, there was an increase in fractional mesangial area in DM-Con compared with Control mice, and the mesangial expansion was obviously improved in the CL316,243-treated group (P < 0.001; Figure 7A,C).
3.8 Renal expression of p-AMPK (Thr172), total AMPK, Sirt1, and Pgc1α
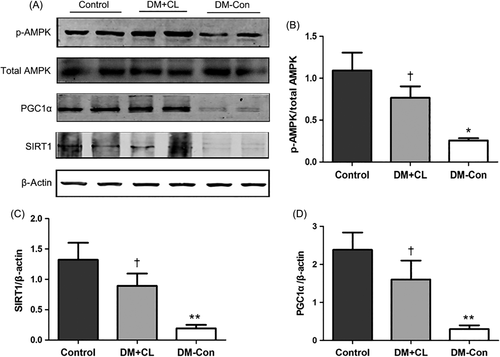
As shown in Figure 8, the ratio of p-AMPK (Thr172)/total AMPK and Sirt1 and Pgc1α levels were markedly decreased in DM-Con compared with Control mice (P < 0.05). However, the CL316,243 treatment reversed the decreases in the p-AMPK (Thr172)/total AMPK ratio and Sirt1 and Pgc1α levels.
4 DISCUSSION
In the present study we verified the beneficial renal effects of BAT activation in diabetic mice, which were mediated by improvements in systemic and renal metabolism. Chronic stimulation of BAT did not improve glycemic control in diabetic mice, as reported previously.8 This apparent discrepancy may be due to differences in animal models and interventions. In addition, in contrast to expectations, the body weight of DM-Con mice was not higher than that of Control mice in the present study, whereas the body weight of CL316,243-treated mice exhibited a tendency to be greater than that of DM-Con mice at the end of the study. This may be due to a variety of factors, including uncontrolled diabetic disorders, long-term HFD feeding, and drug-induced metabolic improvements and increased food intake. Conversely, Bartelt et al.22 confirmed that activation of BAT could correct hyperlipidemia by modulating vascular lipoprotein homeostasis. In the present study, CL316,243-treated mice also exhibited changes in lipid profiles, including decreased serum TG and LDL-C concentrations.
In terms of DKD, we provide direct evidence that BAT activation significantly ameliorates albuminuria, renal fibrosis, and structural changes. In addition, CL316,243 treatment exhibited renal protective effects by improving in oxidative stress and inflammatory cytokines in the kidney. To further elucidate the potential mechanism independent of blood glucose control, we first detected the activity of interscapular BAT and epididymal adipose tissue. Numerous preclinical and clinical studies have reported that the role of BAT gradually deteriorates in the development of obesity and diabetes.23, 24 In accordance with these data, we found that the expression of BAT-specific and fatty acid metabolism-related genes was downregulated in diabetic mice and restored by CL316,243 treatment. Next, we investigated whether these beneficial effects were mediated by BAT-secreted adipokines. Increasing evidence suggests that adiponectin reduces microalbuminuria and exerts renoprotective effects in diabetic animals.25 The mechanism appears to be related to AMPK activation and an angiotensin-antagonistic effect.26, 27 In addition, low adiponectin levels in T2D patients are predictive of progression of DKD.28 These findings are in agreement with the changes we observed in serum adiponectin concentrations observed in the present study. The potential mechanism may include the secretion of beneficial adipokines by refreshed BAT that then act on the kidney. Hondares et al.13 recently reported that BAT could synthesize and secret Fgf21 after thermogenic activation. Elevated serum Fgf21 concentrations may be a useful indicator of kidney disease progression.29 In the present study, we also observed a marked increase in serum Fgf21 concentrations in diabetic mice, suggesting that our diabetic model is an FGF21-resistant state. However, there was no change in serum FGF21 concentrations after BAT activation. To further explore how Fgf21 could act in the kidney, we tested Fgf21-related components, such as β-klotho and Fgfr1c. Interestingly, Fgf21-related components in the kidneys were markedly reduced following activation of BAT, suggesting that BAT activation enhances the sensitivity to Fgf21.
In eukaryotes, AMPK is a crucial kinase that primarily regulates energy metabolic homeostasis.30 Both adiponectin and Fgf21 can activate the AMPK signaling pathway.26, 31 In the present study, we demonstrated that CL316,243 treatment activated the AMPK/Sirt1/Pgc1α axis in the diabetic kidney. Accumulating data indicates that activation of the AMPK/Sirt1/Pgc1α pathway prevents inflammation and oxidative stress by inhibiting the nuclear factor-κB pathway and promoting fatty-acid β-oxidation, as well as the expression of antioxidants.32-34 In addition, AMPK acts as an antifibrotic by reducing Nox4/Tgf-β1 signaling.35 These possible mechanisms finally result in anti-oxidative stress, anti-inflammatory, and antifibrotic effects in the diabetic kidney following CL316,243 treatment.
Recently, BAT was reported to regulate hepatic metabolism by secreting miRNAs.4 Coincidentally, miRNAs also play vital roles in the development of DKD.36 The miRNAs may be another key medium between BAT and kidney. In the present study, BAT activation significantly upregulated some serum miRNAs and downregulated the renal expression of their related target genes, which are involved in the pathogenesis of DKD. In the present study we only focused on the mediums between BAT and the kidney, and we will explore the mechanisms by which these mediums act on the kidneys in the near future.
In summary, BAT activation has beneficial renal effects in diabetic mice by improving metabolic and activating renal AMPK/Sirt1/Pgc1α signaling pathways. This may be mediated by effects of circulating BAT-derived adipokines and miRNAs on the kidney.
ACKNOWLEDGEMENTS
We thank Min Yue at Laboratory Animal Center, Southern Medical University, Guangzhou,Guangdong, China for technical support.
Disclosure
None declared.


