Insight into plant cell wall chemistry and structure by combination of multiphoton microscopy with Raman imaging
Zsuzsanna Heiner
Department of Chemistry, Humboldt-Universität zu Berlin, Berlin, Germany
SALSA School of Analytical Sciences Adlershof, Humboldt-Universität zu Berlin, Berlin, Germany
Zsuzsanna Heiner and Ingrid Zeise contributed equally to this study.Search for more papers by this authorIngrid Zeise
Department of Chemistry, Humboldt-Universität zu Berlin, Berlin, Germany
Zsuzsanna Heiner and Ingrid Zeise contributed equally to this study.Search for more papers by this authorRivka Elbaum
The Smith Institute of Plant Sciences and Genetics in Agriculture, The Hebrew University of Jerusalem, Rehovot, Israel
Search for more papers by this authorCorresponding Author
Janina Kneipp
Department of Chemistry, Humboldt-Universität zu Berlin, Berlin, Germany
SALSA School of Analytical Sciences Adlershof, Humboldt-Universität zu Berlin, Berlin, Germany
Correspondence
Janina Kneipp, Department of Chemistry, Humboldt Universität zu Berlin, Brook-Taylor-Str. 2, 12489 Berlin, Germany. Email: [email protected]
Search for more papers by this authorZsuzsanna Heiner
Department of Chemistry, Humboldt-Universität zu Berlin, Berlin, Germany
SALSA School of Analytical Sciences Adlershof, Humboldt-Universität zu Berlin, Berlin, Germany
Zsuzsanna Heiner and Ingrid Zeise contributed equally to this study.Search for more papers by this authorIngrid Zeise
Department of Chemistry, Humboldt-Universität zu Berlin, Berlin, Germany
Zsuzsanna Heiner and Ingrid Zeise contributed equally to this study.Search for more papers by this authorRivka Elbaum
The Smith Institute of Plant Sciences and Genetics in Agriculture, The Hebrew University of Jerusalem, Rehovot, Israel
Search for more papers by this authorCorresponding Author
Janina Kneipp
Department of Chemistry, Humboldt-Universität zu Berlin, Berlin, Germany
SALSA School of Analytical Sciences Adlershof, Humboldt-Universität zu Berlin, Berlin, Germany
Correspondence
Janina Kneipp, Department of Chemistry, Humboldt Universität zu Berlin, Brook-Taylor-Str. 2, 12489 Berlin, Germany. Email: [email protected]
Search for more papers by this authorAbstract
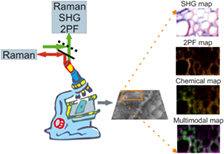
Spontaneous Raman scattering microspectroscopy, second harmonic generation (SHG) and 2-photon excited fluorescence (2PF) were used in combination to characterize the morphology together with the chemical composition of the cell wall in native plant tissues. As the data obtained with unstained sections of Sorghum bicolor root and leaf tissues illustrate, nonresonant as well as pre-resonant Raman microscopy in combination with hyperspectral analysis reveals details about the distribution and composition of the major cell wall constituents. Multivariate analysis of the Raman data allows separation of different tissue regions, specifically the endodermis, xylem and lumen. The orientation of cellulose microfibrils is obtained from polarization-resolved SHG signals. Furthermore, 2-photon autofluorescence images can be used to image lignification. The combined compositional, morphological and orientational information in the proposed coupling of SHG, Raman imaging and 2PF presents an extension of existing vibrational microspectroscopic imaging and multiphoton microscopic approaches not only for plant tissues.
Supporting Information
| Filename | Description |
|---|---|
| jbio201700164-sup-0001-author-biographies.pdfPDF document, 206.5 KB | Author Biographies |
| jbio201700164-sup-0002-suppinfo.pdfPDF document, 371.8 KB |
Figure S1. Schematic illustration of the experimental set-up for NIR and visible (VIS) laser excitations. Within 1 microspectroscopic setup, spontaneous Raman scattering, SHG and 2PF spectra can be observed. NIR excitation for SGH and of 2PF: 150 fs, 73 MHz laser pulses at 850 nm with 6 × 10¹¹ W/cm² peak intensity and 7 ps pulses at 1064 nm, 75 MHz, 2.4 × 10¹⁰ W/cm2. NIR excitation of Raman scattering: intensity of 2.2 × 10⁶ W/cm2 at 785 nm (cw); VIS excitation of Raman scattering: intensity of 1.6 × 10⁶ W/cm2 at 532 nm (cw). Step size for each mapping measurement was 1 μm. Figure S2. (A, B) SHG images of sorghum root cross-sections corresponding to the Figures 1A and D, respectively. (A) SHG signal excited at 1064 nm: 0 to 2100 counts (white to red), (B) polarization-resolved SHG signal excited at 850 nm: 0 to 800 counts (white to red), detection was perpendicular to the excitation field. Scale bars in are 10 μm, step size 1 μm. Excitation was horizontally. Figure S3. Chemical Raman images of sorghum root sections. (A, B) Images correspond to Figure 1A-C and (C, D) images correspond to Figures 2 and Figure 3A-D. (A, C) Chemical images based on the linear baseline corrected (1160-1185 cm−1) intensity of the ferula and p-coumaric acid Raman signal at 1171 cm−1, representing mostly the xylem cell wall regions. (B, D) Chemical image based on the baseline corrected (1115-1160 cm−1) intensity of the suberin Raman signal at 1138 cm−1, representing mostly the endodermis regions. Image scales are (A) 0 to 920 cps, (B) 0 to 155 cps, (C) 0 to 1660 cps and (D) 0 to 380 cps. Scale bars are 10 μm and step size is 1 μm. Figure S4. Selected chemical images based on the intensity of the cellulose Raman signal at 1093 cm−1. The cellulose maps (A, B and C) correspond to the lignin chemical images shown in Figure 3C, G and K, respectively. The maps show the baseline corrected (1106-1079 cm−1) maximum signal with color scales (from black to red to white) of (A) 70 to 180 cps, (B) 100 to 360 cps and (C) 120 to 530 cps. The polarization of the excitation light is indicated by an arrow in each map. Scale bars are 10 μm and step size is 1 μm. Figure S5. (A-C) Overlay of SHG images of data shown in Figure 3A and B, E and F, and I and J, respectively. (D) Overlay of SHG images of data shown in Figure 4A and E. Color scales are the same as in corresponding Figures in Figure 3 and Figure 4. (A) Normalized to 3800 counts; (B) normalized to 7800 counts; (C) normalized to 7200 counts and (D) normalized to 1700 counts. The excitation polarization colored blue was along the vertical, and colored red was along the horizontal axis in the plane of each figure. The detection direction was vertical in all cases. Scale bars are 10 μm and step size is 1 μm. Figure S6. (A) Overlay of Phenyl ring stretching mode (green, intensity at 1602 cm−1) and cellulose (red, intensity at 1093 cm−1) Raman map of sorghum root section with bright field image and (B) Phenyl ring stretching mode (green, intensity at 1602 cm−1) and 2-photon autofluorescence (purple, at 530 nm) map of sorghum root section with bright field image. The vibrational band at 1602 cm−1 attributable to lignin and bound or unbound components such as ferulic and p-coumaric acid [3,8]. Scale bars are 10 μm and step size is 1 μm. Table S1. Band assignments in the Raman spectra of sorghum sections. s, symmetric; as; asymmetric; conj, conjugated; ν, stretching; δ, deformation; bend, bending; endodermis, signal more prominent in endodermis; xylem, signal more prominent in xylem region. |
Please note: The publisher is not responsible for the content or functionality of any supporting information supplied by the authors. Any queries (other than missing content) should be directed to the corresponding author for the article.
REFERENCES
- 1V. V. Roshchina, Int. J. Spectrosc. 2012, 2012, 1.
10.1155/2012/124672 Google Scholar
- 2F. Jamme, S. Kascakova, S. Villette, F. Allouche, S. Pallu, V. Rouam, M. Refregiers, Biol. Cell 2013, 105, 1.
- 3N. Gierlinger, M. Schwanninger, Spectroscopy 2007, 21(2), 69.
- 4Y. Abraham, R. Elbaum, New Phytol. 2013, 197(3), 1012.
- 5F. Schulte, U. Panne, J. Kneipp, J. Biophotonics 2010, 3(8-9), 542.
- 6M. Bagcioglu, B. Zimmermann, A. Kohler, PLoS One 2015, 10(9), e0137899.
- 7A. M. Boudet, S. Kajita, J. Grima-Pettenati, D. Goffner, Trends Plant Sci. 2003, 8(12), 576.
- 8P. Heraud, S. Caine, G. Sanson, R. Gleadow, B. R. Wood, D. McNaughton, New Phytol. 2007, 173(1), 216.
- 9U. P. Agarwal, Planta 2006, 224(5), 1141.
- 10F. Schulte, J. Lingott, U. Panne, J. Kneipp, Anal. Chem. 2008, 80(24), 9551.
- 11S. Seifert, V. Merk, J. Kneipp, J. Biophotonics 2016, 9(1-2), 181.
- 12M. Joester, S. Seifert, F. Emmerling, J. Kneipp, J. Biophotonics 2017, 10(4), 542.
- 13M. Chylińska, M. Szymańska-Chargot, B. Kruk, A. Zdunek, Food Chem. 2016, 196, 114.
- 14A. Ambrose, S. Lohumi, W.-H. Lee, B. K. Cho, Sens. Actuators B 2016, 224, 500.
- 15X. Zhang, Z. Ji, X. Zhou, J.-F. Ma, Y.-H. Hu, F. Xu, Anal. Chem. 2015, 87(2), 1344.
- 16J. Felten, H. Hall, J. Jaumot, R. Tauler, A. de Juan, A. Gorzsás, Nat. Protoc. 2015, 10(2), 217.
- 17S. K. Lau, P. Winlove, J. Moger, O. L. Champion, R. W. Titball, Z. H. Yang, Z. R. Yang, J. Raman Spectrosc. 2012, 43(9), 1299.
- 18B. Zimmermann, A. Kohler, PLoS One 2014, 9(4), e95417.
- 19P.-H. Chen, R. Shimada, S. Yabumoto, H. Okajima, M. Ando, C.-T. Chang, L.-T. Lee, Y.-K. Wong, A. Chiou, H.-o. Hamaguchi, Sci. Rep. 2016, 6, 20097.
- 20G. R. Littlejohn, J. C. Mansfield, J. T. Christmas, E. Witterick, M. D. Fricker, M. R. Grant, N. Smirnoff, R. M. Everson, J. Moger, J. Love, Front. Plant Sci. 2014, 5, 140.
- 21W. R. Zipfel, R. M. Williams, W. W. Webb, Nat. Biotechnol. 2003, 21(11), 1369.
- 22A. Zoumi, A. Yeh, B. J. Tromberg, PNAS 2002, 99(17), 11014.
- 23R. Elbaum, E. Tal, A. I. Perets, D. Oron, D. Ziskind, Y. Silberberg, H. D. Wagner, J. Dent. 2007, 35(2), 150.
- 24M. H. Adatia, R. T. Besford, Ann. Bot. 1986, 58(3), 343.
- 25I. Freund, M. Deutsch, A. Sprecher, Biophys. J. 1986, 50(4), 693.
- 26W. P. Dempsey, S. E. Fraser, P. Pantazis, Bioessays 2012, 34(5), 351.
- 27M.-Y. Chen, G.-Y. Zhuo, K.-C. Chen, P.-C. Wu, T.-Y. Hsieh, T.-M. Liu, S.-W. Chu, BMC Plant Biol. 2014, 14(1), 175.
- 28G. Mizutani, Y. Sonoda, H. Sano, M. Sakamoto, T. Takahashi, S. Ushioda, JOL 2000, 87, 824.
- 29J. R. M. Brown, A. C. Millard, P. J. Campagnola, Opt. Lett. 2003, 28(22), 2207.
- 30A. H. Reshak, V. Sarafis, R. Heintzmann, Micron 2009, 40(3), 378.
- 31G. Cox, N. Moreno, J. Feijo´, J. Biomed. Opt. 2005, 10(2), 024013.
- 32M. G. Lagorio, G. B. Cordon, A. Iriel, Photochem. Photobiol. Sci. 2015, 14(9), 1538.
- 33H. A. Currie, C. C. Perry, Ann. Bot. 2007, 100(7), 1383.
- 34S. Kumar, Y. Milstein, Y. Brami, M. Elbaum, R. Elbaum, New Phytol. 2016, 213(2), 791.
- 35C. S. Shi, J. W. Schopf, A. B. Kudryavtsev, Am. J. Bot. 2013, 100(8), 1626.
- 36A. W. Robards, S. M. Jackson, D. T. Clarkson, J. Sanderson, Protoplasma 1973, 77(2-3), 291.
- 37L. Sun, S. Singh, M. Joo, M. Vega-Sanchez, P. Ronald, B. A. Simmons, P. Adams, M. Auer, Biotechnol. Bioeng. 2016, 113(1), 82.
- 38N. Gierlinger, S. Luss, C. König, J. Konnerth, M. Eder, P. Fratzl, J. Exp. Bot. 2010, 61(2), 587.
- 39U. P. Agarwal, R. H. Atalla, Planta 1986, 169(3), 325.
- 40U. P. Agarwal, Advances in Lignocellulosics Characterization, TAPPI Press, Atlanta, GA 1999, p. 201.
- 41R. E. Clavijo, D. J. Ross, R. F. Aroca, J. Raman Spectrosc. 2009, 40(12), 1984.
- 42J. Ma, X. Zhou, J. Ma, Z. Ji, X. Zhang, F. Xu, Microsc. Microanal. 2014, 20(03), 956.
- 43L. Sun, P. Varanasi, F. Yang, D. Loqué, B. A. Simmons, S. Singh, Biotechnol. Bioeng. 2012, 109(3), 647.
- 44N. Gierlinger, Front. Plant Sci. 2014, 5, 306.
- 45B. Liu, P. Wang, J. I. Kim, D. Zhang, Y. Xia, C. Chapple, J.-X. Cheng, Anal. Chem. 2015, 87(18), 9436.
- 46L. Donaldson, K. Radotić, A. Kalauzi, D. Djikanović, M. Jeremić, J. Struct. Biol. 2010, 169(1), 106.
- 47R. F. Patterson, H. Hibbert, J. Am. Chem. Soc. 1943, 65(10), 1862.
- 48M. Rys, M. Szaleniec, A. Skoczowski, I. Stawoska, A. Janeczko, Open Chem. 2016, 13(1), 1091.
- 49M. Szymańska-Chargot, P. M. Pieczywek, M. Chylińska, A. Zdunek, Chemom. Intel. Lab. Syst. 2016, 151, 136.
- 50T. Takei, N. Kato, T. Iijima, M. Higaki, Mokuzai Gakkaishi 1995, 41(2), 229.
- 51X. Wang, T. Keplinger, N. Gierlinger, I. Burgert, Ann. Bot. 2014, 114(8), 1627.
- 52F. S. Parker, Applications of Infrared, Raman, and Resonance Raman Spectroscopy in Biochemistry, Plenum Press, New York 1983.
- 53Z. Ji, J. F. Ma, Z. H. Zhang, F. Xu, R. C. Sun, Ind. Crops Prod. 2013, 47, 212.
- 54J. H. Wiley, R. H. Atalla, Carbohydr. Res. 1987, 160, 113.
- 55S. Brasselet, Adv. Opt. Photonics 2011, 3(3), 205.
- 56X. Chen, C. M. Lee, H.-F. Wang, L. Jensen, S. H. Kim, J. Phys. Chem. C 2017, 121(34), 18876. https://doi.org/10.1021/acs.jpcc.7b03037.
- 57M. T. M. Willemse, in Physico-Chemical Characterisation of Plant Residues for Industrial and Feed Use (Eds: A. Chesson, E. R. Ørskov), Springer, Dordrecht, The Netherlands 1989, p. 50.
10.1007/978-94-009-1131-4_5 Google Scholar
- 58L. A. Donaldson, J. Paul Knox, Plant Physiol. 2012, 158(2), 642.
- 59C. M. Altaner, E. N. Tokareva, M. C. Jarvis, P. J. Harris, Tree Physiol. 2010, 30(6), 782.
Citing Literature