Optimizing agitated saline volume for contrast echocardiography: Balancing diagnostic performance and operator fatigue
[Correction added on 28 September 2024, after first online publication: Figures 2, 3, 4 and Data Availability Statement had been updated.]
Abstract
Background
Agitated saline contrast echocardiography, essential for patent foramen ovale detection, typically uses a 10 mL saline protocol, which may lead to operator fatigue and compromise diagnostic accuracy. This study aimed to identify an optimal saline volume that balances diagnostic efficacy and minimizes operator fatigue.
Methods
Fifty-three patients with suspected patent foramen ovale underwent echocardiography using three saline protocols: 10 mL (9 mL saline + 1 mL air), 7 mL (6.4 mL saline + 0.6 mL air), and 5 mL (4.6 mL saline + 0.4 mL air). The protocols were evaluated for their impact on microbubble signal intensity in the right atrium, right-to-left shunt grading, and operator fatigue, as assessed by the Borg CR10 scale.
Results
The signal intensities were comparable between the 10 mL and 7 mL protocols, while the 5 mL protocol showed significantly lower signal intensities at all time points (p < 0.001). The 7 mL protocol achieved 100% right-to-left shunt grading concordance with the 10 mL protocol, while the 5 mL protocol showed decreased accuracy and recall. Operator fatigue significantly decreased with the reduction in saline volume (p < 0.001), and the 7 mL protocol demonstrated optimal diagnostic accuracy and reduced fatigue.
Conclusion
A 7 mL agitated saline volume is recommended for contrast echocardiography to maintain diagnostic accuracy while significantly reducing operator fatigue, offering a practical balance between diagnostic precision and operator comfort.
Abbreviations
-
- PFO
-
- patent foramen ovale
-
- RA
-
- right atrium
-
- RLS
-
- right-to-left shunting
-
- ROI
-
- region of interest
1 INTRODUCTION
Patent foramen ovale (PFO) is characterized by failure in fusion of the primary and secondary septum in the upper anterior part of the interatrial septum after birth. This phenomenon is observed in approximately 25% of adults. This anatomical peculiarity allows blood clots from the venous system to bypass the lungs and enter the arterial system through the PFO, potentially leading to arterial embolism, with stroke being the most significant complication. Such events can drastically reduce the quality of life of affected patients [1, 2].
The growing reliance on percutaneous treatment for PFO highlights the critical need for early and accurate diagnosis [3]. Transesophageal echocardiography is recognized as the gold standard for PFO detection, whereas the clinical significance of PFO is primarily determined by the presence of right-to-left shunting (RLS). Consequently, PFO without RLS holds minimal clinical relevance. Thus, agitated saline contrast echocardiography is an invaluable and flexible tool for the clinical screening of PFO associated with RLS [4].
Current protocols for the preparation of agitated saline, as recommended by the American Society of Echocardiography and the Society for Cardiovascular Angiography and Intervention [4], alongside insights from recent literature reviews [5], include: (1) 8 mL saline + 1 mL air + 1 mL blood; (2) 9 mL saline + 1 mL air; and (3) a mix of 50% glucose and 50% saline in lieu of pure saline. The guideline mandates agitating the solution between two syringes at least 20 times at a frequency of 60–80 times/min. However, the physical build and hand size of female Asian nurses, who often find the recommended 10 mL protocol challenging due to the excessive angle required between the thumb and index finger required for agitation (Figure 1a), can lead to muscle fatigue. This fatigue may compromise the quality of air–saline oscillation and, by extension, the accuracy of the examination results. Although reducing the solution volume may alleviate the angle and operator fatigue, there is a risk of an insufficient microbubble concentration in the right atrium (RA), potentially leading to an underestimation of RLS.
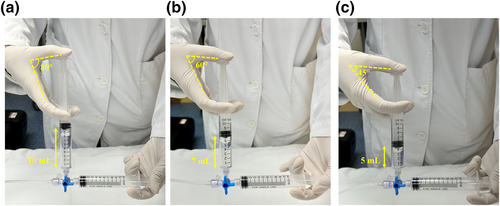
Comparison of the angle between the thumb and the index finger of the assistant holding the syringe for air–saline agitation with different volume protocols. (a): 10 mL protocol: 9 mL saline + 1 mL air; (b): 7 mL protocol: 6.4 mL saline + 0.6 mL air; (c): 5 mL protocol: 4.6 mL saline + 0.4 mL air.
This study posited that variations in solution volume, while maintaining a constant air microbubble concentration, influence the degree of RLS. Insufficient solution volume may lead to an inadequate microbubble concentration in the RA, thus underestimating RLS severity. Conversely, an excessive solution volume may ensure maximum RLS visibility, but this is at the cost of increased labor for the nurse tasked with saline agitation.
This study aimed to investigate the effects of different solution volumes, while keeping the air–saline ratio constant, on the microbubble concentration of the RA and RLS grading, and the workload of nurses. The goal was to determine the optimal balance among these factors, striving to enhance both diagnostic accuracy and operational efficiency.
2 METHODS
2.1 Study population
This prospective cross-sectional study was approved by the Ethics Committee of Guangdong Provincial People's Hospital and was conducted in accordance with the principles of the Declaration of Helsinki (ID: KY-H-2020-454-04, approval date: 2021-04-20). This study was not registered. From May 27, 2021 to July 21, 2021, a total of 53 patients underwent agitated saline contrast echocardiography and were included in this study. The inclusion criteria were as follows: (1) patients suspected of PFO; (2) ability to undergo a standardized Valsalva maneuver (with forced expiration into a pressure monitoring device and raising chest pressure to ≥40 mmHg); (3) a decrease in mitral valve flow velocity (E peak) of ≥20 cm/s before release; and (4) bulging of the interatrial septum toward the left atrium during the Valsalva maneuver. The exclusion criteria were as follows: (1) an inability to perform a standardized Valsalva maneuver; (2) elevated left atrial pressure [such as left ventricular systolic/diastolic dysfunction indicated by a left ventricular ejection fraction <40%], mitral stenosis [mitral valve area <2.0 cm2], or left ventricular hypertrophy with left atrial enlargement ([left atrial dimension in the long-axis view of the left ventricle >4 cm]); (3) insufficient filling of the RA with agitated saline; (4) large Eustachian valve; and (5) negative contrast in the RA caused by rapid inferior vena cava reflux.
2.2 Agitated saline contrast echocardiography
2.2.1 Agitated saline protocols
The purpose of this study was to explore the optimal method for saline agitation. Under the premise of a fixed ratio of approximately 9:1 of saline to air, we used the following three protocols (Figure 1): (1) 10 mL agitated saline: 9 mL saline + 1 mL air (recommended by the American Society of Echocardiography and Society for Cardiovascular Angiography and Interventions); (2) 7 mL agitated saline: 6.4 mL saline + 0.6 mL air; (3) 5 mL agitated saline: 4.6 mL saline + 0.4 mL air.
2.2.2 Process and operating methods
To prepare for the examination, a venous catheter was inserted into either the median cubital vein or the prominent vein, and connected to a three-way stopcock. The patency of the vein was then confirmed. Using the 10 mL protocol as an example, 9 mL saline was combined with 1 mL room air and agitated between two empty 10 mL syringes using a three-way stopcock. The saline and air were mixed by pushing them back and forth between the two syringes at least 20 times at a frequency of 60–80 times/minute. The nurse would confirm the injection time with the echocardiographer before administering the agitated saline via bolus injection into the median cubital vein within 2–3 s. The patient's arm was elevated or squeezed to promote rapid microbubble entry into the RA.
We used forced expiration against the pressure monitoring device as the provocative maneuver. Forced expiration was released on microbubble entry into the RA. The apical four-chamber view was captured for at least 10 cardiac cycles after the microbubbles were detected in the RA. The examinations were performed only once at (10 mL protocol) and three times after the provocative maneuver (using the 10 mL, 7 mL, and 5 mL protocols in sequence) with a 2-min interval between each examination.
The echocardiographer observed the flow of microbubbles at rest and after the release of expiratory effort to determine the source of any RLS. Caution was exercised to maintain the same machine settings for all injections.
2.2.3 Assessment of the microbubble concentration in the RA
The “ROI” module of Philips' Qlab software was used to evaluate the microbubble concentration in the RA. A 5 × 5-mm region of interest (ROI) was deliberately selected in the para-interatrial septum of the RA as the opacification of this area and leftward septal bulging are considered crucial prerequisites for accurate PFO detection [6]. The scattering signal intensity (unit: dB) of the microbubbles was quantified when the RA was fully opacified by microbubbles, and at six and 10 cardiac cycles after opacification (Figure S1).
2.2.4 Assessment of RLS
The assessment of RLS was based on the number of microbubbles appearing in the left atrium on one still frame, with RLS graded as follows [5]: Grade 0: no microbubbles detected, no RLS; Grade I: 1–10 microbubbles, indicating small RLS; Grade II: 10–30 microbubbles, indicating moderate RLS; Grade III: >30 microbubbles, indicating large RLS.
2.3 Perceived exertion
The nurses were asked to rate their exertion on the Borg CR10 scale after each agitation of saline, combining all sensations and feelings of physical stress and fatigue [7]: 0: no exertion at all; 0.5: very, very slight; 1: very slight; 2: slight; 3: moderate; 4: somewhat severe; 5: severe; 7: very severe; 9: very, very severe; 10: maximal.
2.4 Statistical analysis
The data were analyzed using SPSS 25.0 (IBM). Agreement of the RLS grading evaluation among the different agitated saline protocols was assessed using the confusion matrix and Kappa coefficients. The signal intensity in the RA and Borg scores was analyzed using the t-test (normal distribution). Paired t-tests were used in cases of underestimated RLS to compare the microbubble concentration in the RA and the Borg scores of the different protocols. Two-sided p < 0.05 was considered statistically significant.
3 RESULTS
3.1 Baseline characteristics
This study enrolled a total of 53 patients (Table 1), including 29 males (54.72%). Fourteen patients (26.42%) reported symptoms of migraine, 13 patients (24.53%) had a history of stroke or transient ischemic attack, and 26 patients (49.06%) had dizziness.
| Characteristics | Value N (%) or mean ± SD |
|---|---|
| Age, years | 39.26 ± 14.79 |
| Male, n (%) | 29 (54.72%) |
| Systolic blood pressure, mmHg | 126.58 ± 16.05 |
| Diastolic blood pressure, mmHg | 79.72 ± 15.38 |
| Heart rate, beats/min | 79.17 ± 12.83 |
| Body mass index, kg/m2 | 21.98 ± 2.62 |
| Symptoms | |
| Migraine, n (%) | 14 (26.42%) |
| Stroke/TIA, n (%) | 13 (24.53%) |
| Dizziness, n (%) | 26 (49.06%) |
- Abbreviation: TIA, transient ischemic attack.
3.2 Microbubble concentration in the RA
Table 2 shows that there was no statistically significant difference in the microbubble signal intensity in the RA between the 10 mL and 7 mL protocols at each time point. However, the signal intensity with the 5 mL protocol was significantly lower than that with the 10 mL protocol at all time points.
| 10 mL (mean ± SD) | 7 mL (mean ± SD) | p value | 5 mL (mean ± SD) | p value | |
|---|---|---|---|---|---|
| ROI-initial, dB | 47.73 ± 1.45 | 47.53 ± 1.87 | 0.53 | 46.72 ± 1.66 | <0.001 |
| ROI-6th cardiac cycle, dB | 45.12 ± 1.68 | 44.65 ± 1.79 | 0.16 | 43.61 ± 2.14 | <0.001 |
| ROI-10th cardiac cycle, dB | 43.20 ± 1.96 | 42.78 ± 1.98 | 0.28 | 41.51 ± 2.45 | <0.001 |
- Abbreviation: ROI, region of interest.
3.3 RLS grading
Using 10 mL as the reference, the confusion matrix (Figure 2) showed that the 7 mL protocol had 100% recall and precision. The recall of the 5 mL protocol was 66.67% for grade I and II and 84.38% for grade III. Table 3 demonstrates that the diagnostic results using the 10 mL and 7 mL protocols were perfectly consistent, with a kappa value of 1% and 100% agreement. However, the diagnostic kappa value for the 10 mL and 5 mL protocols was 0.78, with 86.79% agreement. Underestimation of the shunt grade occurred in seven patients with the 5 mL protocol.
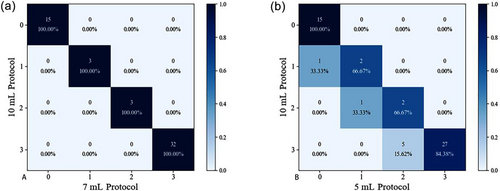
Confusion matrix of different agitated saline protocols using the 10 mL protocol as the reference. Number (percentage): the number of cases (recall). (a) 10 mL protocol vs. 7 mL protocol; (b) 10 mL protocol vs. 5 mL protocol.
| Methods | Agreement | Kappa | Z | p value |
|---|---|---|---|---|
| 10 versus 7 mL | 100.00% | 1.00 | 9.74 | <0.001 |
| 10 versus 5 mL | 86.79% | 0.78 | 8.14 | <0.001 |
- Abbreviation: RLS, right-to-left shunting.
3.4 Perceived exertion
Figure S2 demonstrates a gradual reduction in the Borg score from the 10 mL protocol to the 5 mL protocol (10 vs. 7 mL vs. 5 mL: 8.26 ± 0.49 vs. 6.60 ± 0.66 vs. 5.49 ± 0.61, p < 0.001).
3.5 Subgroup analysis
In this study, seven cases of RLS grading with the 5 mL protocol were underestimated. One case of grade I RLS was mistakenly diagnosed as grade 0, one case of grade II was mistakenly diagnosed as grade I, and five cases of grade III were mistakenly diagnosed as grade II. As shown in Table 4, the microbubble signal intensity in the RA was lower with the 5 mL protocol than with the 10 mL protocol at each cardiac cycle (p < 0.05). Additionally, the Borg score was significantly lower with the 5 mL protocol than with the 10 mL protocol (paired mean difference 2.71, 95% confidence interval 2.26–3.17, p < 0.01). Figure 3 shows the changes in ROI signal intensity in the RA and the Borg score in each case with underestimated RLS with the 10 mL and 5 mL protocols.
| 10 mL (mean ± SD) | 5 mL (mean ± SD) | Paired difference | p value | |
|---|---|---|---|---|
| ROI-RA, dB | 47.83 ± 1.18 | 46.69 ± 1.57 | 1.13 (0.06, 2.21) | 0.04 |
| ROI-6 cycle, dB | 44.82 ± 1.10 | 43.29 ± 1.79 | 1.53 (0.73, 2.33) | <0.01 |
| ROI-10 cycle, dB | 42.62 ± 1.76 | 41.16 ± 1.90 | 1.46 (0.26, 2.65) | 0.03 |
| Borg score | 8.57 ± 0.49 | 5.86 ± 0.35 | 2.71 (2.26, 3.17) | <0.01 |
- Abbreviations: RLS, right-to-left shunting; ROI, region of interest.
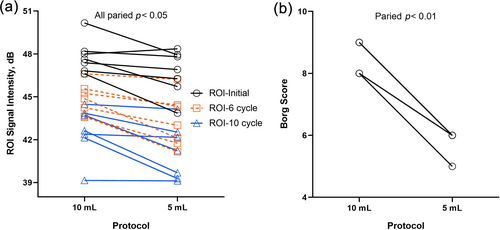
(a) Changes in microbubble concentrations in the RA, and (b) Borg scores with the 10 mL and 5 mL protocols for patients with underestimated RLS.
3.6 Case
Figure 4 displays two cases of agitated saline contrast echocardiography using different protocols. Patient 1 was diagnosed with RLS III using the 10 mL, 7 mL, and 5mL protocols. However, compared with the 10 mL protocol, patient 2 was underestimated as RLS II with the 5 mL protocol and correctly diagnosed with the 7 mL protocol.
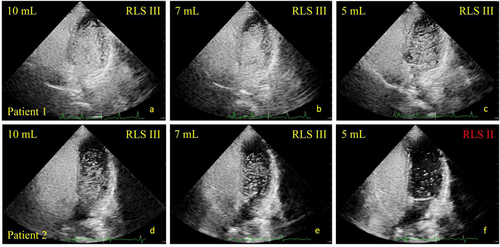
Agitated saline contrast echocardiography using different protocols. Patient 1 was diagnosed with RLS III with (a) 10 mL protocol; (b) 7 mL protocol; (c) 5 mL protocol. However, compared with the (d) 10 mL protocol. Patient 2 was underestimated as RLS II with the (f) 5 mL protocol and correctly diagnosed with the (e) 7 mL protocol. RA, right atrium; RLS, right-to-left shunting.
4 DISCUSSION
This study provides important insights into the impact of varying volumes of agitated saline solution on the concentration of microbubbles in the RA and RLS grading, and the degree of operator fatigue, revealing that optimization of the saline–air ratio can maintain diagnostic accuracy while potentially reducing operator workload.
4.1 Operator fatigue considerations in diagnostic accuracy
In clinical practice, false-negative results are common for various reasons, such as patient failure to complete the standard provocative maneuver or the presence of diseases that increase left atrial pressure. This failure may result in the right atrial pressure failing to exceed the left atrial pressure, leading to an underestimation of the shunt volume. To ensure accurate diagnosis and enhance diagnostic confidence, a protocol necessitating three to five repeat examinations is often required [8]. However, the length of a 10 mL syringe filled with solution measures approximately 10 cm, making it challenging for some practitioners, particularly female nurses, to grip and exert force comfortably. Furthermore, agitating saline involves a demanding process of dispersing the air into the saline through high-frequency vibration of sufficient duration, culminating in rapid injection into the patient's vein. This procedure can induce muscle fatigue in nurses, which may compromise the reliability of subsequent examinations. Therefore, this study suggests a more efficient and clinically feasible protocol, aiming to alleviate the physical demands placed on healthcare providers.
4.2 Significance of the microbubble concentration and persistence in the RA
Backscattering echo intensity is directly proportional to the change in acoustic impedance between the blood and the gas producing the bubbles. Similarly, ultrasound reflectivity is not only proportional to the fourth power of the particle diameter but also increases with the concentration of the particles themselves [9]. In this study, the acoustic power, depth of field, and probe frequency were maintained constant for each individual patient throughout the protocols, ensuring uniformity in the measurement conditions. Therefore, a higher acoustic intensity of the ROI in the RA indicates a higher bubble concentration, emphasizing the direct relationship between acoustic intensity and microbubble concentration.
The diagnosis of intracardiac shunt, such as PFO, necessitates the observation of microbubbles entering the left atrium through the atrial septum after the Valsalva maneuver or their appearance in the left atrium within three to six cardiac cycles. A detection time longer than six cardiac cycles suggests pulmonary shunt [4]. The guidelines advocate for the observation of 10 cardiac cycles after opacification of the RA. Therefore, the ideal protocol for agitating saline should aim to use the minimum solution volume while ensuring that both the microbubble concentration of the RA remains consistent for 10 cardiac cycles and the RLS grade is unaffected, with the 10 mL protocol serving as the reference. As the microbubble concentration after >10 cardiac cycles lacks diagnostic significance, this study evaluated the baseline concentration as well as the concentrations at six and 10 cardiac cycles with different protocols.
Although theoretically, normal saline and air can reach the desired concentration within the syringe with sufficient oscillation and frequency, an inadequate volume may result in their dilution upon injection into the body. This dilution could lead to a lower concentration and duration, potentially affecting the RLS results, highlighting the critical balance between volume and concentration for effective diagnosis.
4.3 Effect of different solution volumes on RLS diagnosis
This study used three protocols with decreasing volumes of saline, noting that lower volumes were more susceptible to dilution by blood upon entering the body, potentially leading to a failure in meeting the diagnostic requirements for RLS due to an insufficient microbubble concentration or duration.
In the RA ROI and diagnostic analysis, the 7 mL protocol demonstrated no statistically significant difference in ROI intensity within 10 cardiac cycles when compared with the conventional 10 mL protocol. This observation suggests that the microbubble concentration between the 7 mL and 10 mL protocols within the body was comparable. Furthermore, the 7 mL protocol exhibited perfect diagnostic consistency while imposing a lower labor burden, highlighting its potential as a more efficient alternative. In contrast, both the concentration in the RA and the diagnostic consistency with the 5 mL protocol were lower, suggesting that the 7 mL protocol represents an optimal balance for opacification of the RA and RLS diagnosis with a moderate labor burden.
During the evaluation of the 5 mL protocol, there were seven instances of RLS grade underestimation, albeit with a reduced labor burden. Notably, the 5 mL protocol was implemented last, implying that the nurses' cumulative fatigue should have been at its peak. Nevertheless, the actual Borg score recorded was the lowest, indicating that the underestimation was more likely attributable to the decreased microbubble concentration in the RA rather than to inadequate agitation of air–saline due to excessive fatigue. This distinction underscores the critical role of the microbubble concentration over physical exertion in determining diagnostic accuracy.
5 LIMITATIONS
This study had several limitations. First, this single-center cross-sectional study had a limited sample size. Second, the procedure for agitated saline echocardiography and RLS grading determination was empirically dependent. Third, perceived exertion is an individual subjective experience, related to body type and physical fitness. Therefore, studies with larger sample sizes, multiple echocardiographic experts, and nurses of varying body types are needed to demonstrate the clinical implementation of the present study results. Furthermore, it will be necessary to investigate whether the optimal solution volume proposed in this study is applicable to the air–blood–saline mixture and glucose–saline protocols. Using an air–blood–saline mixture can improve microbubble stability and produce smaller microbubbles, resulting in a higher microbubble concentration [10]. Therefore, the results may differ from those of this study. Lastly, our study excluded patients with elevated left atrial pressure. This exclusion could have potentially limited the generalizability of the findings to these specific patient groups.
6 CONCLUSION
This study indicates that reducing the volume of agitated saline to 7 mL can maintain a satisfactory diagnostic value and simultaneously reduce the labor involved in saline agitation. However, it is crucial to exercise caution when considering a further reduction in volume, as this could result in a decreased microbubble concentration and duration in the RA, potentially leading to an underestimation of the RLS grading. This balance underscores the importance of optimizing the solution volume for accurate RLS detection while ensuring the wellbeing of healthcare professionals.
AUTHOR CONTRIBUTIONS
Hezhi Li: Conceptualization (equal); writing – original draft (equal). Yanying Huang: Conceptualization (equal); methodology (equal). Dongling Luo: Conceptualization (equal); formal analysis (equal); methodology (equal). Song Wen: Writing – review & editing (equal). Hongwen Fei: Conceptualization (equal); funding acquisition (equal). Caojin Zhang: Funding acquisition (equal); project administration (equal); supervision (equal).
ACKNOWLEDGEMENTS
Our heartfelt appreciation goes to the team members of the echocardiography department for their invaluable support in collecting the echocardiogram data.
CONFLICT OF INTEREST STATEMENT
The authors declare no conflicts of interest.
ETHICS STATEMENT
This study was approved by the Ethics Committee of Guangdong Provincial People's Hospital and complied with the Declaration of Helsinki (KY-H-2020-454-04).
INFORMED CONSENT
All patients provided written informed consent at the time of entering this study.
Open Research
DATA AVAILABILITY STATEMENT
The data that support the findings of this study are available on request from the corresponding author. The data are not publicly available due to privacy or ethical restrictions.


