Microbial and metabolomic profiles of type 1 diabetes with depression: A case–control study
Abstract
Background
Depression is the most common psychological disorder in patients with type 1 diabetes (T1D). However, the characteristics of microbiota and metabolites in these patients remain unclear. This study aimed to investigate microbial and metabolomic profiles and identify novel biomarkers for T1D with depression.
Methods
A case–control study was conducted in a total of 37 T1D patients with depression (TD+), 35 T1D patients without depression (TD−), and 29 healthy controls (HCs). 16S rRNA gene sequencing and liquid chromatography–mass spectrometry (LC–MS) metabolomics analysis were conducted to investigate the characteristics of microbiota and metabolites. The association between altered microbiota and metabolites was explored by Spearman's rank correlation and visualized by a heatmap. The microbial signatures to discriminate TD+ from TD− were identified by a random forest (RF) classifying model.
Results
In microbiota, 15 genera enriched in TD− and 2 genera enriched in TD+, and in metabolites, 14 differential metabolites (11 upregulated and 3 downregulated) in TD+ versus TD− were identified. Additionally, 5 genera (including Phascolarctobacterium, Butyricimonas, and Alistipes from altered microbiota) demonstrated good diagnostic power (area under the curve [AUC] = 0.73; 95% CI, 0.58–0.87). In the correlation analysis, Butyricimonas was negatively correlated with glutaric acid (r = −0.28, p = 0.015) and malondialdehyde (r = −0.30, p = 0.012). Both Phascolarctobacterium (r = 0.27, p = 0.022) and Alistipes (r = 0.31, p = 0.009) were positively correlated with allopregnanolone.
Conclusions
T1D patients with depression were characterized by unique profiles of gut microbiota and serum metabolites. Phascolarctobacterium, Butyricimonas, and Alistipes could predict the risk of T1D with depression. These findings provide further evidence that the microbiota–gut–brain axis is involved in T1D with depression.
1 INTRODUCTION
Type 1 diabetes (T1D), an autoimmune disease characterized by the destruction of insulin-producing β cells in the pancreas, poses a significant health challenge worldwide.1 Individuals with T1D have an increased risk of psychological disorders including depression, anxiety, eating disorder, and substance abuse.2 These mental disorders in diabetes are associated with poor compliance with treatment and inadequate glycemic control, which increases the risk for severe diabetic complications and represents a major medical and economic burden worldwide.3-5
Depression is the most common psychological disorder in patients with T1D.6 A previous meta-analysis including 14 studies showed that the pooled prevalence of depressive symptoms was 30% in children and adolescents with T1D,7 and another study reported that the prevalence of depression was 24% in adults with T1D.6 However, the pathogenesis of depression in T1D is still unclear. Biological risk factors affecting the central nervous system are likely to be involved.8, 9
It has been reported that significant differences have been observed in the composition of gut microbiota and their associated metabolites in patients with T1D.10 Patients with T1D exhibit compositional alterations in the gut microbiota, including a decreased ratio of Firmicutes to Bacteroides, a decreased abundance of short-chain fatty acid-producing bacteria, and an increased abundance of Bacteroides and Bifidobacterium.11 However, the alteration of Bifidobacterium and Streptococcus lacks consistency.12-14 It was reported that gut microbiota might influence the psychological state via the microbiota–gut–brain axis.15-17 Similarly, studies on the effects of probiotic or prebiotic intake indicated an important role for the microbiota in regulating depression, anxiety, and other emotional responses.18-20 In addition, metabolomic tools contributed to a better understanding of the role of gut microbiota in the development of mental disorders.21, 22 While the common biological mechanisms of type 2 diabetes and depression (including insulin resistance, hippocampal atrophy, and endothelial dysfunction) are becoming increasingly understood,23, 24 the corresponding evidence for T1D is still limited25 and the correlations between microbial and metabolomic changes in T1D are currently rarely discussed.26, 27
In this study, we aimed to investigate microbial and metabolomic profiles and identify novel biomarkers for T1D with depression.
2 MATERIALS AND METHODS
2.1 Study populations
This study was designed as a noninterventional cross-sectional case–control study. All subjects were enrolled at the Third Affiliated Hospital of Sun Yat-sen University, Guangzhou, China. T1D patients were participants of the T1D China Registry Study (www.chictr.org.cn, ChiCTR2000034642).28 Inclusion criteria were participants diagnosed with T1D based on previous studies28, 29 and were at least 18 years of age. Exclusion criteria were (1) acute or chronic gastrointestinal disease; (2) history of intestinal surgery; (3) dietary modulation that was known to affect the microbiota; (4) use of antibiotics in the previous 3 months; (5) use of probiotics, prebiotics, or synbiotics in the previous month; or (6) combined neurological illness confirmed by a detailed clinical assessment. The recruitment of participants is depicted in Figure 1.
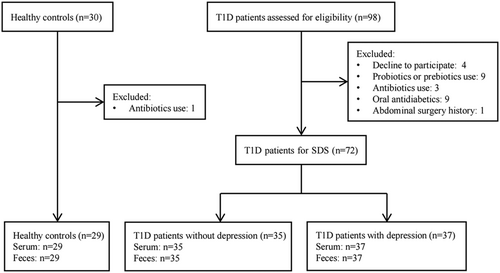
We consecutively recruited 72 T1D patients, including 37 T1D patients with depression (TD+) and 35 T1D patients without depression (TD−), and 29 healthy controls (HCs) matched for age and gender were recruited through public advertisements. The protocol for this study conformed to the ethical guidelines of the Declaration of Helsinki and was approved by the ethics committee of the Third Affiliated Hospital of Sun Yat-sen University (approval no. [2014]2-1051). All participants provided informed written consent.
2.2 Psychological assessment
The self-rating depression scale (SDS) was used to assess the depression of all participants.30 The scale included 20 items, with each item scoring from 1 to 4. It was calculated as the sum scores of all the items and then multiplied by a weight of 1.25. A higher score suggests a more sever status of depression, and a score ≥53 suggests depression in the Chinese population.31 The assessment training for researchers was conducted to ensure consistency. After assessment, patients with an SDS score ≥53 were further diagnosed by psychologists based on the International Classification of Diseases, Tenth Revision (ICD-10) criteria.
2.3 Clinical data and sample collection
Anthropometric and clinical data were collected from all participants, and T1D patients were instructed to follow healthy dietary patterns for diabetes. For microbiota and metabolomics analysis, fresh feces and serum samples were collected from the study population and kept in sterile tubes. All the samples were stored at −80°C as soon as possible till processing.
2.4 Fecal DNA extraction and 16S rRNA sequencing
The fecal DNA was extracted by the MagPure Stool DNA KF Kit B (Magen, China) according to the manufacturer's instructions. 16S rRNA gene amplification was performed by directional primers (515F: 5′-ACTCCTACGGGAGGCAGCAG-3′; 806R: 5′-GGACTACHVGGGTWTCTAAT-3′) targeting the V4 hypervariable regions. The polymerase chain reaction (PCR) was performed in triplicate, each reaction comprising a volume of 50 μL. The PCR products were purified using AmpureXP beads and eluted in the elution buffer. The validated libraries were used for sequencing on the Illumina MiSeq platform (BGI, Shenzhen, China) and generating 2 × 250 bp paired-end reads.
2.5 Sequencing data processing
Fastq file analysis was performed using the Quantitative Insights Into Microbial Ecology (QIIME2).32 Reads of 250 bp were clipped for each consecutive three-locus position with an average quality score of 20. Paired-end reads were added to tags by the Fast Length Adjustment of Short Reads (FLASH, 1.2.11).33 Tags were classified as operational tax units (OTUs) by UPARSE 7.0.1090 with a cutoff of 97%, and UCHIME 4.2.40 was used to verify and remove chimeric sequences for further analysis. The remaining high-quality sequences were grouped into operationally amplified sequence variants (ASVs) by the DADA2 algorithm with 100% similarity.34 Using the Ribosomal Database Project Classifier (RDP 11.5), representative ASVs were annotated with taxonomic information based on the Mothur algorithm.
2.6 Metabolite extraction and data processing
After being thawed slowly at 4°C, 300 μL of precooled methanol and acetonitrile (2:1, v:v) were added for extracting 100-μL samples, and quality control was performed by Internal Standards Mix 1 (IS1) and Internal Standards Mix 2 (IS2). After a 1-min vortex and incubation at −20°C for 2 h, the samples were centrifuged at 4000 rpm for 20 min, and then the supernatant was transferred to vacuum freeze-drying. Metabolites were resuspended in 150 μL of 50% methanol, centrifuged at 4000 rpm for 30 min, and the supernatants were transferred to liquid chromatography–mass spectrometry (LC–MS) analysis.35, 36 Raw data were imported into Compound Discoverer 3.1 (Thermo Fisher Scientific, Waltham, Massachusetts) and MetaX for further processing.
2.7 Bioinformatics and statistical analysis
For microbiome analysis, Venn plots of ASVs were performed by the “Venn diagram” package in R. Nonmetric multidimensional scaling (NMDS), principal coordinate analysis (PCoA) were used to analyze the β-diversity. The Wilcoxon rank sum test was used to compare α-diversity and bacterial communities among the three groups, and α-diversity, including Shannon, Simpson, Chao1, and abundance-based coverage estimator (Ace), was estimated by Mothur 1.31.2. Furthermore, linear discriminant analysis effect size (LefSe) was used to identify altered microbiota with the linear discriminant analysis (LDA) score >2.0.37 To further determine microbial biomarkers that can differentiate between TD− and TD+, a random forest (RF) model was constructed using the area under the curve (AUC)-RF algorithm.38 The input variable for the classification model was only included if it was present in more than 20% of samples and its relative abundance was greater than 0.05%. The RF model was established by receiver operating characteristic (ROC) curve analysis.39
For metabolomics analysis, the unsupervised principal component analysis (PCA) and supervised orthogonal partial least squares discriminant analysis (OPLS-DA) were conducted to determine the distributions and identify the metabolic difference in the two groups. The screening conditions for the differential metabolites were as follows: (1) fold change (FC) ≥1.20 or ≤0.83, (2) p < 0.05, and (3) variable importance in projection (VIP) value ≥1.0. The metabolites were determined with a combination of the Kyoto Encyclopedia of Genes and Genomes (KEGG) database.40
Data were expressed as the mean ± SD for continuous variables, and frequency and percentage (%) were used for categorical variables. Comparisons between different groups were analyzed by t test or nonparametric test. To analyze the correlation network in microbiota, Spearman's correlation coefficients among genera were calculated. Correlations with an absolute coefficient value ≥0.6 and p value <0.05 were transformed into associations between two genera. Network graphs were constructed by Cytoscape 3.9.1. Spearman's rank correlation was also conducted to show the correlation among microbiota, metabolites, and clinical parameters. Pairwise comparisons of environmental factors were shown by the Mantel test, with a color gradient indicating Spearman's correlation coefficients. A p value <0.05 was considered to be statistically significant. All statistical analyses were performed using SPSS version 23.0 software (IBM Corporation, New York), GraphPad Prism 8.4.3 software (GraphPad Software Inc., San Diego, California), and the statistical program R (version 4.0.2; The R Foundation, Vienna, Austria).
3 RESULTS
3.1 Clinical characteristics of study population
The clinical characteristics of the study population are presented in Table 1. There were no significant differences in sex, age, duration, body mass index (BMI), waist-to-hip ratio (WHR), glycosylated hemoglobin (HbA1c), fasting C-peptide (FCP), total cholesterol (TC), triglyceride (TG), high-density lipoprotein cholesterol (HDL-C) and low-density lipoprotein cholesterol (LDL-C) between patients in TD− and TD+. However, patients in TD+ had a higher insulin dose (0.77 ± 0.23 u/kg vs. 0.64 ± 0.20 u/kg for TD+ and TD− group, respectively; p = 0.018) and fasting plasma glucose (FPG) (9.19 ± 3.86 mmol/L vs. 7.29 ± 2.39 mmol/L for TD+ and TD− group, respectively; p = 0.015) than those in TD−.
| T1D (n = 72) | ||||
|---|---|---|---|---|
| Variable | HC (n = 29) | TD− (n = 35) | TD+ (n = 37) | p value |
| Sex (female, %) | 19 (65.52%) | 20 (57.14%) | 23 (62.16%) | 0.664 |
| Age (years) | 31.76 ± 7.99 | 32.49 ± 8.48 | 32.65 ± 8.11 | 0.934 |
| Duration (years) | - | 12.89 ± 5.81 | 11.85 ± 6.00 | 0.458 |
| Insulin dose (u/kg) | - | 0.64 ± 0.20 | 0.77 ± 0.23 | 0.018 |
| BMI (kg/m2) | 21.98 ± 2.91 | 21.18 ± 1.81 | 21.36 ± 2.20 | 0.703 |
| WHR | 0.81 ± 0.08 | 0.80 ± 0.06 | 0.82 ± 0.06 | 0.120 |
| HbA1c (%) | 5.20 ± 0.32 | 6.94 ± 1.13 | 7.53 ± 1.60 | 0.077 |
| FPG (mmol/L) | 4.47 ± 0.44 | 7.29 ± 2.39 | 9.19 ± 3.86 | 0.015 |
| FCP (nmol/L) | 0.35 ± 0.11 | 0.04 ± 0.05 | 0.05 ± 0.06 | 0.499 |
| TC (mmol/L) | 4.74 ± 0.73 | 4.66 ± 0.71 | 4.98 ± 0.93 | 0.104 |
| TG (mmol/L) | 1.00 ± 0.56 | 0.74 ± 0.33 | 0.81 ± 0.35 | 0.343 |
| HDL-C (mmol/L) | 1.28 ± 0.24 | 1.52 ± 0.24 | 1.58 ± 0.36 | 0.461 |
| LDL-C (mmol/L) | 2.83 ± 0.67 | 2.77 ± 0.76 | 3.05 ± 0.68 | 0.102 |
| Depression scores | 38.58 ± 7.89 | 45.71 ± 4.30 | 56.35 ± 3.23 | <0.001 |
- Note: Data are mean (SD) or n (%). p values were compared by the two groups (TD−; TD+).
- Abbreviations: BMI, body mass index; FCP, fasting C-peptide; FPG, fasting plasma glucose; HC, healthy control; HbA1c, glycosylated hemoglobin; HDL-C, high-density lipoprotein cholesterol; LDL-C, low-density lipoprotein cholesterol; T1D, type 1 diabetes; TC, total cholesterol; TD−, T1D patients without depression; TD+, T1D patients with depression; TG, triglyceride; WHR, waist-to-hip ratio.
3.2 Bacterial diversity among HC, TD−, and TD+
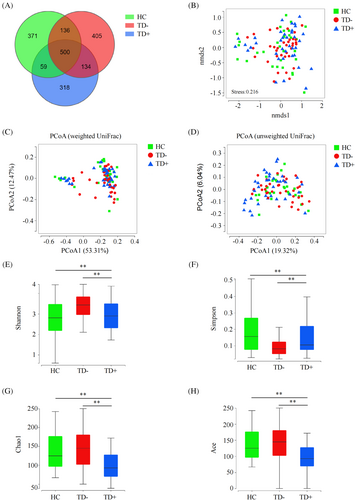
A total of 7 525 573 high-quality reads (2 151 588 reads in HC, 2611588 reads in TD−, and 2 762 397 reads in TD+) with an average of 74 511 reads per sample were obtained for microbiota analysis. Deeper sequencing identified the majority of the bacterial phylotypes (1552 ASVs) present in T1D patients. Based on the Venn diagram, we observed a slightly lower number of ASVs in TD+ (Figure 2A). In β-diversity analyses, compared to NMDS analysis and PCoA based on weighted UniFrac distances, PCoA conducted based on unweighted UniFrac distances could more effectively separate the three groups into distinct clusters (Pr [>F] < 0.001) (Figure 2B–D). Regarding bacterial α-diversity analyses, we observed significant differences in the Shannon, Simpson, Chao1, and Ace indices among the HC, TD−, and TD+ groups (p < 0.05), where TD+ exhibited decreased diversity compared to TD− and HC (p < 0.05) (Figure 2E–H).
3.3 Altered fecal microbiota composition among HC, TD−, and TD+
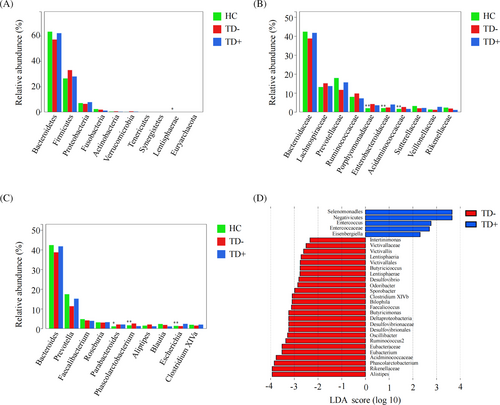
The overall microbial compositions in the HC, TD−, and TD+ groups were examined at different taxonomic levels. The top 10 most abundant microbiota at the phylum, family, and genus levels among the three groups are shown in Figure 3A–C. We revealed significant differences in the relative abundance of Lentisphaerae (phylum), Porphyromonadaceae (family), Enterobacteriaceae (family), Acidaminococcaceae (family), Parabacteroides (genus), Phascolarctobacterium (genus), and Escherichia (genus) among the HC, TD−, and TD+ groups (<p < 0.05). LEfSe identified many bacterial phylotypes that could potentially distinguish TD+ from TD− (Figure 3D). At the phylum level, Lentisphaerae was observed to differ significantly between the two groups. At the family level, we found Enterococcaceae were enriched in TD+, while Eubacteriaceae, Victivallaceae, Acidaminococcaceae, Rikenellaceae, and Desulfovibrionaceae were significantly decreased. At the genus level, Phascolarctobacterium, Ruminococcus2, Bilophila, Butyricicoccus, Clostridium XlVb, Alistipes, Intestinimonas, Oscillibacter, Odoribacter, Sporobacter, Butyricimonas, Victivallis, Desulfovibrio, Eubacterium, and Faecalicoccus were significantly enriched in TD−, while Eisenbergiella and Enterococcus were markedly reduced. Together, these results revealed differences in microbial diversity and structure between TD− and TD+.
3.4 Multivariate analyses and metabolites identification between TD− and TD+
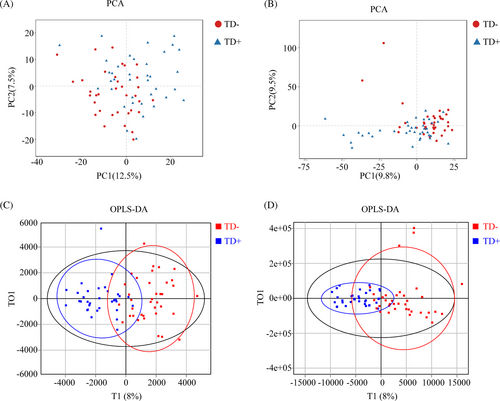
The distribution of samples was determined by PCA. As shown in the score plot in positive or negative ion modes, TD− and TD+ were not separated (Figure 4A, B). To optimize the separation of the two groups, OPLS-DA was used to visualize their metabolic differences. The score plots of OPLS-DA were shown in Figure 4C, D. Following the response test of score plots, no significant evidence of complete over-fitting was observed, indicating the construction of a good OPLS-DA model. These results showed that TD− and TD+ had different metabolic characteristics. Differential metabolites were further screened based on the VIP values obtained from the positive and negative OPLS-DA models. A total of 54 metabolites (40 upregulated and 14 downregulated metabolites) in TD+ versus TD− were identified, and 14 differential metabolites (11 upregulated in TD+ [including 4-methylene-2-oxoglutarate; 4-tert-octylphenol; di-isodecyl phthalate; 12,13-DHOME, 11-aminoundecanoic acid; glutaric acid; bis (2-ethylhexyl) phthalate; allamandin; diethyl pyrocarbonate; soyasapogenol A; and malondialdehyde] and 3 downregulated metabolites in TD+ [including polygodial, allopregnanolone, and uric acid]) were mapped to KEGG (Table 2).
| Compound name | ESI+/− | Formula | KEGG ID | FC | VIP | p value | Trend in TD+ |
|---|---|---|---|---|---|---|---|
| Polygodial | + | C15H22O2 | C09712 | 0.81 | 1.90 | 0.03 | Down |
| Allopregnanolone | + | C21H34O2 | C13712 | 0.81 | 1.55 | 0.02 | Down |
| Uric acid | + | C5H4N4O3 | C00366 | 0.83 | 4.37 | <0.01 | Down |
| 4-methylene-2-oxoglutarate | + | C6H6O5 | C06035 | 1.32 | 2.02 | 0.01 | Up |
| 4-tert-octylphenol | + | C14H22O | C14205 | 1.30 | 1.02 | 0.02 | Up |
| Di-isodecyl phthalate | + | C28H46O4 | C14578 | 1.23 | 2.05 | 0.01 | Up |
| 12,13-DHOME | + | C18H34O4 | C14829 | 1.28 | 2.03 | 0.01 | Up |
| 11-aminoundecanoic acid | + | C11H23NO2 | C19325 | 1.44 | 2.66 | <0.01 | Up |
| Glutaric acid | − | C5H8O4 | C00489 | 1.22 | 2.10 | 0.01 | Up |
| Bis (2-ethylhexyl) phthalate | − | C24H38O4 | C03690 | 1.28 | 1.12 | 0.01 | Up |
| Allamandin | − | C15H16O7 | C09766 | 1.97 | 1.67 | 0.02 | Up |
| Diethyl pyrocarbonate | − | C6H10O5 | C11592 | 1.24 | 1.95 | 0.02 | Up |
| Soyasapogenol A | − | C30H50O4 | C17419 | 1.30 | 1.08 | 0.01 | Up |
| Malondialdehyde | − | C3H4O2 | C19440 | 1.23 | 1.42 | 0.02 | Up |
- Abbreviations: ESI, electron spray ionization; FC, fold change; KEGG, Kyoto Encyclopedia of Genes and Genomes; T1D, type 1 diabetes; TD+, T1D patients with depression; VIP, variable importance in projection.
3.5 Correlation analysis of altered microbiota, metabolites, and clinical characteristics between TD− and TD+
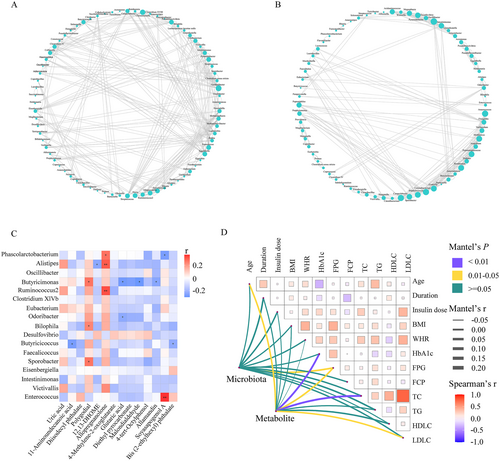
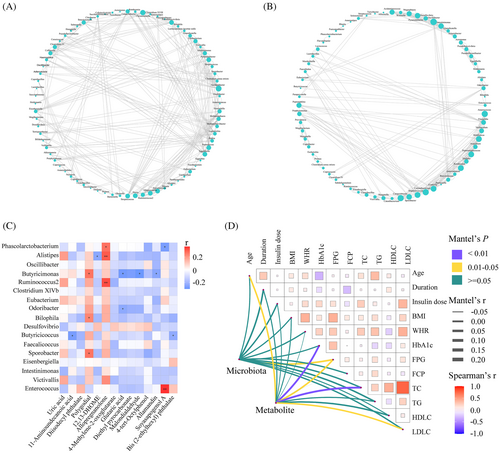
The co-occurrence network between TD− and TD+ was totally different (Figure 5A,B). The network was simplified in TD+ with a reduced number of nodes. More fragmented subnetworks appeared in TD+ due to the lower clustering coefficient of the network. Then we constructed a correlation heatmap to explore associations of altered microbiota and metabolites (Figure 5C). Butyricimonas was positively correlated with polygodial but negatively correlated with three metabolites (glutaric acid, malondialdehyde, and allamandin); Phascolarctobacterium was positively correlated with allopregnanolone but negatively correlated with soyasapogenol A; Alistipes was positively correlated with allopregnanolone but negatively correlated with 12,13-DHOME; Butyricicoccus was negatively correlated with 11-aminoundecanoic acid and bis (2-ethylhexyl) phthalate. We also found that Bilophila and Sporobacter were positively correlated with polygodial. Additionally, to identify the impact of environmental factors, we correlated altered microbiota (Phascolarctobacterium, Ruminococcus2, Bilophila, Butyricicoccus, Clostridium XlVb, Alistipes, Intestinimonas, Oscillibacter, Odoribacter, Sporobacter, Butyricimonas, Victivallis, Desulfovibrio, Eubacterium, Faecalicoccus, Eisenbergiella, and Enterococcus) and metabolites (4-methylene-2-oxoglutarate; 4-tert-octylphenol; di-isodecyl phthalate; 12,13-DHOME; 11-aminoundecanoic acid; glutaric acid; bis (2-ethylhexyl) phthalate; allamandin; diethyl pyrocarbonate; soyasapogenol A; malondialdehyde; polygodial; allopregnanolone; and uric acid) with clinical characteristics (including age, duration, insulin dose, BMI, WHR, HbA1c, FPG, FCP, TC, TG, HDL-C, and LDL-C). Based on the Mantel test, we found that FPG was the common correlate of both altered microbiota and metabolites (Figure 5D).
3.6 Microbial signature associated with TD+
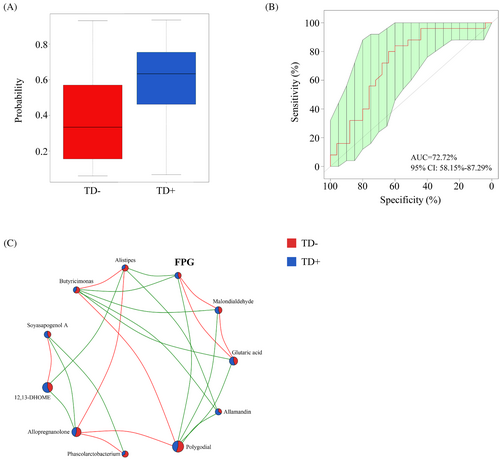
To further identify microbial signatures that can differentiate TD+ from TD−, an RF classifying model was constructed using the AUC-RF algorithm. The results demonstrated a minimal set of five genera that maximally distinguished TD− from TD+. It contained Phascolarctobacterium, Butyricimonas, Alistipes, Lachnospiracea incertae sedis, and Blautia. The probability value of this training model in TD+ increased significantly compared with that in TD− (Figure 6A), and the AUC value was 0.73 (95% CI, 0.58–0.87) (Figure 6B). Most of these (including Phascolarctobacterium, Butyricimonas, and Alistipes) had an LDA value >2.0, which significantly reduced in TD+. We also explored the relationship among these microbiota, their related metabolites, and FPG (Figure 6C). FPG was negatively correlated with Butyricimonas (r = −0.40, p < 0.01) and its related metabolites (polygodial [r = −0.25, p = 0.03], glutaric acid [r = 0.55, p < 0.01], and malondialdehyde [r = 0.56, p < 0.01]).
4 DISCUSSION
In the present study, we demonstrated the profile of the gut microbiota and serum metabolites in T1D with depression through high-throughput sequencing technology, and constructed the relationship among microbiota, metabolites, and clinical characteristics.
Compared to those without mental disorders, patients with depression and diabetes had more serious complications and higher mortality.41 Both depression and diabetes are connected with alterations in metabolic pathways and stress networks, leading to disorders of blood glucose and insulin resistance.42, 43 In this study, although the difference was not statistically significant, HbA1c was 0.59% higher in TD+ than TD−. Moreover, TD+ had higher FPG and daily insulin doses, which suggested that depression might play a significant role in adherence to diabetes care and result in poor glycemic control.
Growing evidence in recent years has established the role of gut microbiota in depression. Currently, there are few studies that identified the microbial signature in T1D with depression. Petrak et al. found that the composition of the gut microbiota was associated with the development of depression in T1D, and no difference in α-diversity was observed between T1D with depression and T1D without depression, while T1D with depression had a higher abundance of Megasphaera.25 These findings hint at a potential link between specific bacterial groups and depression in people with diabetes. In our study, the Shannon, Chao1, and Ace indices of TD− were significantly higher than those of TD+, suggesting that TD+ had a lower α-diversity of gut microbiota. Consistent with our results, previous studies have found that α-diversity is often lower in patients with depression than in controls.44, 45 Furthermore, the imbalance of microbiota was mainly reflected by changes at the genus level. We found 15 genera enriched in TD− and 2 genera enriched in TD+ by LefSe analysis, and most of them (Phascolarctobacterium,46, 48, 49, 51, 53 Bilophila,50 Butyricicoccus,47 Clostridium XlVb,46 Alistipes,46, 50, 52-54 Intestinimonas,53 Oscillibacter,46, 49, 52 Odoribacter,54 Sporobacter,51 Butyricimonas,46, 48 Desulfovibrio,48 Eubacterium,48, 49 and Enterococcus49, 52) have been reported in human studies on depression. We generated an RF model for predicting T1D with depression and showed high predictive accuracy (AUC = 0.73). And the majority (3/5, including Phascolarctobacterium, Butyricimonas, and Alistipes) of key bacteria identified by RF analyses were contained in the above 17 genera. In addition, metabolite changes between groups were distinguished based on the OPLS-DA model. In the present study, a total of 14 differential metabolites mapped to KEGG were identified. Among them, allopregnanolone,55, 56 uric acid,57, 58 glutaric acid,59, 60 bis (2-ethylhexyl) phthalate,61 and malondialdehyde62, 63 have been reported in previous studies on depression. In these studies, allopregnanolone was found to be involved in steroid hormone metabolism,55 uric acid in purine metabolism,58 glutaric acid in lysine and fatty acid metabolism,59, 60 bis (2-ethylhexyl) phthalate in glutamate metabolism,61 and malondialdehyde in lipoprotein metabolism.62
As stated above, we discovered a simplified network in TD+ in comparison with TD−. Bacteria coexist in complex interaction webs, and perturbations within these webs may contribute to disease.64 Our finding suggested the loss of certain microbial interactions in TD+, leading to destruction of the homeostasis of the microbiota. Furthermore, the production of metabolites by microbes contributes to the host metabolic phenotype and influences the disease risk. Here, we explored the relationship between key bacteria and differential metabolites. Butyricimonas was negatively correlated with glutaric acid and malondialdehyde. Butyricimonas is a butyrate producer, which contributes to intestine epithelial integrity.65 Decreased levels of Butyricimonas were found in T1D and depression.11, 46 Glutaric acid is produced during the metabolism of lysine. Fluctuations in blood glucose levels could affect this metabolic pathway.66 Lu et al. found that the level of glutaric acid was higher in patients with fulminant T1D than in HCs.67 Glutaric acid was also identified as a potential biomarker of chronic unpredictable mild stress (CUMS)-induced depression.59 Patients with postpartum depression had higher levels of glutaric acid than those without.60 Malondialdehyde, the final product of polyunsaturated fatty acid peroxidation in the cells, is commonly known as a marker of oxidative stress. Elevated malondialdehyde levels have been observed in individuals with T1D, and malondialdehyde can further contribute to cellular damage and impair insulin sensitivity, exacerbating the progression of the disease.68, 69 In recent years, oxidative stress has received much attention with regard to psychiatric illnesses. Malondialdehyde was found to be elevated in patients with major depression and depressed patients with physical ailments, such as gastric adenocarcinoma, chronic heart failure, and stroke.62, 70, 71
Furthermore, our results suggested that both Phascolarctobacterium and Alistipes were positively correlated with allopregnanolone. Phascolarctobacterium produces short-chain fatty acids (including acetate and propionate) and is involved in energy metabolism and immune inflammation.72 The levels of Phascolarctobacterium were higher in healthy subjects than T1D patients.73 On the other hand, Humbel et al. found that Phascolarctobacterium was negatively correlated with depressive symptoms in major depression.48 Alistipes, a relatively new genus of bacteria isolated from clinical samples, may promote mucous production and a healthy intestinal epithelial barrier in T1D.74 However, Ma et al. found that Alistipes was upregulated in T1D rats injected with streptozotocin.75 Evidence for the involvement of Alistipes in depression is also controversial. Caso et al. reported enrichment of the Alistipes in the depressed patients, but Zhang et al. found that Alistipes was relatively more abundant in the HCs compared to patients with major depressive disorder.50, 52 Allopregnanolone is a naturally occurring neurosteroid from the hormone progesterone and a positive allosteric modulator of γ-aminobutyric acid (GABA).76 It has been shown to have anti-inflammatory and immunomodulatory effects, which could potentially help protect against cognitive deficit and dysbiosis in T1D.77 And reduced levels of allopregnanolone in the peripheral blood or cerebrospinal fluid were found to be associated with depression.78
In addition, our study discovered the relationship among key microbiota, their related metabolites, and FPG. These results suggested that Butyricimonas might affect FPG in T1D patients with depression through the glutaric acid and malondialdehyde metabolic pathways. In the future, we will explore their causal relationship in T1D with depression and investigate the biological mechanism through further study.
There are some limitations to our study. Firstly, this study included a relatively small sample size which was insufficient to completely reflect microbial and metabolic changes in T1D with depression. Secondly, all participants were recruited from the same site and were of Han ethnicity. Thus, site-specific and ethnic biases in microbial phenotypes could not be ruled out. Thirdly, we used the 16S RNA sequencing method to assess the gut microbiota, which might not be as accurate for those species. Fourthly, it would be more scientifically rigorous to set up a separate control group for patients with depression but without T1D. The interdisciplinary collaboration between endocrinology and psychiatry is expected in the future.
In conclusion, our study indicated significant alterations in gut microbiota and serum metabolites in T1D with depression. T1D patients with depression were characterized by unique profiles of gut microbiota and serum metabolites. Phascolarctobacterium, Butyricimonas, and Alistipes could predict the risk of T1D with depression. These findings provide further evidence that the microbiota–gut–brain axis is involved in T1D with depression.
AUTHOR CONTRIBUTIONS
Conception and design of the study: X.Z., S.L., W.X., J.Y., J.W., D.Y., and C.W. Acquisition of data was performed by Z.L., X.Z., and S.L. Collection, analysis, and interpretation of data: Z.L., T.Y., S.L., and C.W. Preparation of figures and tables and writing of original draft: Z.L., D.Y., and C.W. All authors contributed to the article and approved the submitted version.
ACKNOWLEDGEMENTS
We appreciate all participants from the T1D China Registry Study for their contribution in this study.
FUNDING INFORMATION
This study was supported by the National Key R&D Program of China (grant no. 2017YFC1309600), the Guangdong Basic and Applied Basic Research Foundation (grant no. 2019A1515010979), the National Natural Science Foundation of China (grant no. 82100822), the Anhui Provincial Natural Science Foundation (grant no. 2008085MH248 & 2008085MH278), and the Science and Technology Projects in Guangzhou (grant no. 2023A04J1087).
DISCLOSURE
The authors declare that they have no conflict of interest.


