SLAMF8 as a potential biomarker for rheumatoid arthritis identified by comparing peripheral blood mononuclear cells, fibroblast-like synoviocytes, and synovial tissue using bioinformatics analysis
Cheng Zhang and Huina Huang contributed equally to this study.
Edited by Zhiyu Wang and Lishao Guo.
Abstract
Background
Rheumatoid arthritis (RA) is a chronic autoimmune inflammatory disease. Its pathogenesis is not fully understood, and early diagnosis is challenging owing to the lack of effective biomarkers. This study aimed to analyze different samples to identify potential biomarkers and therapeutic targets.
Methods
Microarray datasets of RA, osteoarthritis (OA), and healthy control (HC) were downloaded from the Gene Expression Omnibus database. R software was used to identify differentially expressed genes (DEGs), which were visualized using volcano and heat maps. Venn diagrams, principal component analysis, gene set enrichment analysis, gene ontology, and Kyoto Encyclopedia of genes and genomes were used to analyze the data. A protein–protein interaction network was constructed, and synovial tissues from patients with RA and OA were collected for verification using the collagen-induced arthritis mouse model.
Results
More DEGs were found in synovial tissues than in peripheral blood mononuclear cells or fibroblast-like synoviocytes. Principal component analysis revealed significant differences between the RA and OA samples, highlighting the unique advantages of synovial tissue. Enrichment analysis revealed that metabolic and cytokine signaling pathways play crucial roles in the development of RA. Further analysis of the four synovial datasets identified 54 DEGs, of which signaling lymphocytic activation molecule family (SLAMF) 8 was identified as the key molecule. SLAMF8 levels were increased in the synovial tissue of patients with RA compared to those of patients with OA (0.38 ± 0.19 vs. 12.40 ± 1.66), and SLAMF8 levels were similarly elevated in collagen-induced arthritis model mice compared with those in the healthy mice (1.13 ± 0.47 vs. 9.05 ± 2.52).
Conclusions
This study established the unique advantages of synovial tissue for RA research and identified metabolic and cytokine signaling pathways as important for RA development. Thus, SLAMF8 may be a potential therapeutic target for RA.
Key points
-
Synovial tissue was found to have more differentially expressed genes compared to peripheral blood mononuclear cell and fibroblast-like synoviocytes, highlighting its unique advantages as a research object.
-
Metabolic and cytokine signaling pathways play crucial roles in the occurrence and development of rheumatoid arthritis.
-
Signaling lymphocytic activation molecule family 8 has been identified as a key molecule in the disease process, and it may be a potential target for the treatment of rheumatoid arthritis.
1 INTRODUCTION
Rheumatoid arthritis (RA) is an autoimmune disease in which the immune system of patients attacks joints throughout the body.1 The pathogenesis of RA is not completely clear, and the different functions of different tissues and cells and the heterogeneity among patients cause many difficulties in research. RA usually damages the joints and other tissues and organs, including the heart, kidneys, lungs, digestive system, eyes, skin, and nervous system.2 Peripheral blood, fibroblast-like synoviocytes (FLSs), and synovial tissue are commonly used as research samples. Various T-cell subsets play an important role in the peripheral blood, and the pathological expansion of peripheral T helper cell subsets drives B cells to perform their functions, thus affecting the process of RA.3 The abnormal proliferation and function of T follicular helper cells leads to the production of autoantibodies, tissue damage, and other pathological processes.4 In addition, the infiltration of other immune cells in the peripheral blood also affects the disease severity of RA.5-7 FLSs have a unique invasive phenotype that can increase the invasiveness of the extracellular matrix, further aggravate joint damage, and participate in RA.8 FLSs in RA are also capable of producing pathogenic mediators, such as cytokines and proteases, which contribute to disease onset and persistence.9 Moreover, the interaction between RA FLSs and immune and nonimmune cells is also one of the important reasons for the occurrence and development of RA.10 Synovial tissue is the main target tissue of RA, and it is important for studying its pathogenesis, patient stratification, discovery of biomarkers and new targets, and treatment.11 There is a large infiltration of immune cells into the synovium of the joints in patients with RA.12 In recent years, there have been targeted therapies for synovial tissue vessels,13 and the synovium has been explored as an indicator of prognosis.14
With the continuous development of microarray and high-throughput sequencing technologies, there has been a deeper understanding of gene expression in diseases,15 and advances in bioinformatics have provided powerful research methods for disease prediction. In RA, several transcriptome analyses have revealed the likely causative genes,16-18 and single-cell sequencing analysis better defines cell subsets in disease activity.19 Therefore, a combination of microarray and bioinformatics analyses can be used to explore potential biomarkers and therapeutic targets.
In this study, to analyze the pathogenic genes and potential targets more precisely in RA, we selected three samples: peripheral blood mononuclear cell (PBMC), FLSs, and synovial tissue. Differential genes, functional enrichment, and key pathways were analyzed using bioinformatics, and the differences between different samples were compared to select better samples and key genes for RA research. Importantly, we found that synovial tissue has unique advantages over peripheral blood and FLS and screened potential biological targets in synovial tissue, which will play an important role in our understanding of the pathogenesis of RA.
2 METHODS
2.1 Gene Expression Omnibus (GEO) dataset collection and processing
All microarray data were downloaded from the GEO database (http://www.ncbi.nih.gov/geo). Raw data were downloaded as MINiML files, which contained data for all platforms, samples, and GSE records. The extracted data were normalized using log2 transformation. Microarray data were normalized using the “normalizequantile” function of the “preprocessCore” package in R software (version 3.4.1). The probes were converted to gene symbols according to the annotation information of the normalized data on the platform. Probes matching multiple genes were removed from the dataset. The average gene expression value measured using multiple probes was calculated as the final expression value. For cases where the same dataset and platform were used in different batches, the “removeBatchEffect” function of the limma package in the R software was used to remove batch effects. For different datasets or the same dataset but on different platforms, we extracted multiple datasets with common gene symbols, marked different datasets or platforms as different batches, and used the “removeBatchEffect” function of the limma package in the R software to remove batch effects. Seven eligible datasets were selected: GSE1919, GSE15573, GSE49604, GSE77298, GSE55584, GSE55235, and GSE55457. The details of all the datasets are shown in Supporting information: Table S1.
2.2 Identification of differentially expressed genes (DEGs)
Difference analysis was performed using the Microarray Data Linear Model (Limma) software package. Limma is a differential expression screening method based on a generalized linear model. Specifically, after acquiring the expression profile dataset, we first log2 transformed the data and then performed multiple linear regressions using the “lmFit” function. The eBays function was further used to compute the moderated t-statistics, moderated F-statistics, and log-odds of differential expression by empirical Bayes moderation of standard errors toward a common value. Finally, the differences in the significance of each gene were obtained. Genes with a p-value less than 0.05 and |log2-fold change | > 1.5 were considered to be statistically significant. The results of the DEGs were presented as volcano and heat maps.
2.3 Enrichment analysis
For gene set enrichment analysis (GSEA), we downloaded the GSEA software (version 3.0) from the GSEA website (http://software.broadinstitute.org/gsea/index.jsp) and c2. cp. kegg.v7.4. symbols. gmt file from the Molecular Signatures Database (http://www.gsea-msigdb.org/gsea/downloads.jsp) to evaluate the relevant pathways and molecular mechanisms. Based on gene expression profiling and phenotype grouping, we set the minimum gene set to 5 and the maximum gene set to 5000 with 1000 re-samplings. Statistical significance was set at p-values of less than 0.05.
Gene ontology (GO) and Kyoto Encyclopedia of genes and genomes (KEGG) pathway enrichment was performed only on the DEGs. The GO analysis was divided into three parts: molecular function (MF), biological process (BP), and cellular component (CC). Gene annotations for the KEGG pathway were obtained from KEGG rest. The R package clusterProfiler was used for visual analysis to obtain the results of the gene set enrichment. p < 0.05 was considered statistically significant.
2.4 Principal component analysis (PCA)
Intragroup data repeatability in each group was verified using the Pearson's correlation test. The intragroup repeatability of the dataset was tested using sample clustering analysis. Statistical analysis was performed by the R programming language, and the results were presented by the R package “ggplot2.”18
2.5 Construction of the protein–protein interaction (PPI) network
The PPI network was constructed based on all DEGs using STRING (https://string-db.org/). Subsequently, we downloaded the interaction information and optimized the PPI network using the Cytoscape software for better visualization. Minimal Common Oncology Data Elements was used to identify significant gene clusters and obtain cluster scores (filter criteria: degree cut-off = 2, node score cut-off = 0.2, k-core = 2, and maximum depth = 100). CytoHubba was used to identify significant hub genes in the network as hub genes.17, 20 Finally, all results were intersected to obtain the final hub genes, and the top 10 hub genes of the density of maximum neighborhood component are listed.
2.6 Synovium of patients with osteoarthritis and RA
Synovium was collected from patients with RA and osteoarthritis (OA) who met the American College of Rheumatology criteria for RA21 at the Department of Rheumatology and Immunology of the Second Affiliated Hospital of Dalian Medical University in China. None of the patients had autoimmune or systemic diseases. All the participants signed informed consent statements to approve the use of their synovium. The study has been approved by the Ethics Committee of the Dalian Medical University (2018–061). Details of the patients with RA and OA are shown in Supporting information: Table S2.
2.7 Collagen-induced arthritis
Six-week-old female and male DBA1J mice were maintained in accordance with the guidelines of the Institutional Animal Care and Use Committee of the Dalian Medical University. This study was approved by the Laboratory Animal Ethics Committee of Dalian Medical University (AEE19092). The mice were immunized at the tail base with 100 µL of Bovine type II collagen (CII, Chondrex) emulsified 1:1 in Freund's complete adjuvant (CFA, Chondrex). A booster injection of 100 μL CII/incomplete Freund's adjuvant (IFA, Chondrex) was administered on Day 21.
2.8 Immunohistochemical staining
Arthroscopic surgery was performed in three patients with RA and three patients with OA for therapeutic purposes. Synovial sections were obtained from three collagen-induced arthritis (CIA) and three healthy control mice. Regular streptavidin-biotin-based immunoperoxidase staining with an anti-signaling lymphocytic activation molecule family (SLAMF) 8 antibody (bs-2473R; Bioss) was performed on formalin-fixed, paraffin-embedded synovial pathology specimens. Images were captured using a microscope (BX53, Olympus). The level of SLAMF8 staining was analyzed by integrating the optical density using the ImageJ software (National Institutes of Health).
2.9 Statistical analysis
Statistical analyses and graphical representations were performed using GraphPad Prism 6 (GraphPad Software). Unpaired Student's t-test was used for statistical analysis. Data are presented as mean ± standard error of the mean. A significance level of p < 0.05 was considered statistically significant.
3 RESULTS
3.1 Synovial tissue may act as a mediator connecting PBMCs and FLS
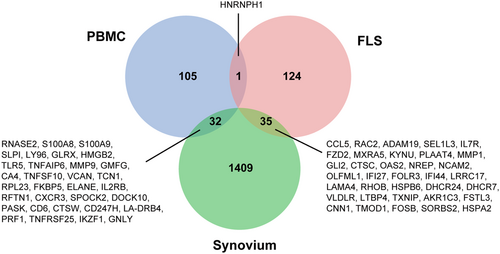
To determine the genes that play a role in RA, we analyzed PBMCs, synovial tissue, and FLSs using three datasets (GSE15573, GSE1919, and GSE49604) from the GEO database. We conducted a Venn diagram analysis of these datasets, and the results are presented in Figure 1. We found 32 common DEGs between PBMCs and synovial tissue and only one between PBMCs and FLS. There were 35 DEGs in the synovial tissue and FLSs. Therefore, the synovial tissue may act as a mediator connecting PBMCs and FLS, which could be the focus of future research on RA.
3.2 PCA
To examine the consistency of the differences and biological reproducibility between different groups, PCA was performed on the dataset. The results of PCA cluster analysis showed that the RA group had significant differences compared with the normal group or the OA group, and the relevant results are shown in Figure 2. Through the PCA results, we found that there was a certain overlap among different groups of PBMCs, suggesting that although PBMC samples were easy to obtain, data analysis might not be completely accurate because of repeatability. However, the synovial tissue and FLS showed differences between the different groups.

3.3 Identification of DEGs
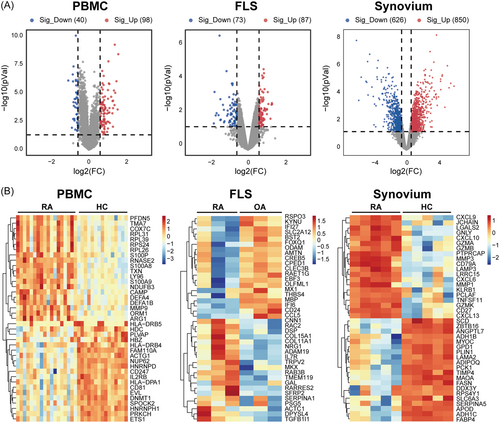
Volcano plots and heatmap analyses were used to visualize the DEGs, as shown in Figure 3A,B. By comparing patients with RA with normal donors or patients with OA, we identified 138 DEGs in PBMCs, including 98 upregulated and 40 downregulated genes. In FLSs, 160 DEGs were identified, including 87 upregulated and 73 downregulated genes. Additionally, 1476 DEGs were identified in the synovial tissues, with 850 upregulated genes and 626 downregulated genes. Through these differential genes, we found that synovial tissue had the most differential genes, which may be due to the infiltration of most immune cells in the synovial tissue, suggesting that synovial tissue has greater research value.
3.4 Enrichment analysis
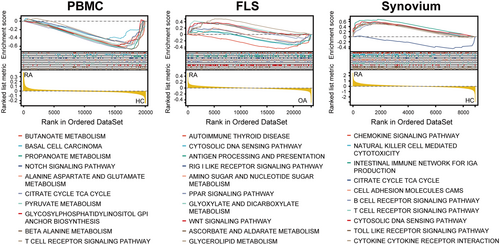
To analyze the changes in the pathway, the expression profiles of all genes were subjected to GSEA. Concerning enriched pathways, we found that in PBMCs, the pathways were mainly enriched in metabolic pathway changes, TCA cycle, Notch signaling, and T-cell receptor signaling. In FLSs, the enriched pathways were mainly autoimmune diseases, cytoplasmic DNA sensing pathways, and metabolism. In synovial tissue, the enriched pathways were mainly the chemokine signaling pathway, natural killer cell-mediated cytotoxicity, metabolic pathway, tricarboxylic acid cycle, B-cell receptor pathway, and T-cell receptor pathway. Overall, we found that metabolic pathways were altered in PBMCs, FLSs, and synovial tissues (Figure 4). These common changes suggest that metabolism plays an important role in RA, whereas heterogeneous pathway changes suggest that their roles are not the same in different tissues or cells.
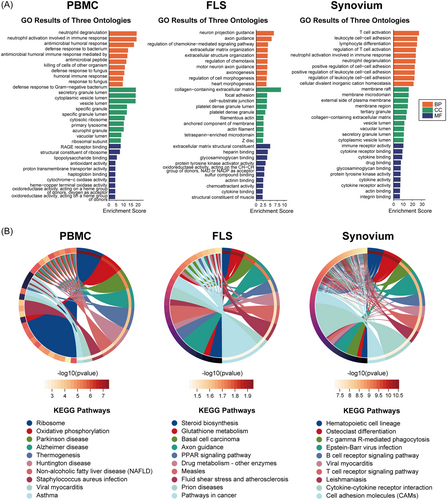
To be more specific regarding the changes in the pathways, the clusterProfiler tool was used to perform GO and KEGG enrichment analyses of the DEGs. GO analysis was divided into three sections: MF, CC, and BP. KEGG pathway analysis was more comprehensive and encompassed more genes (Figure 5). GO and KEGG analyses revealed that the enrichment results of all genes (GSEA) and differential genes (GO and KEGG) were not identical, indicating that attention should be paid not only to the whole dataset but also to genes with highly synergistic changes during the analysis process.
3.5 PPI network analysis, minimal common oncology data elements cluster modules, and hub gene identification
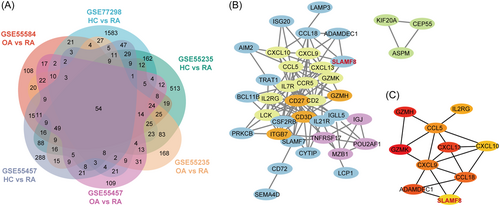
Based on the results of the above analysis, we focused on the synovial tissue, which is more widely represented than PBMCs or FLS. By analyzing four synovial datasets (GSE77298, GSE55584, GSE55235, and GSE55457), we identified 54 genes with consistent changes. PPI analysis of these 54 genes revealed that SLAMF8 was correlated with chemokines and was also involved in changes in the FLS phenotype (Figure 6).
3.6 SLAMF8 levels are elevated in the synovium of patients with RA and CIA mouse models
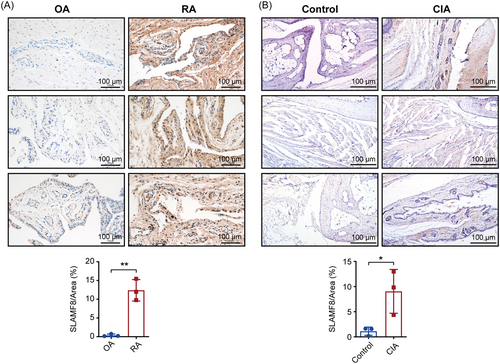
To verify the results of our bioinformatics analysis, we collected synovial tissues from patients with RA and OA and stained them for SLAMF8 using histochemistry. The results showed that SLAMF8 levels were statistically significantly higher (0.38 ± 0.19 vs. 12.40 ± 1.66) in patients with RA than in those with OA (Figure 7A). We obtained the same results in the synovium of normal and CIA mice, suggesting that SLAMF8 may play an important role in the RA synovium (1.13 ± 0.47 vs. 9.05 ± 2.52) (Figure 7B).
4 DISCUSSION
As RA is a chronic, inflammatory, autoimmune disease that mainly affects the joints, achieving remission is an achievable goal in most patients.22 In recent years, the discovery of biomarkers, such as rheumatoid factor and anticitrullinated protein antibodies, has allowed for better patient management. However, some patients with early RA do not meet these criteria, resulting in the neglect of RA.23 In addition to biomarkers used for diagnosis, there is an urgent need to establish biomarkers for treatment to stratify patients.24 Therefore, identifying novel biomarkers for the diagnosis and treatment of RA is important.
RA has significant clinical heterogeneity, resulting in an overall poor prognosis owing to individualized responses to standard treatments. Individual variations in cellular and molecular mechanisms can greatly improve clinical care and patient outcomes.25 In the development of RA, a variety of immune cells and molecules are involved, such as B cells, T cells, inflammatory macrophages, neutrophils, mast cells, and stromal cells, including FLS cells.26 This complexity makes the study of RA challenging. Considering the variety of tissues and cells involved in RA, we compared and analyzed three types of samples: PBMCs, synovial tissue, and FLSs. By comparing different tissues and cells, common changes in genes suggested key indicators of RA, whereas individual changes in genes suggested tissue-specific characteristics of RA. We found that the synovial tissue has a unique advantage, with more DEGs and cell infiltration, which provides new opportunities for the study of RA.
In our study, we found that synovial tissue may serve as a medium for exchange between PBMCs and FLS. There were more DEGs in the synovial tissue than in the PBMCs and FLSs, and the differences and repeatability between the different groups were better than those in the PBMCs and FLSs. In the GSEA pathway analysis, we found that metabolism was a common changing pathway, suggesting an important role of metabolism in RA, which is consistent with our previous studies.27, 28 Enrichment analysis revealed that cytokines play important roles in RA and may act as mediators of the disease process. Synovial tissue was found to have unique advantages over these three tissues or cells; therefore, we studied a dataset of synovial tissues.
In our previous study, we performed a protein microarray analysis of RA patients.29 In this study, we analyzed four synovitis datasets and identified 54 commonly altered genes. Further PPI analysis of these 54 genes showed that SLAMF8 was upregulated and was involved in changes in cytokine and FLS phenotypes. These results suggest that SLAMF8 may act as an adhesion molecule that recruits chemokines in the synovial tissue, promoting changes in the FLS phenotype and leading to the development of RA. This will be the focus of our future research.
SLAMF8 belongs to the SLAMF family, which consists of nine transmembrane proteins, SLAMF1-9, expressed on most hematopoietic cells.30 We found that SLAMF8 was widely expressed in T cells, dendritic cells, B cells, natural killer cells, macrophages, neutrophils, and FLSs in the synovial tissue of patients with RA (data not shown). In FLSs from patients with RA, knockdown of SLAMF8 significantly attenuated TNF-α-induced pro-inflammatory responses.31 Most SLAMF members function as homophilic receptors, and their cytoplasmic tails contain one or more unique tyrosine motifs called immunoreceptor tyrosine motif switch motifs. The engagement of SLAMF triggers the phosphorylation of immunoreceptor tyrosine motif switch motifs which are docking sites that link these receptors to intracellular adaptor molecules such as SLAM-associated protein and Ewing's Sarcoma transcript-2 or Src homology 2-carrying enzymes.32 As a member of the SLAMF family, studies have shown that SLAMF8 participates in acute kidney transplant rejection, liver inflammation, tumors, and other diseases.33-36 In RA, SLAMF8 participates in the progression of RA through the Toll-like receptor 4/nuclear factor kappa B signaling pathway,37 and moreover, it can promote the proliferation and migration of FLSs by regulating the extracellular regulated protein kinases (ERK)/matrix metalloproteinases (MMPs) signaling pathway, thereby aggravating RA.31
Our study has many limitations. In future studies, we will collect more clinical samples to verify the expression of SLAMF8, investigate the cells and pathways that exert biological functions, explore the possibility of using SLAMF8 as a biomarker, and provide new perspectives for the treatment of RA.
In this study, we compared PBMCs, FLSs, and synovial tissue and found that synovial tissue has unique advantages in RA research. Further analysis of the synovial tissue dataset identified SLAMF8 as the key molecule. SLAMF8 expression was elevated in RA, suggesting the possibility of using SLAMF8 as a biomarker for RA.
AUTHOR CONTRIBUTIONS
All authors contributed to the study conception and design. Cheng Zhang, Huina Huang, Jie Zhang, and Guan Wang conducted experiments. Yifan Huang, Yuanhua Qin, Xia Li, and Guan Wang contributed reagents or analytic tools. Cheng Zhang, Huina Huang, and Guan Wang performed data analysis and figure generation. Cheng Zhang, Huina Huang, Xia Li, and Guan Wang were the primary writers of the paper, with contributions from all authors. All authors read and approved the final manuscript.
ACKNOWLEDGMENTS
Thanks to the above research website http://www.sangerbox.com/tool, https://www.bioinformatics.com.cn, https://www.omicstudio.cn/tool, and https://www.aclbi.com for making data analysis easier in the course of our analysis. This work was supported by grants from the National Natural Science Foundation of China, Grant/Award Number: 82101896, 82071834, 82271839, and Dalian Medical University Interdisciplinary Research Cooperation Project Team Funding, Grant/Award Number: JCHZ2023010.
CONFLICT OF INTEREST STATEMENT
Xia Li is a member of the Rheumatology & Autoimmunity editorial board and is not involved in the peer-review process of this article. The remaining authors declare no conflict of interest.
ETHICS STATEMENT
The study was approved by the Ethics Committee of the Dalian Medical University (No. 2018–061) and the Laboratory Animal Ethics Committee of Dalian Medical University (No. AEE19092).
Open Research
DATA AVAILABILITY STATEMENT
Datasets generated during and/or analyzed during the current study are available from the corresponding author upon reasonable request.


