Development and validation of a prognostic model incorporating tumor thrombus grading for nonmetastatic clear cell renal cell carcinoma with tumor thrombus: A multicohort study
Abstract
There is significant variability with respect to the prognosis of nonmetastatic clear cell renal cell carcinoma (ccRCC) patients with venous tumor thrombus (VTT). By applying multiregion whole-exome sequencing on normal-tumor-thrombus-metastasis quadruples from 33 ccRCC patients, we showed that metastases were mainly seeded by VTT (81.8%) rather than primary tumors (PTs). A total of 706 nonmetastatic ccRCC patients with VTT from three independent cohorts were included in this study. C-index analysis revealed that pathological grading of VTT outperformed other indicators in risk assessment (OS: 0.663 versus 0.501–0.610, 0.667 versus 0.544–0.651, and 0.719 versus 0.511–0.700 for Training, China-Validation, and Poland-Validation cohorts, respectively). We constructed a risk predicting model, TT-GPS score, based on four independent variables: VTT height, VTT grading, perinephric fat invasion, and sarcomatoid differentiation in PT. The TT-GPS score displayed better discriminatory ability (OS, c-index: 0.706–0.840, AUC: 0.788–0.874; DFS, c-index: 0.691–0.717, AUC: 0.771–0.789) than previously reported models in risk assessment. In conclusion, we identified for the first-time pathological grading of VTT as an unheeded prognostic factor. By incorporating VTT grading, the TT-GPS score is a promising prognostic tool in predicting the survival of nonmetastatic ccRCC patients with VTT.
1 INTRODUCTION
One biological characteristic of renal cell carcinoma (RCC) is its propensity to extend into the venous system. Venous tumor thrombus (VTT) is observed in 4−10% of newly diagnosed RCC patients,1 and surgery remains the mainstay of treatment for these patients.2 A successful radical nephrectomy and thrombectomy provides considerable palliation to a proportion of nonmetastatic RCC patients with VTT, sometimes leading to a higher long-term survival rate.3 However, the reported postsurgical survival varies significantly with the 5-year overall survival (OS) rate ranging from 37.0 to 71.0%.1 Hence, accurate risk positioning models are critically needed for these patients.
Thrombus has long been considered as a simple extension of the primary tumor (PT) to the vessel and assumed to have almost the same molecular profiling and histological characteristics as the PT.4, 5 The TRACERx Renal project gained an insight into the ability of VTT to act as a source of metastatic dissemination with a limited sample size of clear cell renal cell carcinoma (ccRCC) patients.6, 7 In this study, we tested the evolutionary hypothesis with expanded sample size, which is the largest matched sample size to date.
At present, most prognostic models were developed from a general population of RCC patients, not specific for nonmetastatic RCC patients with VTT.3, 8-11 Recently, Abel et al.12, 13 developed two models with higher predictive accuracy than UISS model and SSIGN score for these patients. However, the reported models only analyzed one feature specific for VTT, the thrombus height. In addition, almost all pathologists and doctors only paid attention to whether there are tumor cells within VTT in common practice, and ignored the possibility that the characteristics of VTT might provide extra information on oncologic outcomes.
Here, we explored whether the multiple characteristics of VTT might hold untapped potential for ccRCC risk assessment. To the best of our knowledge, this is the first study to report the role of VTT grading as a prognostic biomarker in a large multi-institutional cohort of nonmetastatic ccRCC patients with VTT. This study also highlights the possibility of introducing VTT grading and TT-GPS score into routine pathologic reports for ccRCC patients to provide further information about risk stratification.
2 RESULTS
2.1 Evolutionary features during ccRCC progression
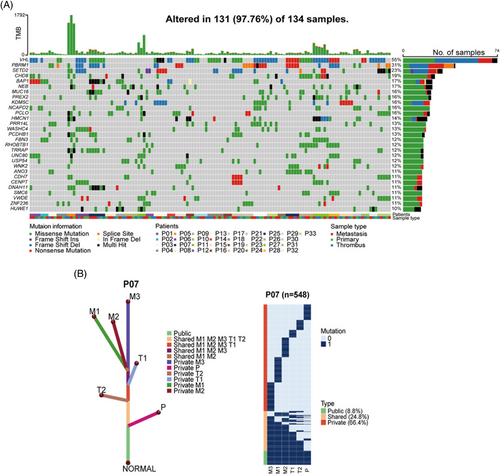
We applied multiregion whole-exome sequencing (WES) on normal-tumor-thrombus-metastasis quadruples obtained from 33 ccRCC patients (Table S1). A total of 21,645 somatic nonsilent mutations (median 102) were identified in 134 samples (Figure S1), among which VHL (55%), PBRM1 (31%), and SETD2 (23%) were most frequently mutated, consistent with TCGA cohort,14 Ma cohort,5 and Ding cohort.15 Several novel highly mutated genes were identified in our cohort, including CHD8 (19%) and NCAPD2 (16%) (Figure 1A). Intriguingly, phylogenic tree analysis revealed that most metastases (27 out of 33, 81.8%) were seeded from VTT rather than from PTs (representative patient 07; Figures 1B and S2). This result suggested that VTT acted as a reservoir of metastases in the majority of ccRCC patients, inspiring us to explore the role of VTT in the risk assessment of nonmetastatic ccRCC patients.
2.2 Patient characteristics
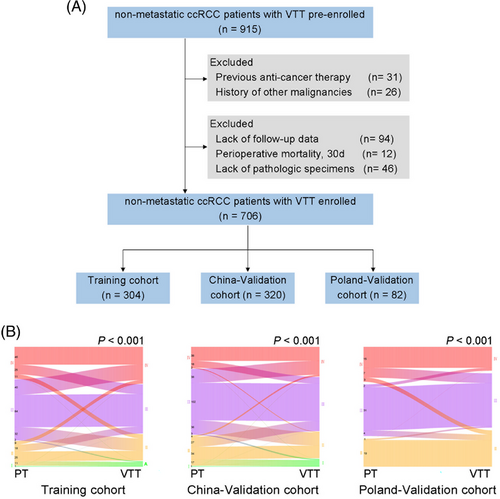
A total of 915 nonmetastatic ccRCC patients with VTT were pre-enrolled. Based on the predefined exclusion criteria, the final dataset included 706 patients (Figure 2A). Overall, 446 (63.2%) patients were men, and the median age was 61.5 years (interquartile ranges [IQR], 53−68). The median follow-up time was 52, 54, and 43 months for Training, China-Validation, and Poland-Validation cohorts, respectively. During the follow-up period, the median OS time was 60, 68, and 68 months for Training, China-Validation, and Poland-Validation cohorts, respectively; the median disease-free survival (DFS) time was 47 and 60 months for Training and China-Validation cohorts. The clinicopathologic characteristics of the patients were largely balanced among three cohorts (Table S2), except for the major proportion of patients with Mayo 0 in Poland-Validation cohort.
2.3 Pathological grading of VTT signifies distinct prognosis
To comprehensively evaluate the potential of VTT in risk assessment, multiple characteristics of VTT were incorporated, including VTT height, consistency and the pathological nuclear grading of VTT (VTT grading), which has not been studied yet. Comparative analysis revealed discrepancies between PT grading and VTT grading in all three cohorts (Figure 2B). Although higher pathological grading of PT and VTT were both significantly correlated with dismal prognosis (Figures 3A–C and Figure S3), only VTT grading remained as an independent predictive factor for OS (Table S3) and DFS (Table S4) after multivariable Cox regression.
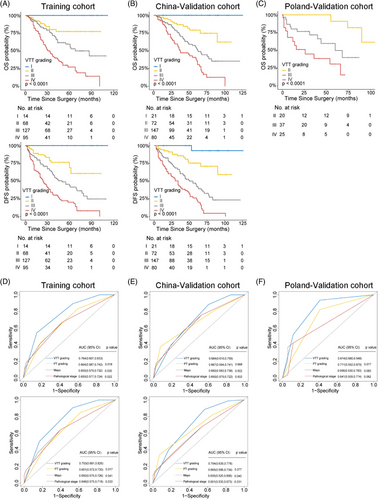
Furthermore, VTT grading showed superiority in risk assessment compared with PT grading and other variables by c-index analysis (OS: 0.663 versus 0.501–0.610, 0.667 versus 0.544–0.651, and 0.719 versus 0.511–0.700 for Training, China-Validation, and Poland-Validation cohorts, respectively; DFS: 0.664 versus 0.501–0.606, and 0.672 versus 0.530–0.640 for Training, and China-Validation cohorts, respectively; Table 1), which was confirmed by the receiver operating characteristic (ROC) analysis (Figures 3D–F; OS: area under the curve [AUC] 0.764 versus 0.650–0.664, 0.684 versus 0.650–0.667, and 0.814 versus 0.641–0.711 for Training, China-Validation, and Poland-Validation cohorts, respectively; DFS: AUC 0.753 versus 0.648–0.651, and 0.704 versus 0.601–0.665 for Training, and China-Validation cohorts, respectively).
| Variables | OS | DFS | ||||||||
|---|---|---|---|---|---|---|---|---|---|---|
| Training cohort (n = 304) | China-Validation cohort (n = 320) | Poland-Validation cohort (n = 82) | Training cohort (n = 304) | China-Validation cohort (n = 320) | ||||||
| c-Index (95% CI) | p | c-Index (95% CI) | p | c-Index (95% CI) | p | c-Index (95% CI) | p | c-Index (95% CI) | p | |
| VTT grading | 0.663 (0.614–0.713) | 0.667 (0.619–0.715) | 0.719 (0.638–0.799) | 0.664 (0.621–0.707) | 0.672 (0.630–0.714) | |||||
| PT grading | 0.580 (0.531–0.628) | 0.002 | 0.651 (0.606–0.697) | 0.518 | 0.694 (0.618–0.769) | 0.474 | 0.576 (0.532–0.620) | <0.001 | 0.640 (0.598–0.682) | 0.140 |
| Sarcomatoid features in PT | 0.593 (0.554–0.632) | 0.007 | 0.624 (0.580–0.667) | 0.097 | 0.617 (0.534–0.700) | 0.020 | 0.563 (0.530–0.595) | <0.001 | 0.615 (0.579–0.651) | 0.012 |
| Sarcomatoid features in VTT | 0.547 (0.514–0.580) | <0.001 | 0.577 (0.539–0.615) | <0.001 | 0.511 (0.462–0.561) | <0.001 | 0.543 (0.516–0.571) | <0.001 | 0.580 (0.547–0.613) | <0.001 |
| Vascular wall invasion | 0.548 (0.500–0.597) | 0.002 | 0.544 (0.495–0.593) | 0.001 | NA | 0.547 (0.503–0.590) | <0.001 | 0.530 (0.486–0.574) | <0.001 | |
| Thrombus consistency | 0.560 (0.511–0.608) | 0.002 | 0.558 (0.509–0.606) | 0.001 | NA | 0.565 (0.522–0.608) | <0.001 | 0.584 (0.541–0.627) | 0.002 | |
| Perirenal fat invasion | 0.554 (0.509–0.600) | 0.002 | 0.612 (0.564–0.660) | 0.088 | 0.644 (0.550–0.739) | 0.256 | 0.537 (0.496–0.577) | <0.001 | 0.594 (0.553–0.636) | 0.004 |
| Tumor size | 0.501 (0.439–0.562) | <0.001 | 0.547 (0.492–0.603) | <0.001 | 0.580 (0.464–0.695) | 0.055 | 0.501 (0.451–0.552) | <0.001 | 0.530 (0.483–0.578) | <0.001 |
| Pathological T stage | 0.604 (0.554–0.654) | 0.104 | 0.607 (0.557–0.656) | 0.064 | 0.688 (0.600–0.776) | 0.686 | 0.606 (0.559–0.652) | 0.075 | 0.567 (0.522–0.612) | 0.001 |
| Thrombus levela | 0.610 (0.557–0.663) | 0.149 | 0.621 (0.567–0.674) | 0.172 | 0.700 (0.604–0.795) | 0.791 | 0.606 (0.558–0.654) | 0.073 | 0.574 (0.526–0.621) | 0.001 |
- a According to the Mayo Clinic Classification.1
- Abbreviations: CI, confidential interval; DFS, disease-free survival.; NA, not available; OS, overall survival; PT, primary tumor; VTT, venous tumor thrombus.
Additionally, the VTT grading held significance for OS and DFS within the subgroups of patients stratified by clinical and pathological features such as age, adjuvant therapy, tumor size, Mayo clinic classification, PT grading, vascular well invasion, and thrombus consistency (Figures S4–S7). Overall, VTT grading displayed superior accuracy and discriminatory ability in predicting survival risk for nonmetastatic ccRCC patients with VTT.
2.4 Development and validation of prognostic model TT-GPS
Based on the above results, a prognostic model incorporating VTT grading may provide more accuracy in risk assessment. Hence, a simple scoring algorithm was developed using the regression coefficients from multivariable Cox analysis in the Training cohort. The coefficient for each independent variable was divided by the coefficient for VTT grading IV, multiplied by 3 and rounded to the nearest integer (Table 2). This model was named as TT-GPS score, indicating its four variables: VTT height (Mayo Clinic classification), VTT grading, perinephric fat invasion, and sarcomatoid differentiation in PT. The average TT-GPS score in this study was 2.620 (median 3, range 0–7). Only 32 (4.6%) patients had score of 6 and 7, thus patients with score higher than 5 were combined. Significant differences in OS and DFS among different scores were illustrated by Kaplan–Meier curves in independent cohorts (all p < 0.001; Figures 4A–C and Tables S5 and S6).
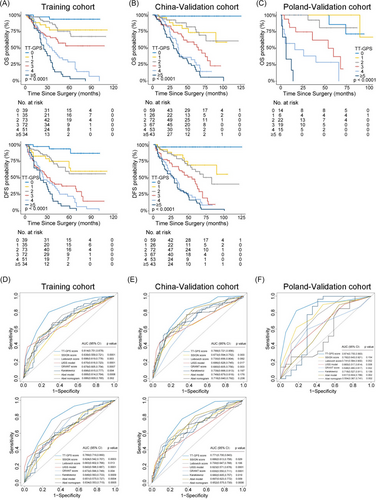
We next compared the TT-GPS score with previously reported prognostic models, including SSIGN score,8 2003 Leibovich score,9 UISS model,10 Karakiewicz Nomogram,3 and GRANT score11 for the general population of RCC patients; Abel model12 and Abel nomogram13 specific for nonmetastatic RCC patients with VTT. The c-indices of TT-GPS score for OS were 0.706 (95% CI, 0.658–0.753) and 0.732 (95% CI, 0.685–0.779) for Training and China-Validation cohorts, respectively, which were higher than other prognostic models (Table 3). In Poland-Validation cohort, the TT-GPS score also outperformed those prognostic models in predicting OS (0.840, 95% CI, 0.791–0.889; Table 3). The superiority of the prognostic accuracy of TT-GPS score to other prognostic models was confirmed by ROC analysis (Figures 4D–F). Although the predicted probability of TT-GPS score for 5-year OS and DFS had concordance with that of the observed probability in all three cohorts, poor calibration of other prognostic models was observed in Poland-Validation cohort (Figure S8). Moreover, the TT-GPS score provided consistent positive and larger net benefit across a broad range of risk thresholds compared with other prognostic models by decision curve analysis (DCA) (Figure S9).
| OS | DFS | |||||||||
|---|---|---|---|---|---|---|---|---|---|---|
| Training cohort (n = 304) | China-Validation cohort (n = 320) | Poland-Validation cohort (n = 82) | Training cohort (n = 304) | China-Validation cohort (n = 320) | ||||||
| Prognostic model | c-Index (95% CI) | p | c-Index (95% CI) | p | c-Index (95% CI) | p | c-Index (95% CI) | p | c-Index (95% CI) | p |
| TT-GPS score | 0.706 (0.658–0.753) | 0.732 (0.685–0.779) | 0.840 (0.791–0.889) | 0.691 (0.649–0.732) | 0.717 (0.675–0.760) | |||||
| SSIGN score | 0.584 (0.532–0.637) | <0.001 | 0.637 (0.587–0.686) | 0.001 | 0.718 (0.611–0.826) | 0.028 | 0.555 (0.506–0.603) | <0.001 | 0.629 (0.582–0.676) | <0.001 |
| Leibovich score | 0.636 (0.586–0.686) | 0.005 | 0.678 (0.632–0.724) | 0.016 | 0.704 (0.610–0.797) | 0.003 | 0.605 (0.559–0.650) | 0.002 | 0.649 (0.603–0.695) | 0.001 |
| UISS model | 0.640 (0.597–0.683) | 0.043 | 0.644 (0.602–0.686) | 0.001 | 0.732 (0.642–0.822) | 0.012 | 0.622 (0.585–0.659) | 0.015 | 0.595 (0.561–0.629) | <0.001 |
| GRANT score | 0.603 (0.551–0.656) | 0.002 | 0.641 (0.587–0.696) | 0.002 | 0.696 (0.613–0.780) | 0.001 | 0.599 (0.553–0.644) | <0.001 | 0.598 (0.547–0.648) | <0.001 |
| Karakiewicz nomogram | 0.630 (0.576–0.684) | 0.007 | 0.684 (0.632–0.736) | 0.054 | 0.672 (0.565–0.779) | 0.001 | 0.603 (0.553–0.654) | 0.001 | 0.641 (0.592–0.690) | <0.001 |
| Abel model | 0.629 (0.579–0.680) | 0.004 | 0.672 (0.622–0.722) | 0.004 | 0.714 (0.629–0.800) | 0.001 | 0.603 (0.559–0.648) | <0.001 | 0.640 (0.594–0.686) | <0.001 |
| Abel nomogram | 0.606 (0.546–0.667) | 0.004 | 0.627 (0.567–0.686) | <0.001 | 0.698 (0.598–0.798) | 0.005 | 0.581 (0.531–0.631) | <0.001 | 0.591 (0.540–0.643) | <0.001 |
- Abbreviations: CI, confidential interval; DFS, disease-free survival.; GRANT, the GRade, Age, Nodes and Tumor; OS, overall survival; SSIGN, the Mayo Clinic Stage, Size, Grade and Necrosis; TT-GPS, VTT height, VTT grading, perinephric fat invasion, sarcomatoid differentiation in PT; UISS, the University of California Los Angeles Integrated Staging System.
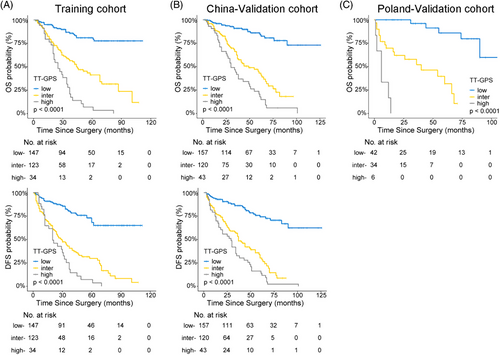
For clinical application, three-tiered risk groups were defined as low (score 0−2), intermediate (score 3 and 4), and high (score ≥ 5) TT-GPS score by using X-tile plots. Clinical survival rates were well stratified based on this simple classification (Figure 5 and Table S7 and S8). The patients in the low-risk group did not reach a median OS and DFS during follow-up. The median survival of patients in the intermediate-risk and high-risk groups was 46 and 29 months for OS and 36 and 21 months for DFS, respectively. Moreover, the TT-GPS risk classification successfully screened out low- and high-risk patients from those defined as the intermediate-risk group by previously reported models (Tables S9–S12).
3 DISCUSSION
Nonmetastatic ccRCC patients with VTT have variable risk of progression and may possess improved prognosis from accurate risk assessment. By multiregion WES on normal-tumor-thrombus-metastasis quadruples, we offered insights into the notion that VTT served as the main reservoir of distant metastasis.6, 17 However, the clinicopathological features and prognostic potential of VTT have not been systematically evaluated.
To date, pathological reports only describe whether there are tumor cells within VTT in routine clinical practice. Our data comprehensively evaluated multiple characteristics of VTT and showed for the first time that VTT grading represented an unheeded prognostic predictor and outperformed conventional indicators, including PT grading, VTT height and so on. There was no significant difference of tumor cell percentages in VTT specimens among four-tired grading, and no significant difference of Ki67 proliferative index between PT and VTT specimens, indicating that the predictive value of VTT grading is independent of tumor proliferation activity.
Nonmetastatic ccRCC patients with VTT, belonging to locally advanced RCC, are ideal candidates for adjuvant therapy. However, accepting adjuvant therapy had no significance in improving the survival of these patients in our study (p > 0.05; Table S2). The reason may be that there is heterogeneity of progression and survival risk among patients.18 The high-risk subgroup identified by TT-GPS score might be candidates for further aggressive treatment, such as immunotherapy-based therapy. In addition, the TT-GPS score is simple to calculate and all variables are routinely available clinical and pathological features.
Our study is not devoid of limitations. The retrospective nature introduces the risk of measurement and ascertainment biases. Additional cohorts from non-Asian patients are needed to confirm our findings, considering the relatively small sample size of external validation. Since the TT-GPS score is developed and validated only for clear cell histology, further work is needed to expand the score on papillary histology.
In conclusion, we showed that VTT grading represents an unheeded prognostic predictor. Moreover, the TT-GPS score we developed and validated allows for accurate risk positioning, outperforms previously reported models. Further validation of TT-GPS score is currently underway in different ethnic populations to confirm its value. Our study highlights the possibility of introducing VTT grading and TT-GPS score into routine pathological reports to provide further information for risk stratification.
4 MATERIALS AND METHODS
The study was approved by the institutional review board of initiating center Jinling Hospital (ID Number: 2021NZKY-004-01). Written informed consent was obtained from all patients. This study was conducted adhering to guidelines of Declaration of Helsinki for biomedical research and the Transparent Reporting of a multivariable prediction model for Individual Prognosis Or Diagnosis (TRIPOD)19 (Table S13).
4.1 DNA isolation and WES
We collected 164 samples for WES from 33 ccRCC patients with matched tumor-thrombus-metastasis quadrupled samples from the Eastern China Renal Cancer Collaborative Group, including 30 normal tissues, 40 PT samples, 41 VTT samples, and 53 metastasis samples. To avoid the impact of intratumor heterogeneity, multiregions of the same specimens were sampled by a margin of at least 0.5 cm. Every histologic section was independently reviewed by three pathologists to ensure the quality of the specimens. Genomic DNA from formalin-fixed paraffin-embedded (FFPE) samples was extracted using the QIAamp DNA FFPE Tissue Kit (Qiagen). A total of 1 μg DNA were extracted from each sample and sheared into fragment by Covaris (M22). The Equalbit® dsDNA HS Assay Kit was utilized to measure the library concentration; then the Agilent 4200 TapeStation System was utilized to detect the distribution of library fragments, and finally the KAPA Library Quant kit (illumina) universal qPCR Mix was adopted to accurately determine the molar concentration of the library. The gDNA libraries were subjected to high-throughput sequencing with 150-bp pair-end reads on the NovaSeq 6000 Sequencing System (Illumina, San Diego, CA). The average sequencing depth was 150× for tumors and 100× for normal tissues. Details of raw data processing, alignment and somatic mutation calling for genomes were performed with standard protocols, which were described previously.20, 21
4.2 Patient cohorts
We only collected ccRCC patients based on the vast majority proportion of this subtype with VTT.22 Patients with previous anticancer therapy, history of other malignancies (biasing the outcome of prognosis), lack of follow-up data, lack of pathologic specimens, and perioperative mortality (first month after surgery) were excluded from the analysis. Thus, the final evaluable dataset enrolled 706 consecutively nonmetastatic ccRCC patients who underwent radical nephrectomy and thrombectomy, including 304 in the Training cohort from the Eastern China Renal Cancer Collaborative Group, 320 in the China-Validation cohort and 82 in the Poland-Validation cohort.
Follow-up was performed according to the institutional protocols, which was executed postoperatively at least every 3−6 months for the first 5 years and annually thereafter. The primary outcome was OS, defined as the interval from the date of radical surgery to the date of death from any cause, or the last follow-up period. The secondary outcome was DFS, defined as the interval from the date of radical surgery to the date of radiological evidence of tumor progression, death from any cause, or the last follow-up. All follow-ups were concluded in July 2022.
4.3 Clinical variables
Standard preoperative assessments were similar among each institution and included laboratory and radiographic evaluation (computed tomography (CT) or magnetic resonance imaging scans of chest, abdomen, and pelvis). Positron emission tomography/CT was utilized for suspected metastasis. Clinical variables were evaluated for each patient including age at surgery, gender, body mass index, presence of pain or hematuria, hypertension, diabetes, tumor laterality, and thrombus height. The thrombus height was defined according to Mayo Clinic Classification.1 Preoperative laboratory variables included serum creatinine, albumin, hemoglobin, and neutrophil to lymphocyte ratio. Operative risk factors included surgical approach (open or laparoscopic), surgical time, and blood transfusion. Following the European Association of Urology Guidelines,2 decisions about the surgical approach were made by the primary surgeon based on individual patient/tumor characteristics.
4.4 Pathological variables
Pathological variables including the World Health Organization/International Society of Urological Pathology (WHO/ISUP) grading,16 perinephric fat invasion, presence of tumor necrosis, presence of sarcomatoid differentiation, and rhabdoid differentiation were evaluated in both PT and VTT specimens. VTT grading was based on the highest grading present on any slide, even if focal, as the same as PT grading.16 Specifically, ISUP grading I were defined as having inconspicuous or absent nucleoli at ×400 magnification; for ISUP grading II, nucleoli should be distinctly visible at ×400, but inconspicuous or invisible at ×100 magnification; and for ISUP grading III, nucleoli should be distinctly visible at ×100 magnification. ISUP grading IV was defined by the presence of pronounced nuclear pleomorphism, tumor giant cells, and/or rhabdoid and/or sarcomatoid differentiation.23 The thrombus consistency24 and vascular wall invasion25 were also determined in VTT specimens. The TNM stage was determined according to the 8th edition American Joint Committee on Cancer (AJCC) classification.26 All pathological specimens were centrally reviewed by two genitourinary pathologists (Hui Chen and Yao Fu, with 12 and 8 years of experience in uropathology, respectively) blinded to clinical information. When there was a different opinion, a third pathologist (Qiu Rao with 22 years of experience in uropathology) re-evaluated the slice and finally reached a consensus.
4.5 Sample size calculation
According to the previous studies about PT grading in nonmetastatic ccRCC patients with VTT,12, 13 we assumed that the proportion of VTT grading I–II was about 30% and the hazard ratio (HR) of death was 3 for VTT grading III–IV versus I–II. The overall death rate was 40% during follow-up in our study. Every cohort needed at least 78 patients to obtain statistically significant HR with a two-sided test at a significance level of 0.05 and a power of 0.8. Moreover, the 5-year OS rates were assumed to be 50% in the high-risk group and 80% in the low-risk group according to our prognostic model. Every cohort needed at least 62 patients to detect the difference with a two-sided log-rank test at a significance level of 0.05 and a power of 0.8 in an average 5-year follow-up. Therefore, a minimum sample size of 78 patients was required for each cohort. The procedure “Cox Regression” and “Logrank Tests” in PASS 15 was used to calculate the sample size.
4.6 Statistical analysis
Categorical variables, normally distributed continuous variables, and non-normally distributed continuous variables were reported as numbers and percentages, means and standard deviations, medians and IQR, respectively. The ANOVA tests were utilized to test differences between multiple groups for continuous variables assuming normal distribution and homogeneity of variance. If not, Kruskal–Wallis tests would be applied. Chi-square test and Cochran–Mantel–Haenszel Chi-square test were used to test differences between categorical variables and ordinal variables. The Kaplan–Meier method with log-rank test was used for survival analysis and comparisons. Univariable and multivariable Cox regression analyses were performed to identify independent predictors associated with survival outcomes. Factors significant on univariable cox regression were evaluated by stepwise cox regression with 0.05 for entry and 0.1 for staying. The missing rate of the variables included in our data was relatively low, mostly between 0 and 3% and all variables except for pathological characteristics were integral in these cohorts. Therefore, as primary analysis, we conducted a complete-case analysis using the participants with complete data. Pathological stage was excluded in the multivariable analysis because of collinearity with Mayo Clinic classification, and Spearman correlation coefficients were 0.95, 0.93 and 0.99 in three cohorts. We evaluated the discrimination or prognostic accuracy of prognostic indicators or models using Harrell's concordance index (c-index), which is appropriate for censored data.27 We also used time-dependent ROC analysis and AUC to measure prognostic accuracy. The discrimination of models was compared by c-index28 and AUC.29 Calibration plots were generated to assess how closely the predicted outcomes approximated the actual outcomes.30 Clinical usefulness of the prediction model was assessed by DCA by quantifying the net benefits at different threshold probabilities.31 All statistical tests were two-sided with a significance level set at 0.05. All statistical analyses were performed using SAS software version 9.4 (SAS Institute Inc., Cary, NC, USA), except c-index, ROC, calibration plots, and DCA using R 4.0.4. (R Project for Statistical Computing, Vienna, Austria).
AUTHOR CONTRIBUTION
L. Q. and L. H. W. were the overall principal investigators who conceived the study and obtained financial support. W. Q. Z., J. P. G., L. H. W., X. F., B. K. S., S. G. W., J. H. Z., W. X., M. C., H. Q. G., X. B. Z., W. J. Q., H. F. W., D. X., N. X., C. Z. L., G. X. W., Y. X. L., H. W. Z., Z. Y. L., Ł. Z., and Z. W. contributed to provision of study material or patients. S. L. G., N. W. Y., Y. L. Z., Z. J. W., Y. Z., T. L. Z., Y .F .G., H. M., H. W. H., X. M. Y., C. P. T., D. F., R. C., X. Z., G. Y. Z., C. W. J., C. Z., Y. M. L., C. C. F., T. L. J., S. H. C., S. T., C. Z., L. W., and W. Z. contributed to acquisition of data, including patient information and slice collection. H. C., Y. F., and Q. R. contributed to the pathological review of slides. L. Q., Q. C., A. M. J., M. X. H., B. H., X. F., M. K., J. L. G., D. S., and C. C. contributed to statistical analysis and interpretation of the results. L. Q., Y. M. L., and C. C. contributed to writing, review, or revision of the manuscript. All authors have read and approved the final manuscript.
ACKNOWLEDGMENTS
This work was supported by the National Natural Science Foundation of China (No. 81772740 and 82173345 to Le Qu, No. 81972333 to Cheng Chen, No. 81730073 and 81872074 to Linhui Wang), Natural Science Foundation of Jiangsu Province for Distinguished Young Scholars (No. BK20200006 to Le Qu), China National Key Research and Development Program Stem Cell and Translational Research Key Projects (2018YFA0108300 to Le Qu), and Project of Jiangsu Province for Distinguished Postdoctor (No.2022ZB741 to Hui Chen). We thank the participating institutions for providing the data and samples, and Dr. Xiaoxia Wang, Dr. Qiuyuan Xia, and Dr. Xiaotong Wang for their valuable comments and HaploX Biotechnology (Jiangxi, China) for their participation in the WES analysis. Furthermore, we gratefully acknowledge the patients and their families for making available the tumor specimens analyzed, and Anxin and Anqi for their angelic smile encouraging us.
CONFLICT OF INTEREST STATEMENT
All authors declare no competing interests.
ETHICS STATEMENT
The study was approved by the institutional review board of initiating center Jinling Hospital (ID Number: 2021NZKY-004-01). Written informed consent was obtained from all patients. This study was conducted adhering to guidelines of Declaration of Helsinki for biomedical research and the Transparent Reporting of a multivariable prediction model for Individual Prognosis Or Diagnosis (TRIPOD).
Open Research
DATA AVAILABILITY STATEMENT
The datasets generated during and analyzed during the current study are available by the corresponding author, upon reasonable request. The WES data have been deposited (PRJCA014721) in the Genome Sequence Archive of Human in the BIG Data Center which are publicly accessible at https://bigd.big. ac.cn/gsa-human.


