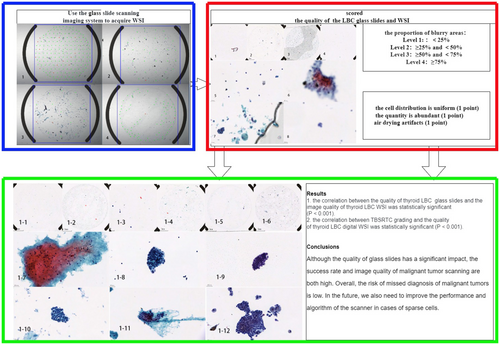
Study on the Transformation Process of Thyroid Fine-Needle Aspiration Liquid-Based Cytology to Whole-Slide Image
Yuanyuan Lei and Dongcun Wang contributed equally to this work.
Funding: This research was funded by National Cancer Center/National Clinical Research Center for Cancer/Cancer Hospital & Shenzhen Hospital, Chinese Academy of Medical Sciences and Peking Union Medical College, Shenzhen + E010321010. Supported by Shenzhen High-level Hospital Construction Fund. Sanming Project of Medicine in Shenzhen (SZSM202411001).
ABSTRACT
Objective
Analyse and summarise the reasons for failure in the digital acquisition of thyroid liquid-based cytology (LBC) slides and the technical challenges, and explore methods to obtain reliable and reproducible whole digital slide images for clinical thyroid cytology.
Method
Use the glass slide scanning imaging system to acquire whole-slide image (WSI) of thyroid LBC in sdpc format through different. Statistical analysis was conducted on the different acquisition methods, the quality of the glass slides, clinical and pathological characteristics of the case, TBSRTC grading and the quality of WSI.
Results
The WSI obtained by different scanning methods showed a high level of consistency in quality (W = 0.325, p < 0.001), especially between fully automatic scanning with different focus densities (W = 0.9, p < 0.001). A total of 2114 images were obtained through different methods of multi-layer fusion and multi-point focusing scanning, with scan success rates of 100.0%, 100.0%, 100.0% and 23.6%, respectively. The correlation between the quality of thyroid LBC glass slides and the image quality of thyroid LBC WSI was statistically significant (p < 0.001). The correlation between TBSRTC grading and the quality of thyroid LBC digital WSI was statistically significant (p < 0.001).
Conclusions
Although the quality of glass slides has a significant impact, the success rate and image quality of malignant tumour scanning are both high. Overall, the risk of missed diagnosis of malignant tumours is low. In the future, we also need to improve the performance and algorithm of the scanner in cases of sparse cells.
Graphical Abstract
1 Introduction
With the popularity of physical examination, the prevalence of thyroid nodules found in adult ultrasound examination can be as high as 76% [1], but thyroid cancer only accounts for 7%–15% of thyroid nodules [2]. Prepoperative cytological evaluation is the current standard of care. Fine-needle aspiration cytology (FNAC) is minimally invasive, convenient and economical and is considered to be the most accurate and cost-effective diagnostic tool for preoperative evaluation of benign and malignant thyroid nodules [3]. With the advent of the artificial intelligence (AI) era, more and more AI is being applied to pathological diagnosis, which may be particularly useful in screening cytology, as the majority of cases are negative [4]. WSI is the first step in implementing AI assisted diagnosis. Unlike cervical exfoliated cytology, which has a large number of cells, thyroid FNAC has a varying number of cells. Sometimes, due to calcification or cystic changes in thyroid nodules itself, the number of cells obtained by aspiration is extremely small, and the Thinprep Cytologic Test (TCT) yields an even smaller number of cells. The lack of optimised scanners for cytology specimens poses additional challenges in obtaining high-quality WSI, which can limit the development of AI assisted algorithms using cytological digital images [5]. We now evaluate the quality of the obtained digital WSI, analyse and summarise the reasons and technical difficulties for the failure of digital acquisition of thyroid fluid-based cell images, and search for improved methods to obtain high-quality digital images of thyroid LBC.
2 Materials and Methods
2.1 Patients and Clinical Data
Retrospective collection of 2305 thyroid LBC glass slides, corresponding cytological diagnoses and clinical pathological data completed by the Pathology Department of Cancer Hospital and Shenzhen Hospital, Chinese Academy of Medical Sciences and Peking Union Medical College from 2020 to 2023. The samples were collected from 1792 patients, including 483 males and 1309 females, with a male-to-female ratio of 1:2.7. The age range was 7–82 years old, and the median age was 42 years old. All FNA procedures were performed under the guidance of ultrasound by experienced sonographers in the hospital where the author was working. After aspiration, all FNA procedures were put into a centrifuge tube equipped with cell cleaning solution (Thinprep-cytolytR solution). After shock centrifugation, liquid-based thin slices (Thinprep5000) were prepared and fixed with 95% ethanol for 15 min. Papanicolaou-stained samples were performed according to the standard procedure.
2.2 Ethics Approval and Consent to Participate
This study was approved by ethics committee of Shenzhen Hospital, Chinese Academy of Medical Sciences and Peking Union Medical College (Shenzhen, China). Written informed consent was also obtained from all patients.
2.3 TBSRTC Grading
The cytological diagnosis of each specimen was made by two dedicated cytopathologists trained and experienced in the diagnosis of thyroid TBSRTC cytopathology. According to the criteria of TBSRTC 2023 edition, the diagnosis is divided into the following six grades [6]; grade I: nondiagnostic (ND), grade II: benign, grade III: atypia of undetermined significance (AUS), grade IV: follicular neoplasm (FN), grade V: suspicious for malignancy (SFM), and grade VI: malignant.
2.4 Methods and Related Definitions
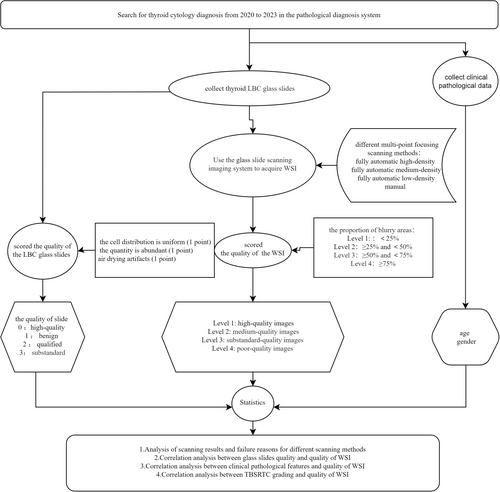
Each slide is scanned using the glass slide scanning imaging system (Shenzhen, Shengqiang SQS600P) to acquire WSI of thyroid LBC in sdpc format through different scanning methods (fully automatic high-density multi-point focusing scanning, fully automatic medium-density multi-point focusing scanning, fully automatic low-density multi-point focusing scanning and manual multi-point focusing scanning), all glass slides from thyroid FNA- LBC specimens were digitised at ×40 with 1.75 μm interval using three focal plane levels. Two pathologists independently scored the quality of the LBC glass slides and the WSI. Quality of LBC glass slides: Based on whether the cell distribution is uniform (one point for areas with three-dimensional structures exceeding 30%), whether the quantity is abundant (one point for blank areas greater than 50%), and whether there is air drying artefacts (one point), according to a total score of 0–3 points, it is divided into four levels: 0 points for high-quality slides, one points for benign slides, two points for qualified slides and three points for substandard slides. The quality evaluation of digital slice images is divided into four levels based on the proportion of blurry areas caused by defocus: Level 1: high-quality images, with no or localised blurred areas in the entire image (blurred area < 25%); Level 2: medium-quality images, with areas showing focal blurring throughout the entire image (blurred area ≥ 25% and < 50%); Level 3: substandard-quality images, with partial blurred areas throughout the entire image (blurred area ≥ 50% and < 75%); Level 4: poor-quality images, with most of the entire image appearing as blurry areas (blurred area ≥ 75%). Use statistical methods to analyse the consistency of the evaluation results of two pathologists, track the inconsistent results and obtain images with inconsistent quality through different methods. Take the best quality image as the final digital image obtained from this slice for subsequent experiments and analysis.
2.5 Statistics
Data were analysed with SPSS ver. 25.0 (SPSS Inc., Chicago, IL, USA). The χ2 test were used to analyse the significant differences in the correlation between scanning method and scanning success; Pathologists independently evaluated the quality of LBC glass slides and WSI, and compared the consistency of results and the correlation between scanning methods and digital slice quality using Kendall's W test; The correlation between the quality of LBC glass slides, clinical and pathological characteristics of the case, TBSRTC grading, and the quality of WSI was assessed using the χ2 test. The level of significance was set at α = 0.05 for bilateral tests, and p value < 0.05 was considered significant.
3 Results
3.1 Analysis of Scanning Results and Failure Reasons for Different Scanning Methods
A total of 2305 LBC glass slides were collected and scanned using different methods with a slide scanning imaging system to obtain sdpc format WSI of thyroid LBC (The technical roadmap is shown in Figure 1). The average time required for each scan with different scanning methods was 7.8, 8.4, 8.9 and 15.1 min, respectively (Table 1). Compared to fully automatic scanning, manual scanning had a higher success rate (p < 0.05). 1179 (51.1%) images were obtained through fully automatic high-density multi-point focusing scanning. Among the 1126 slides that failed to be scanned, the cause analysis revealed that 696 slides were due to uneven cell distribution, 204 slides were due to uneven cell thickness, 219 slides were due to sparse cells, and seven of the slides were air drying artefacts; 1285 (55.7%) images were obtained through fully automatic medium-density multi-point focusing scanning. Among the 1020 slides that failed to be scanned, the cause analysis revealed that 601 slides were due to uneven cell distribution, 193 slides were due to uneven cell thickness, 219 slides were due to sparse cells and seven of the slides were air drying artefacts; 1374 (59.6%) images were obtained through fully automatic low-density multi-point focusing scanning. Among the 931 slides that failed to be scanned, the cause analysis revealed that 516 slides were due to uneven cell distribution, 190 slides were due to uneven cell thickness, 218 slides were due to sparse cells and seven of the slides were air drying artefacts; 2114 (91.7%) images were obtained through manual multi-point focusing scanning. Among the 191 slides that failed to be scanned, the cause analysis revealed that 186 slides had sparse cells, and five of the slides were air drying artefacts (Table 2).
| Scanning methods | Success | Failed | Success rate (%) | Average time required (min) |
|---|---|---|---|---|
| High-density | 1179 | 1126 | 51.1% | 7.8 |
| Medium-density | 1285 | 1020 | 55.7% | 8.4 |
| Low-density | 1374 | 931 | 59.6% | 8.9 |
| Manual | 2114 | 191 | 91.7% | 15.1 |
| High-density (%) | Medium-density (%) | Low-density (%) | Manual (%) | |
|---|---|---|---|---|
| Uneven cell distribution | 69 (61.8%) | 601 (58.9%) | 516 (55.4%) | 0 |
| Uneven cell thickness | 204 (18.1%) | 193 (18.9%) | 190 (20.4%) | 0 |
| Sparse cells | 219 (19.4%) | 219 (21.5%) | 218 (23.4%) | 186 (97.4%) |
| Air drying artefacts | 7 (0.6%) | 7 (0.7%) | 7 (0.8%) | 5 (2.6%) |
| Total | 1126 | 1020 | 931 | 191 |
3.2 Analysis of Correlation Factors Affecting the Quality of WSI
3.2.1 Correlation Analysis Between Different Scanning Methods and Quality of WSI
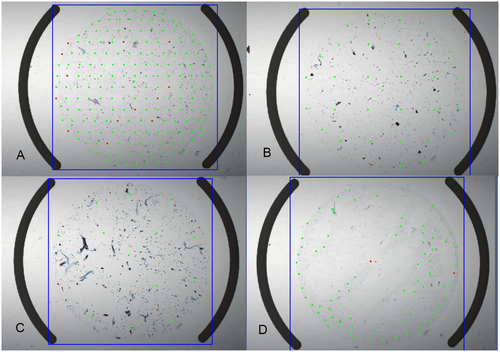
Two pathologists evaluated the quality of the WSI, and the results of the two pathologists were basically consistent (W = 0.98, p < 0.001). Some inconsistent evaluations were reached through discussion, and the final results of all image quality assessments are shown (Figure 2 and Table 3): 1179 images were obtained from fully automated high-density multi-point focusing scans, of which 1094 (92.8%) were of high quality, 57 (4.8%) were of medium quality, 16 (1.4%) were of substandard quality, and 12 (1.0%) were of poor quality; 1285 images were obtained through fully automatic medium-density multi-point focusing scanning, including 1183 (92.1%) images with high quality, 63 (4.9%) images with medium quality, 26 (2.0%) images with substandard quality and 13 (1.0%) images with poor quality; 1374 images were obtained through fully automatic low-density multi-point focusing scanning, including 1266 (92.1%) images with high quality, 66 (4.8%) images with medium quality, 27 (2.0%) images with substandard quality, and 15 (1.1%) images with poor quality; Manual multi-point focusing scanning obtained 2114 images, of which 1721 (81.4%) were of high quality, 145 (6.9%) were of medium quality, 105 (5.0%) were of substandard quality and 143 (6.8%) were of poor quality.
| Slides total | High-quality images | Medium-quality images | Substandard-quality images | Poor-quality images | Images total | Success rates | Excellent rates | |
|---|---|---|---|---|---|---|---|---|
| Scanning methods | ||||||||
| High-density | 2305 | 1094 | 57 | 16 | 12 | 1179 | 51.10% | 97.60% |
| Medium-density | 2305 | 1183 | 63 | 26 | 13 | 1285 | 55.70% | 97.00% |
| Low-density | 2305 | 1266 | 66 | 27 | 15 | 1374 | 59.60% | 96.90% |
| Manual | 2305 | 1721 | 145 | 105 | 143 | 2114 | 91.70% | 88.30% |
| Quality of slides | ||||||||
| High-quality | 1126 | 1057 | 53 | 16 | 0 | 1126 | 100.00% | 98.60% |
| Benign | 713 | 624 | 89 | 0 | 0 | 713 | 100.00% | 100.00% |
| Qualified | 216 | 0 | 0 | 85 | 131 | 216 | 100.00% | 0.00% |
| Substandard | 250 | 40 | 3 | 4 | 12 | 59 | 23.60% | 72.90% |
| Age | ||||||||
| < 42 | 1202 | 902 | 89 | 57 | 69 | 1117 | 92.90% | 88.70% |
| ≥ 42 | 1103 | 819 | 56 | 48 | 74 | 997 | 90.40% | 87.80% |
| Gender | ||||||||
| Man | 593 | 441 | 37 | 22 | 40 | 540 | 91.10% | 88.50% |
| Female | 1712 | 1280 | 108 | 83 | 103 | 1574 | 91.90% | 88.20% |
| TBSRTC grading | ||||||||
| I | 57 | 20 | 0 | 3 | 8 | 31 | 54.40% | 64.50% |
| II | 670 | 468 | 28 | 30 | 55 | 581 | 86.70% | 85.40% |
| III | 143 | 95 | 5 | 11 | 16 | 127 | 88.80% | 78.70% |
| IV | 90 | 73 | 3 | 3 | 7 | 86 | 95.60% | 88.40% |
| V | 179 | 127 | 15 | 10 | 14 | 166 | 92.70% | 85.50% |
| VI | 1166 | 938 | 94 | 48 | 43 | 1123 | 96.30% | 91.90% |
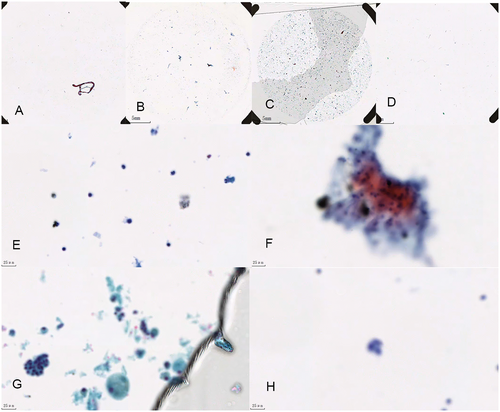
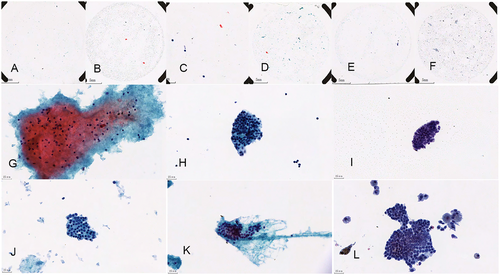
The WSI obtained from the same slide using different scanning methods showed basically consistent quality (W = 0.99, p < 0.001). For the few images that showed inconsistent quality due to different methods, the best quality image was retained as the final digital image available for that slide for subsequent experiments and analysis. An analysis was conducted on the reasons for the poor quality of the WSI obtained (see Figure 3): mainly due to uneven cell thickness (131, 91.6%), and a small portion due to sparse cells resulting in large blurry sections (12, 8.4%).
3.2.2 Correlation Analysis Between Glass Slides Quality and Quality of WSI
Evaluation of glass slides quality was conducted, with 1126 high-quality slides (48.9%), 713 benign slides (30.9%), 216 qualified slides (9.4%) and 250 substandard slides (10.8%). The multi-layer fusion multipoint focusing scanning obtained 2114 images, with scanning success rates of 100.0%, 100.0%, 100.0% and 23.6% respectively; Among them, high-quality slides correspond to 1057 images with high-quality, 53 images with medium-quality and 16 images with substandard-quality; benign slides correspond to 624 images with high-quality, 89 images with medium-quality; qualified slides correspond to 85 images with substandard-quality and 131 images with poor-quality; substandard slides correspond to 40 images with high-quality, three images with medium-quality, four images with substandard-quality and 12 images with poor-quality. The excellent rates of all WSI are 98.6%, 100.0%, 0.0% and 72.9%, respectively (Table 3); The quality of thyroid LBC glass slices was found to be strongly correlated with the image quality of WSI, with statistical significance (p < 0.001).
3.2.3 Correlation Analysis Between Clinical Pathological Features and Quality of WSI
A total of 2305 FNA samples were obtained from 1792 patients with ultrasound-guided aspiration of thyroid nodules, including 483 males and 1309 females, age range 7–82 years old, median age 42 years old. The quality of WSI was not related to age and gender (p > 0.05).
3.2.4 Correlation Analysis Between TBSRTC Grading and Quality of WSI
2305 LBC diagnoses were classified according to TBSRTC, and the success rates of I–VI grade scans were 54.4%, 86.7%, 88.8%, 95.6%, 92.7% and 96.3%, respectively (Figure 4). Among the WSI obtained at grade I, 20 images with high-quality, three images with substandard-quality and eight images with poor-quality; among the WSI obtained at grade II, 468 images with high-quality, 28 images with medium-quality, 30 images with substandard-quality and 55 images with poor-quality; among the WSI obtained at grade III, 95 images with high-quality, five images with medium-quality, 11 images with substandard-quality and 16 images with poor-quality; among the WSI obtained at grade IV, 73 images with high-quality, three images with medium-quality, three images with substandard-quality and seven images with poor-quality; among the WSI obtained at grade V, 127 images with high-quality, 15 images with medium-quality, 10 images with substandard-quality and 14 images with poor-quality; among the WSI obtained at grade VI, 938 images with high-quality, 94 images with medium-quality, 48 images with substandard-quality and 43 images with poor-quality; The excellent rates of WSI are 64.5%, 85.4%, 78.7%, 88.4%, 85.5% and 91.9%, respectively (Table 3). TBSRTC grading was found to be strongly correlated with the image quality of WSI, with statistical significance (p < 0.001).
4 Discussion
The artificial intelligence evaluation algorithm for thyroid FNAB specimens has been used for over a decade [7], with a variety of algorithms have achieved good results to a certain extent [8-11]. However, an important issue in practical clinical work is to obtain high-quality WSI, and we have found many problems in the preliminary image conversion process.
Our laboratory uses a glass slide scanning imaging system (Shenzhen Shengqiang, SQS600P) to acquire WSI of thyroid LBC in sdpc format through different scanning methods, all glass slides from thyroid FNA- LBC specimens were digitised at ×40 with 1.75 μm interval using three focal plane levels [12]. Although the fully automatic multi-point focusing scanning method is convenient and time-consuming, it is easily affected by uneven cell distribution. This is because the scanning program algorithm is set to require a 60% success rate in the first five focus points before the scanning program can be initiated. Therefore, when the cell distribution is uneven, if the first five focus points fall in an area with fewer cells, the focusing will fail, which can easily lead to a failed scan. The higher the density of the automatic scanning focus points, the greater the probability of falling in the blank area, and the greater the impact on scanning. Communicate with the instrument engineer to improve the method: 1. Changed the algorithm to enable the full-film scanning program. Reduce the standard of the success rate of the first five focus points and improve the rate of full-film scanning. 2. Change the algorithm for selecting the first five focus points. Currently, all algorithm settings are based on selecting fixed default points, and change to selecting areas with high cell density for the first five focus points after pre-scanning. In this study, although the automatic multi-point focus scanning method is convenient and time-consuming, it is easily affected by uneven cell distribution and uneven cell thickness, resulting in scanning failure and the higher the density, the greater the impact of scanning focus, relatively speaking, manual focus scanning is less affected, and the success rate is as high as 91.7%, compared with 51.1%–59.6% of fully automatic, the success rate has been greatly improved, but it has two shortcomings: 1. It is time-consuming and cannot save time, which goes against the clinical need to use artificial intelligence to assist diagnosis and save time [13]; 2. The high labour cost goes against the original intention of developing artificial intelligence to save human resources. In practice, you can combine automatic and manual scanning methods, set the automatic scanning mode first, and manually scan after failure to improve the success rate of scanning.
WSI scanners available are optimised to create digital images from Haematoxylin and Eosin (H&E) formalin-fixed paraffin-embedded (FFPE) tissue specimens [14, 15], quality assurance is of paramount importance [16]. However, unlike H&E that are thin and evenly spread, the diversity of cytological preparation methods (smear and liquid based) and the quality of cytological sections vary, and the number of cells in each cytological specimen varies (some are abundant, some may only have a few cells) and the thickness is inconsistent, cytology smears may cover the entire glass slide surface, cytology material has areas of variable thickness, there may be obscuring material, and cell clusters in three-dimensions make it difficult to focus in just one plane [17] making it difficult to obtain high-quality WSI. We chose LBC with fully automated smear and staining because LBP has advantages over conventional specimens, especially ThinPrep, because they achieve single-layer cells, reduce 3D clusters and cell overlap within defined areas, reduction of blood and inflammation obscuring the cells, even distribution of the cells on the slide, well preserved nuclear details [18]. The consistency between the quality evaluation results of the WSI obtained from scanning by two physicians is very high, which is consistent with the diagnostic consistency of different pathologists for the same case, indicating that different doctors have consistent interpretations of the same WSI. Our research shows that the image quality of the same glass slide scanned using different scanning methods is not significantly different, indicating that the density of the focal point is not related to the quality of WSI.
In our study, we found that only substandard slides have a low success rate and are prone to scan failure, mainly due to uneven cell thickness and sparse cell. Due to the fact that some cells are too abundant and the cell layer is too thick, the WSI of the high-quality slides is blurred and the excellent rate is not as good as that of the benign slides. The quality of all WSI canned from qualified slices is poor. On the contrary, due to the small number of cells in substandard slides, manual multi-point focusing full digital scanning can clearly scan the focal cell nests, with an excellent rate of 72.9%. Therefore, it can be said that substandard slides can also have high-quality WSI after correct processing. Overall, there is a significant correlation between the quality of glass slides and image quality, which has been mentioned in multiple studies [19]. Therefore, in the early stages of production, we should pay attention to the excellent rate of glass slides and reduce the occurrence of artificially poor slides. In addition, although the feasibility of WSI in cytology education has been proven [20], the situation of glass slide quality is very complex in practical work, how to improve the quality of digital images caused by inevitable poor slice quality? Some studies have attempted to detect defocused areas to reduce the impact of blurry areas caused by glass slide quality on subsequent artificial intelligence training [21], there are also studies on algorithms that incorporate quality control into scanner programs [22]. In our subsequent work, we also need to consider this point and attempt algorithm research.
Using TBSRTC, the cytopathologist can communicate thyroid FNA interpretations to the clinical doctor in terms that are succinct, unambiguous and clinically useful [23]. We classified according to the 2023 TBSRTC classification standard and found a strong correlation between TBSRTC classification and the quality of LBC scanning WSI. The success rate of grades I–VI gradually increased, and the success rate of grade VI scanning was as high as 96.3%, with an excellent rate of 91.9%. The success rate of grade I is only 54.4% and the excellent rate is only 64.6%. Due to the fact that grade 1 is unsatisfactory for the specimen itself, and some cell sparsity is determined by the nature of the thyroid nodule itself, which cannot be avoided. Therefore, when we cannot scan it out, it is reasonable to interpret the specimen as unsatisfactory in clinical work. We need to be vigilant about a small number of failed LBC in grades IV, V and VI, which can lead to missed diagnosis in clinical work. We conducted a retrospective analysis and found that the missed samples were mostly scattered with sparse cells. When optimising the scanner in the future, we need to pay attention to improving how to accurately focus scanning when cells are scarce. The success rate and image quality of the grades IV, V and VI scans representing follicular neoplasm, suspicious for malignancy and malignant are relatively high, and the missed diagnosis rate is reduced in clinical work. This confirms the high possibility of using glass slides to transform WSI and then implementing artificial intelligence for screening in thyroid LBC.
In summary, most thyroid LBC glass slides can obtain high-quality WSI through current scanners, regardless of the scanning method, it does not affect the image quality. Although the quality of glass slides has a significant impact, the success rate and image quality of malignant tumour scanning are both high. Overall, the risk of missed diagnosis of malignant tumours is low. In the future, we also need to improve the performance and algorithm of the scanner in cases of sparse cells.
Author Contributions
Yuanyuan Lei: contributed significantly to the analysis and manuscript preparation. Dongcun Wang: performed the data analyses. Yanlin Wen: wrote the manuscript. Jinhui Liu: contributed reagents/materials/analysis tools. Jian Cao: contributed to the conception of the study.
Acknowledgements
In writing this paper, l have benefited from the presence of my teachers and my colleagues, they generously helped me collect materials l needed and made many invaluable suggestions.
Conflicts of Interest
The authors declare no conflicts of interest.
Open Research
Data Availability Statement
The data that support the findings of this study are available from the corresponding author upon reasonable request.


