Relationships between type 2 diabetes, cell dysfunction, and redox signaling: A meta-analysis of single-cell gene expression of human pancreatic α- and β-cells
2型糖尿病、细胞功能障碍和氧化还原信号的关系:人胰腺α-和β-细胞单细胞基因表达的meta分析
Funding information: US National Institute of Health, Grant/Award Numbers: 5R01ES025748-05, P42ES027706
Abstract
enBackground
Type 2 diabetes mellitus (T2DM) is a chronic disease characterized by insulin resistance and failure of β-cells to meet the metabolic demand for insulin. Recent advances in single-cell RNA sequencing (sc-RNA-Seq) have allowed for in-depth studies to further understand the underlying cellular mechanisms of T2DM. In β-cells, redox signaling is critical for insulin production. A meta-analysis of human pancreas islet sc-RNA-Seq data was conducted to evaluate how T2DM may modify the transcriptomes of α- and β-cells.
Methods
Annotated sc-RNA-Seq data from six studies of human pancreatic islets from metabolically healthy and donors with T2DM were collected. α- and β-cells, subpopulations of proliferating α-cells, immature, and senescent β-cells were identified based on expression levels of key marker genes. Each dataset was analyzed individually before combining, using weighted comparisons. Pathways of significant genes and individual redox-related gene expression were then evaluated to further understand the role that redox signaling may play in T2DM-induced β-cell dysfunction.
Results
α- and β-cells from T2DM donors modified genes involved in energy metabolism, immune response, autophagy, and cellular stress. α- and β-cells also had an increased nuclear factor erythroid 2-related factor 2 (NFE2L2)-mediated antioxidant response in T2DM donors. The proportion of immature and senescent β-cells increased in T2DM donors, and in immature and senescent β-cells, genes regulated by NFE2L2 were further upregulated.
Conclusions
These findings suggest that NFE2L2 plays a role in β-cell maturation and dysfunction. Redox singling maybe a key pathway for β-cell restoration and T2DM therapeutics.
摘要
zh背景
2型糖尿病(T2D)是一种以胰岛素抵抗和β细胞无法满足胰岛素代谢需求为特征的慢性疾病。近年来在单细胞RNA测序(sc-RNA-Seq)方面的进展为进一步深入研究T2D的细胞机制奠定了基础。在β细胞中, 氧化还原信号对胰岛素的产生至关重要。本研究对人胰岛sc-RNA-Seq数据进行meta分析, 以评估T2D如何调控α-和β-细胞的转录组。
方法
收集6项研究的sc-RNA-Seq数据, 这些数据来自代谢正常的人胰岛和T2D供者。根据关键标记基因的表达水平鉴定α-细胞和β-细胞、增殖中的α-细胞亚群、未成熟和衰老的β-细胞。在使用加权比较进行组合之前, 每个数据集都被单独分析。然后评估重要基因的通路和单个氧化还原相关基因的表达, 以进一步了解氧化还原信号在T2D诱导的β-细胞功能障碍中可能扮演的角色
结果
来自T2D供者的α-和β-细胞修饰了与能量代谢、免疫反应、自噬和细胞应激相关的基因, 在T2D供者中α-和β-细胞NFE2L2介导的抗氧化反应增强。在T2D供者中, 未成熟和衰老的β-细胞比例增加, 并且在未成熟和衰老的β-细胞中, 受NFE2L2调控的基因进一步上调。
结论
这些发现提示NFE2L2在β-细胞成熟和功能障碍中起作用。氧化还原信号通路可能是β-细胞修复和T2D治疗的关键途径。
1 INTRODUCTION
According to estimates from the International Diabetes Federation atlas, 463 million people had diabetes worldwide in 2019, and this number is expected to climb to 700 million by 2045.1, 2 Type 2 diabetes mellitus (T2DM) is a chronic disease characterized by insulin (INS) resistance and severe β-cell dysfunction. β-cells, along with α, δ, ε, and υ cells make up the islets of Langerhans of the endocrine pancreas and are essential for maintaining glucose homeostasis. β-cells produce INS in response to elevated blood glucose, and α-cells secrete glucagon (GCG), which releases glucose from the liver and lipids from adipose tissue.3 A key feature of T2DM is the failure of β-cells to meet the metabolic demand for INS, and recent advances in single-cell RNA sequencing (sc-RNA-Seq) have allowed for further understanding of the underlying mechanisms of islet cell maturation, maintenance, and dysfunction in T2DM.4
Many sc-RNA-Seq studies have found variable transcript enrichment across different islet cell types and rare cell subpopulations that can only be possible through sc-RNA-Seq.5-12 In T2DM, α-cells may transdifferentiate to β-cells, under an extreme demand for INS, and also have been shown to increase proliferation via an elevated inflammatory response in T2DM and obesity.13-15 β-cells from T2DM donors have been found to have altered β-cell immune response, cell cycle pathways, transcription factor expression, energy metabolism, and protein synthesis in several sc-RNA-Seq studies.10-12 As reviewed by Salinno et al,16 subpopulations of β-cells exist in a balance of proliferative capacity (immature cells)17 or INS production (mature cells).18 The ratio of mature and immature β-cells is thought to reflect the proliferative capability of β-cells.19 Immature β-cells display high basal levels INS; however, it is unclear if they are capable of glucose-stimulated INS secretion.20 Under healthy conditions, only a small pool of β-cells retain proliferative capabilities.21 β-cell proliferation has been shown to increase with INS resistance in obesity,22 and in the present study, the transcriptomes of subpopulations of proliferating α-cells, immature, and senescent β-cells will be evaluated in the context of T2DM.
A key feature in the pathophysiology of T2DM is glucotoxicity and lipotoxicity, which generate high amounts of reactive oxygen species (ROS) and oxidative stress. ROS generation, mitochondrial dysfunction, endoplasmic reticulum (ER) stress, and autophagy are all implicated in the development of T2DM and can impair β-cell function.23, 24 β-cells maintain low levels of antioxidant defenses and an oxidized redox state, which is necessary to form the three disulfide bonds in INS.25-27 ROS also act as signaling molecules to guide cell fate and maturation in β-cells.28-30 The induction of antioxidant enzymes via nuclear factor erythroid 2-related factor 2 (NFE2L2) provides protection from oxidative damage; however, induction of NFE2L2 may also blunt glucose-triggered ROS signaling, thus reducing INS secretion.30 Recently an alternative pathway of NFE2L2 activation has also been described, where blockage of autophagosome-lysosome fusion leads to sequestosome 1 (SQSTM1)-mediated sequestration of Kelch-like epichlorohydrin (ECH)-associated protein 1 (KEAP1) into autophagosomes, preventing NFE2L2 ubiquitylation and degradation.31
In the study herein, a meta-analysis of sc-RNA-Seq data from six studies from human pancreas islets will be conducted to evaluate how T2DM may modify the transcriptomes of several subpopulations of α- and β-cells. The analysis in total represents sc-RNA-Seq data from 47 metabolically healthy human islet donors and 23 donors with T2DM. Subpopulations of proliferating α-cells, immature, and senescent β-cells will be evaluated using pathway analysis, and gene targets in the NFE2L2 pathway will be evaluated in relation to these subpopulations of α- and β-cells. With this analysis, we hope to further understand the role that NFE2L2 may play in T2DM-induced β-cell dysfunction.
2 METHODS
2.1 Inclusion criteria
Studies were selected based on PubMed and Google Scholar searches for the key terms “single-cell sequencing,” “RNA sequencing,” “type 2 diabetes,” and “human pancreas or islets.” To be included in the meta-analysis, studies had to include (1) single-cell transcriptomic sequencing with (2) human pancreatic islet samples, (3) include metabolically healthy and diabetic donors with T2DM, and (4) provide publicly available annotation data. Publicly available single-cell RNA-seq datasets were downloaded from the Gene Expression Omnibus (GEO) repository32 or ArrayExpress33 (European Bioinformatics Institute, EBI), and Table 1 contains study details and accession numbers for selected studies. Before datasets were analyzed, all data were converted to the standard unit of transcripts per kilobase million (TPM). Counts per million reads mapped (CPM) were first converted to reads per kilobase million (RPKM) by dividing CPM by the gene length in kilobase. RPKM values were then converted to TPM by dividing RPKM by the sum of RPKM per sample and multiplying by a 106 scaling factor.
| Study | Dataset location and reference numbers | Human donor info | Sequencing methods | Gene annotation methods | |||||
|---|---|---|---|---|---|---|---|---|---|
| Cell isolation method | Protocol | Sequencing system | Read length and type | Read depth (reads per cell) | Details | Original unit | |||
| Wang et al, 20169 | GEO: GSE83139 | 9 human islets: 3 healthy 2 T2DM 1 T1DMa 2 childa |
Cultured and isolated on a microfluidic system | SMART-seq | Illumina HiSeq 2500 | 100-bp single-end reads | 2.2 million |
|
CPM |
| Segerstolpe et al, 20168 | EBI: E-MTAB-5061 | 10 human islets: 6 healthy 4 T2DM |
Cultured and isolated via FACS | SMART-seq2 | Illumina HiSeq 2000 | 43-bp single-end reads | 0.75 million |
|
RPKM |
| Xin et al, 201610 | GEO: GSE81608 | 18 human islets: 12 healthy 6 T2DM |
Cultured and isolated using a C1 integrated fluidic circuit | SMART-seq | Illumina HiSeq 2500 | 75-bp single-end reads | 0.95 million |
|
RPKM |
| Baron et al, 20165 | GEO: GSE84133 | 4 human islets: 3 healthy 1 T2DM |
Encapsulation into droplets | CEL-seq/MARS-seq | Illumina HiSeq 2500 | 75-bp paired-end reads | 0.1 million |
|
TPM |
| Lawlor et al, 201712 | GEO: GSE86473 | 8 human islets: 5 healthy 3 T2DM |
Cultured and isolated via C1 integrated fluidic circuit | SMART-seq2 | Illumina NextSeq500 | 75-bp single-end reads | 3 million |
|
TPM |
| Camunas-Soler et al, 202011 | GEO: GSE124742 | 28 human islets: 18 healthy 7 T2DM 3 T1DMa |
Isolated via Patch-seq and FACS methods | SMART-seq2 | Illumina NextSeq500 or NovaSeq platform | 75-bp paired-end reads | 1 million |
|
CPM |
- Abbreviations: CPM, normalized counts per million; EBI, European Bioinformatics Institute; FACS, fluorescence-activated cell sorting; GEO, Gene Expression Omnibus; RPKM, reads per kilobase of transcript per million mapped reads; T1DM, type 1 diabetes mellitus; T2DM, type 2 diabetes mellitus; TPM, transcripts per kilobase million.
- a Donors were excluded.
2.2 Cell type annotation
All sequenced cells were classified based on key marker genes. These markers include the major hormone genes (GCG, INS, somatostatin [SST], ghrelin [GHRL], and pancreatic polypeptide [PP]), genes that encode acinar cell-specific digestive enzymes (serine protease 1 [PRSS1] and pancreatic lipase [PNLIP]), and genes associated with ductal cells (i.e., keratin 19 [KRT19], secreted phosphoprotein 1 [SPP1], and hepatocyte nuclear factor 1β [HNF1B]). Expression level of markers had to be exclusive and robust, each cell type was then rendered in a “violin plot,” and if cells conflicted with other expression markers, they were excluded.
2.3 Identification of subpopulations of α- and β-cells
Proliferating α-cells were distinguished by a gene signature with robust expression of marker of proliferation Ki-67 (MKI67), and repression of dual-specificity tyrosine phosphorylation-regulated kinase 1A (DYRK1A) and glycogen synthase kinase 3β (GSK3B), as previously described for proliferating α-cells.9 Immature β-cells were identified from the pooled dataset by exclusive and robust expression of markers of immaturity, macrophage-activating factor (MAF) basic region-leucine zipper (bZIP) transcription factor B (MAFB) and/or neuropeptide Y (NPY), over markers for mature β-cells (MAF bZIP transcription factor A [MAFA], synaptotagmin 4 [SYT4], NK6 homeobox 1 [NKX6-1], urocortin 3 [UNC3], pancreatic and duodenal homeobox 1 [PDX-1], and glucose transporter 2 [SLC2A2 or GLUT2]) as reviewed by Salinno et al.16 β-cells were also defined as senescent if they had robust expression of senescent markers, INS-like growth factor 1 receptor (IGF1R), and cyclin-dependent kinase inhibitor 1A and 2A (CDKN1A and CDKN2A).16 If cells did not have robust expression of any markers, cells were considered unassigned.
2.4 Differential and meta-analyses
To account for changes within datasets, each dataset was analyzed individually. Within each dataset, a two-tailed Student's t test and a permutation-based false discovery rate calculation were used for statistical evaluation of differentially abundant genes for each comparison. P values from each dataset were then combined using the mean of each dataset weighted for sample sizes, and a P < .05 was considered significant. This technique was selected as it allows for the combination of results from heterogeneous analyses directly. As P value-based combination loses the directionality of the expression patterns, fold change values for each dataset were then also combined using the mean of each dataset weighted for sample sizes. Genes not shared across datasets were given values of 1 for both P value and fold change calculations.
2.5 Pathway analysis and individual redox gene expression analysis
Significant genes (p value <0.05) and genes with a fold change greater or lower than 20% (ratio of at least −1.2 or 1.2) were selected for pathway analysis using Ingenuity Pathway Analysis (IPA) QIAGEN Bioinformatics (Redwood City, California) to map statistically significant genes to the pathways and biological processes. To explore key genes related to redox signaling, TPM values from all datasets were combined, and a Kruskal-Wallis nonparametric test followed by Dunnʼs post hoc test for multiple comparisons was performed using GraphPad Prism v9.1.0 (La Jolla, California) software. Significance was considered to be p < 0.05.
3 RESULTS
3.1 Cell type identification
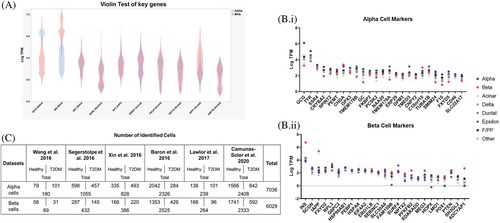
α- and β-cells were identified based on exclusive and robust expression of major hormone genes (GCG and INS). Expression levels of all the gene markers were rendered in a “violin plot” (Figure 1A), and if cells had conflicts with other expression markers, they were excluded. After cell types were assigned, 25 genes enriched in α- and β-cells were also evaluated.8 For α-cells, there was higher expression in α-cell markers, such as transthyretin (TTR) and signal sequence receptor subunit 4 (SSR4), compared to other cell types (Figure 1B.i). For β-cells, there was higher expression in β-cell markers, such as islet amyloid polypeptide (IAPP) and adenylate cyclase-activating polypeptide 1 (ADCYAP1), compared to other cells. (Figure 1B.ii). Overall, 7036 α-cells were identified (2.6% of the α-cells were from Wang et al, 15.0% from Segertolpe et al, 11.8% from Xin et al, 33.1% from Baron et al, 3.4% from Lawlor et al, and 34.2% from Camunas-Soler et al), and 6029 β-cells were identified (1.5% from Wang et al, 7.2% from Segertolpe et al, 6.4% from Xin et al, 41.9% from Baron et al, 4.4% from Lawlor et al, and 38.7% from Camunas-Soler et al) (Figure 1C).
3.2 α-cell gene expression profiles with T2DM
From the meta-analysis, 285 genes were differentially expressed in α-cells from T2DM donors among the six datasets. Significant genes were then analyzed in IPA. Top significant pathways (z score of <−1.5 or >1.5) and upstream regulators (z score <−2.25 or >2.25), and the top over- and underexpressed genes are listed in Table 2. Overall, α-cells from T2DM donors modified genes involved in energy regulation, autophagy, cell cycle, and xenobiotic metabolism. Additionally, several interleukins were induced in α-cells from T2DM donors, and several hormone signaling pathways were also upregulated, such as β-estradiol and, as expected, INS. The INS secretion signaling pathway was also induced in α-cells from T2DM donors. Of interest to the present study, NFE2L2 was also induced in α-cells from T2DM donors. Several of the top differentially expressed genes (DEGs) were related to energy metabolism, immunity, and peptide hormone metabolism.
| Top canonical pathways | |||||
|---|---|---|---|---|---|
| Name | z score | P value | Molecules | ||
| Inhibition of ARE-mediated mRNA degradation pathway | −2.000 | .0008 | CNOT7, PPM1L, PPP2R5C, PPP2R5E, PSMA4, PSMD14 | ||
| Sirtuin signaling pathway | −1.633 | <.0001 | ATP5F1B, BAX, GABARAPL1, NDUFA1, NDUFA11, NDUFA13, NDUFB1, NDUFV2, SDHC | ||
| EIF2 signaling | 1.633 | <.0001 | ACTB, ATF4, EIF3E, EIF3K, EIF4G2, FAU, RPL12, RPL15, RPL39, RPL4, RPL5, RPS10, RPS2, RPS26, RPS27 | ||
| Autophagy | 1.897 | .0008 | ATF4, ATM, BIRC6, CALM1, GABARAPL1, GCG, LAMP2, MAPK10, MYD88, PPM1L, PPP2R5C, PPP2R5E | ||
| Reelin signaling in neurons | 2.000 | .0060 | ARHGEF12, ARPC1B, ARPC2, MAPK10 | ||
| Gluconeogenesis I | 2.236 | <.0001 | ALDOA, ENO1, ENO2, GPI, MDH2 | ||
| Insulin secretion signaling pathway | 2.333 | .0022 | ABCC8, ATF4, CPE, BP2, EIF4G2, GCG, GPAA1, NEUROD1, PK2, PDIA3 | ||
| Glycolysis I | 2.449 | <.0001 | ALDOA, ENO1, ENO2, GPI, PFKP, PKM | ||
| Xenobiotic metabolism PXR signaling pathway | 2.449 | .0240 | ALDH2, ALDH9A1, CITED2, ESD, GSTO2, PPM1A | ||
| Xenobiotic metabolism CAR signaling pathway | 2.646 | .0081 | ALDH2, ALDH9A1, CITED2, GSTO2, PPM1L, PPP2R5C, PPP2R5E | ||
| Oxidative phosphorylation | 3.162 | <.0001 | ATP5F1B, COX4I1, COX5B, COX7A1, COX8A, NDUFA1, NDUFA11, NDUFA13, NDUFB1, NDUFV2, SDHC | ||
| Top upstream regulators | |||||
|---|---|---|---|---|---|
| Upstream regulator | Name or molecule type | z score | Molecules | ||
| RICTOR | Rapamycin-insensitive companion of MTOR | −2.848 | ATP5F1B, BAX, COX4I1, COX7A1, COX8A, ENO2, FAU, NDUFA1, NDUFA11, NDUFC1, NDUFC2, NDUFV2, PSMA4, PSMD14, RPL12, RPL4, RPS10, RPS2, RPS26, SDHC | ||
| CLPP | Caseinolytic mitochondrial matrix peptidase proteolytic subunit | −2.646 | ACADVL, ALDH2, ALDOA, ATP5F1B, ENO1, HSPD1, MDH2, SDHC | ||
| TRAP1 | TNF receptor-associated protein 1 | −2.433 | AK3, COX5B, COX8A, HSPD1, NDUFA11, PKM | ||
| miR-155-5p | miRNAs w/seed UAAUGCU | −2.407 | MATR3, MYD88, MYO10, PICALM, SCAMP1, SO1 | ||
| NR4A1 | Nuclear receptor subfamily 4 group A member 1 | −2.335 | ALDOA, ATP5F1B, CD36, CTNND1, ENO1, ENO2, EPCAM, GPI, MDH2, NDUFA1, NEUROD1, PDIA3, RPE, SDHC | ||
| OSM | Oncostatin M | 2.252 | ABCC8, ADAM17, ANXA2, ARHGEF12, ASAH1, ATP9A, EPCAM, GFPT1, GRHPR, HLA-A, HLA-B, MYD88, MYH10, RAB4A, RNASE4, SERPINA1, SLC7A8, SNAPC3, SO1, SON | ||
| IL15 | Interleukin 15 | 2.255 | ALDOA, ATF4, ATM, CALM1 (includes others), CD46, ENO1, ENO2, GDI2, GPI, IL1R1, MACROH2A1, MYD88, OAZ1, PDIA3, PFKP, PKM, PRDX4, RPE, SO1 | ||
| Insulin | Hormone | 2.309 | ABCC8, ACAT1, ACOX1, ACTB, ALDOA, CCT4, CCT6A, CCT8, CD36, COX4I1, ENPP2, FKBP2, FTL, GCG, IGFBP2, LGALS3BP, MDH2, NDUFA1, OGT, PKM, PLIN3, PRDX6, PTPRN | ||
| IL13 | Interleukin 13 | 2.333 | ACADVL, ACOX1, BAX, CAPN2, CD36, ENPP2, IL1R1, PCM1, PFKP, PITRM1, RIN2, SERPINA1, SO1, | ||
| CD3 | Cluster of differentiation 3 | 2.335 | ATF4, ATM, CALM1 (includes others), COX7A1, FKBP2, FTL, GDI2, HUWE1, IL1R1, MACROH2A1, MDH2, NKTR, OAZ1, PRDX4, RAD23B, SCGN, SNRPB, SNRPN, SO1 | ||
| TP73 | Tumor protein P73 | 2.382 | ADAM17, ATM, BAX, COX4I1, LAPTM4A, SERPINA1 | ||
| IL5 | Interleukin 5 | 2.383 | AK3, ALDOA, ANXA2, ATF4, CITED2, ELL2, ENO1, GCLM, HEPACAM2, MYADM, PDIA6, PFKP, PKM, PRDX4, SO1 | ||
| SP1 | Sp1 transcription factor | 2.412 | ABCC8, ATM, ATP2A3, ATP5F1B, BAX, CD99, CITED2, FDX1, PKM, BP1, SNRPN, SO1 | ||
| HSF1 | Heat shock transcription factor 1 | 2.425 | BAX, CCT4, CCT6A, CCT8, CD36, DNAJA1, HSPD1, BP1, GAP1 | ||
| Ige | Immunoglobulin E | 2.449 | CAPN2, DUSP3, EIF4G2, ENO2, FXYD6, HSPD1, SO1 | ||
| TCF7L2 | Transcription factor 7-like 2 | 2.522 | ASPH, CPD, CREB3L2, ENPP2, EPCAM, GCG, GCLM, IGFBP2, PICALM, REEP3, RNASE4 | ||
| F2 | Coagulation factor II, thrombin | 2.630 | ADAM17, ATM, BAX, EPCAM, GCH1, GCLM, GLB1, HSPD1, IL1R1, LAMP2, SO1 | ||
| NFE2L2 | Nuclear factor erythroid 2-related factor 2 | 2.632 | ACTG1, ALDOA, ATF4, CD36, CHGB, COX4I1, EIF3E, EIF4G2, ESD, FTL, GCLM, M6PR, MAPK10, NEUROD1, OGT, PDIA3, PDIA6, PFN2, PSMA4, PSMD14, SHMT2, SLC7A8 | ||
| CAB39L | Calcium-binding protein 39 like | 2.646 | COX4I1, COX5B, COX8A, NDUFA1, NDUFA13, NDUFC1, NDUFV2 | ||
| β-estradiol | Hormone | 2.711 | ABCC8, ACADVL, ACOX1, ACTB, ACTG1, ALDH2, ALDOA, ANKRD12, ANXA2, ARHGEF12, ARPC1B, ASAH1, ATM, ATP5F1B, BAX, CALM1, CAPN2, CDC42BPA, CHGB, CITED2, CTNND1, DUSP3, ENO1, ENPP2, EPB41L3, FUCA1, GCH1, GDI2, GLB1, HLA-A, HSPD1, IGFBP2, IL1R1, KAT6A, LAMP2, LGALS3BP, MAPK10, MYH10, MYH9, MYO10, MYO1B, OAZ1, PDIA3, PKM, PNRC2, PPT1, PRDX4, PTPRN, BP1, RPN2, SCG5, SCGB2A1, SERPINA1, SLC35F3, SLC7A8, SO1 | ||
| PGR | Progesterone receptor | 2.740 | ACOX1, AK3, CAPN2, CD36, CDC42BPA, CREB3L2, DST, ELL2, HSPB11, IL1R1, MYO10, PFKP, PFN2, SERPINA1, SIK3 | ||
| IL4 | Interleukin 4 | 2.827 | ACOX1, ACTB, ACTG1, ADAM17, ALDH2, ANXA2, BAX, CD36, CITED2, CLTC, DYNC1H1, HNRNPH3, IL1R1, KIF3A, LAMP2, LGALS3BP, MYH9, NAP1L1, PFKP, PKM, SNRNP200, SO1, SON | ||
| IL6 | Interleukin 6 | 3.019 | ACOX1, BAX, CD36, CD46, COX4I1, ENO2, ENPP2, GCG, GCH1, HLA-A, IL1R1, MYD88, PCLAF, SERPINA1, SO1 | ||
| XBP1 | X-box-binding protein 1 | 3.113 | ARCN1, ATF4, FKBP2, PDIA3, PDIA6, PGM3, PTPRN, RAB33B, RPN2, SEC63, SERPINA1 | ||
| AGT | Angiotensinogen | 3.423 | ACTB, ADAM17, ATP6AP2, BAX, CD36, COX4I1, COX7A1, CPE, FDX1, GCH1, GFPT1, GPC6, IGFBP2, LAMP2, MYH10, SO1 | ||
| Top underexpressed genes | Top overexpressed genes | ||||
|---|---|---|---|---|---|
| Gene symbol | Fold change | P value | Gene symbol | Fold change | P value |
| ASAH1 | −1.91 | .0223 | SLC30A8 | 5.25 | .0463 |
| ATF4 | −1.76 | .0233 | RNASE4 | 5.22 | .0307 |
| SLC35A4 | −1.71 | .0235 | AGPAT2 | 4.08 | .0204 |
| FTL | −1.70 | .0324 | IVNS1ABP | 3.92 | .0468 |
| SHMT2 | −1.69 | .0473 | PPP2R3C | 3.89 | .0459 |
3.3 Proliferating α-cell gene expression profiles
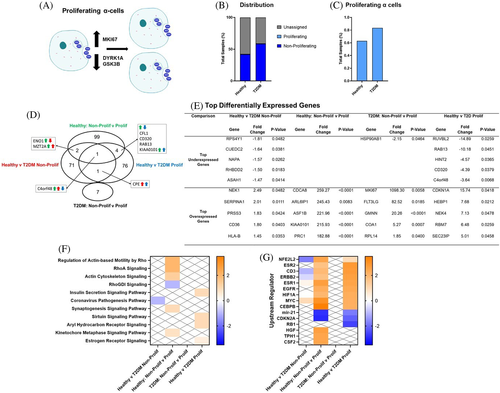
Forty-nine proliferating α-cells were identified from the pooled dataset by exclusive and robust expression of MKI67 vs DYRK1A and GSK3B, and if none of the target genes were detected, the α-cell was considered unassigned (Figure 2A). A greater percentage of α-cells from healthy donors (57.59%) were unassigned as compared to α-cells from T2DM donors (40.69%), and less than 1% of α-cells were identified as proliferating in the pooled dataset (Figure 2B). Although not significant, the portion of proliferating α-cells from T2DM donors (0.83%) was greater than proliferating α-cells from healthy donors (0.63%) (Figure 2C). There were 75 DEGs in nonproliferating α-cells from T2DM donors, and there were 82 DEGs in proliferating α-cells from T2DM donors (Figure 2D). Carboxypeptidase E (CPE) and neuropeptide-like protein (C4orf48) were the only common DEGs in proliferating and nonproliferating α-cells from T2DM donors and are involved in the biosynthesis of neuropeptides and peptide hormones. There were 106 DEGs in proliferating vs nonproliferating α-cells from healthy donors, and 7 DEGs from T2DM donors. Top DEGs are listed in Figure 2E. In proliferating vs nonproliferating α-cells from T2DM donors, top overexpressed genes included MKI67, a proliferation marker. Most of the top overexpressed genes in proliferating vs nonproliferating α-cells from both healthy and T2DM donors are related to cell division, such as cell division cycle associated 8 (CDCA8). In the pathway analysis (Figure 2F), nonproliferating α-cells from T2DM vs healthy donors repressed the coronavirus pathogenesis pathway. Proliferating α-cells from T2DM vs healthy donors induced the INS secretion signaling pathway and sirtuin signaling pathway similar to results in Table 2. In proliferating α-cells from healthy donors, many of the modulated pathways were related to cell replication, Rho signaling, and in the upstream regulator analysis (Figure 2G), several regulators related to cell proliferation were upregulated, such as proto-oncogene, BHLH transcription factor (MYC). As expected, since the estrogen receptor signaling pathway is induced in proliferating vs nonproliferating α-cells from healthy donors, many of the upstream regulators are related to estrogen signaling. NFE2L2 signaling was induced in proliferating α-cells from healthy donors. In nonproliferating α-cells from T2DM donors, NFE2L2 signaling was repressed; however, in proliferating α-cells from T2DM vs healthy donors, NFE2L2 signaling was induced.
3.4 β-cell gene expression profiles with T2DM
From our meta-analysis, 286 genes were differentially expressed in β-cells from T2DM donors among the six datasets. Significant genes were then analyzed in IPA, and top significant pathways (z score of <−1.5 or >1.5) and upstream regulators (z score <−2.25 or >2.25), and the top over and underexpressed genes are listed in Table 3. Overall, β-cells from T2DM donors modified genes involved in pathways involved in energy regulation, autophagy, cell cycle, and hormone signaling pathways. As expected with T2DM, the INS secretion signaling pathway was also induced in β-cells from T2DM donors. Again, of interest to the present study, NFE2L2 was induced in β-cells from T2DM donors. Top underexpressed genes include several proteins involved in protein metabolism. IAPP, a β-cell hormone that acts as a satiation signal, is underexpressed in β-cells from T2DM donors. Top overexpressed genes also included SIX homeobox 3 (SIX3). SIX3 represses Wnt activity and activates the sonic hedgehog gene (SHH), and both pathways are involved in β-cell proliferation and differentiation.34-36
| Top canonical pathways | |||||
|---|---|---|---|---|---|
| Name | z score | P value | Molecules | ||
| Coronavirus pathogenesis pathway | −2.530 | <.0001 | AGT, CDK4, NUP98, RPS15, RPS2, RPS23, RPS27A, RPS28, RPS3A, RPS4X | ||
| Protein kinase A signaling | 1.508 | .0186 | ANAPC13, CALM1 (includes others), CHP1, GNAS, GNB1, MYH10, PRKACB, PRKAR1B, PTEN, PTPRF, SMPDL3A | ||
| Gluconeogenesis I | 2.000 | <.0001 | ENO1, ENO2, GAPDH, MDH1 | ||
| TCA cycle II (eukaryotic) | 2.000 | .0032 | DLD, IDH3G, MDH1, SDHC | ||
| Actin cytoskeleton signaling | 2.000 | .0051 | CRKL, ITGAV, MYH10, PFN2, RAC1 | ||
| Androgen signaling | 2.000 | .0132 | CALM1 (includes others), GNAS, GNB1, GTF2E2, HSP90AA1, POLR2L, PRKACB, PRKAR1B | ||
| Oxidative phosphorylation | 2.236 | <.0001 | ATPAF1, COX7A2, NDUFA10, NDUFA13, NDUFB10, NDUFB11 SDHC | ||
| Cardiac hypertrophy signaling | 2.449 | .0182 | CALM1 (includes others), CHP1, GNAS, GNB1, PRKACB, PRKAR1B, RAC1 | ||
| Dopamine-DARPP32 feedback in cAMP signaling | 2.646 | .0079 | ATP2A3, CALM1 (includes others), CHP1, CSNK1A1, GNAS, PPP2R5C, PRKACB, PRKAR1B | ||
| Estrogen receptor signaling | 2.714 | <.0001 | AGT, CCNC, CTBP1, DDX5, GNAS, GNB1, HSP90AA1, NDUFA10, NDUFA13, NDUFB10, NDUFB11, NR3C1, PRKACB, PRKAR1B, PTEN, SDHC | ||
| EIF2 signaling | 3.000 | <.0001 | EIF1AX, EIF3A, EIF3E, EIF3H, HNRNPA1, RPL11, RPL17, RPL18, RPL18A, RPL26L1, RPL35A, RPL36, RPL37A, RPL38, RPL39, RPL4, RPS15, RPS2, RPS23, RPS27A, RPS28, RPS3A, RPS4X | ||
| Autophagy | 3.000 | .0005 | CALM1 (includes others), CHP1, GABARAPL1, GABARAPL2, PPP2R5C, PRKACB, PRKAR1B, PTEN, SESN1 | ||
| Synaptogenesis signaling pathway | 3.051 | .0015 | AP2M1, CADM1, CALM1 (includes others), CDH1, CHN1, CRKL, HSPA8, NAP1L1, NRXN1, NSF, PRKACB, PRKAR1B, RAC1, RASGRF1 | ||
| Insulin secretion signaling pathway | 3.162 | .0110 | CLCN3, CPE, DLD, GNAS, NSF, PCSK1, PCSK2, PDX1, PRKACB, PRKAR1B | ||
| Top upstream regulators | |||||
|---|---|---|---|---|---|
| Upstream regulator | Name or molecule type | z score | Molecules | ||
| LARP1 | La ribonucleoprotein 1, translational regulator | −4.472 | EIF3A, EIF3E, EIF3H, EIF4B, HNRNPA1, RPL11, RPL17, RPL18, RPL35A, RPL36, RPL37A, RPL38, RPL39, RPL4, RPS15, RPS2, RPS23, RPS27A, RPS28, RPS3A, RPS4X | ||
| NR4A1 | Nuclear receptor subfamily 4 group A member 1 | −3.000 | ACLY, COX7A2, DLD, ENO1, ENO2, EPCAM, MDH1, NDUFA10, NUCB2, PDX1, PEBP1, RAP1GAP2, SDHC, SPINT2 | ||
| mir-21 | miRNA | −2.702 | CACYBP, CCT8, CDH1, GPBP1, NUCKS1, PDCD4, PTEN, SESN1 | ||
| SNAI1 | Snail family transcriptional repressor 1 | −2.588 | CD46, CDH1, CDK4, EPCAM, MLXIPL, PEBP1, PTEN | ||
| RICTOR | Rapamycin-insensitive companion of MTOR | −2.559 | ATP6V0E2, ATP6V1D, ATP6V1H, COX7A2, ENO2, NDUFA10, NDUFB10, PSMC3, PSMD11, PSMD12, PTEN, RAC1, RPL11, RPL17, RPL18, RPL35A, RPL38, RPL4, RPS15, RPS2, RPS23, RPS27A, SDHC | ||
| KDM5A | Lysine-specific demethylase 5A | −2.449 | ATP6V1D, COX7A2, MDH1, NDUFA10, NDUFA13, NDUFB10, SDHC | ||
| MIR17HG | MiR-17-92a-1 cluster host gene | −2.39 | APP, CPE, ECE1, IL6ST, NCSTN, PTEN | ||
| NFE2L2 | Nuclear factor erythroid 2-related factor 2 | 2.276 | AGT, CCT7, CDH1, DNAJB11, DYNLL1, EIF3E, HSP90AA1, KEAP1, MORF4L2, NUCB2, PFN2, PSMC3, PSMD11, PSMD12, RBBP7, RPL18, SEC23A, SERINC3 | ||
| FOS | Fructooligosaccharides | 2.333 | AGT, CADM1, CDH1, CTSB, ENO1, HLA-B, NAE1, NPTX2, NR3C1, PIAS1, PLAGL1, PTS, RBBP7, RPL39 | ||
| Lh | Luteinizing hormone | 2.530 | ARL6IP5, CSNK1A1, EIF3H, GNAS, GNB1, POP5, PPP2R5C, PTPRF, RPL17, RPL18A, RPL35A, RPL39, RPS15, RPS2, RPS23, RPS28 | ||
| PTEN | Phosphatase and tensin homolog | 2.583 | ACAA2, CCNC, CDH1, CDK4, CLTC, CTSB, CYP27A1, DLD, GAPDH, HMGN1, IDH3G, MDH1, NR3C1, PDCD4, PTEN, PTPRF, RBBP6, SEC23A, SERINC3, SFTPA1, SNX2 | ||
| ESR1 | Estrogen receptor 1 | 2.72 | ACLY, AGT, ALCAM, AP3B1, ARL4D, ATP2A3, ATP6V1H, CCNC, CDH1, CDK4, CLCN3, COPS2, CPE, CRKL, CSNK1A1, CTSB, DDX17, DST, ENO1, EPCAM, GNAS, GNB1, GYG1, HLA-B, HSP90AA1, HSPA13, HSPH1, IL6ST, MAP2, MYH10, NDUFB10, PCM1, PCSK1, PDCD4, PFN2, PGRMC2, PIAS1, PPP2R5C, PRKACB, PRSS23, PTEN, RBP4, RPL18A, RPL38, SCAMP1, SEC31A, SESN1, SMC3, SOCS2 | ||
| IL5 | Interleukin 5 | 2.813 | ACAA2, AK3, ANXA6, ENO1, HSPH1, ITGAV, RAB21, SOCS2 | ||
| CD3 | Cluster of differentiation 3 | 2.892 | CALM1 (includes others), CDK4, CLK1, GABARAPL2, GAPDH, GDI2, GNAS, HMGN1, HNRNPA1, HNRNPR, HSP90AA1, HSPA8, PSAP, PSMD12, PTEN, RPL35A, RPS3A, S100A11, SNRPN, SOCS2, SORL1 | ||
| PPARG | Peroxisome proliferator-activated receptor gamma | 2.934 | ACAA2, ACLY, AGT, APP, ARL4D, ATP6V1D, CDH1, ENO2, GABARAPL2, GAPDH, KEAP1, LAPTM4A, MAP2, MDH1, NSF, PDX1, PEPD, PTEN, PTPRF, RBP4, SCP2, SHISA5 | ||
| CEBPB | CCAAT enhancer-binding protein β | 3.072 | AGT, APP, CDK4, CIRBP, DDX5, GNAS, HSP90AA1, HSPA8, LGMN, RBBP7, SFTPA1, SMC3 | ||
| β-estradiol | Hormone | 3.302 | ACAA2, AGT, ALCAM, ANKRD12, AP3B2, APP, CALM1 (includes others), CDH1, CLCN3, CTSB, DDR1, DDX17, DSP, DYNLL1, EIF3A, ENO1, GDI2, GNB1, GYG1, HNRNPA1, HSPA8, HSPH1, IL6ST, ITGAV, LGMN, MBTPS1, MYH10, NR3C1, NUCB2, PDCD4, PGRMC2, PLAGL1, PRSS23, PSAP, PSMC3, PTEN, RAC1, RASGRF1, RBBP7, RBM39, RBP4, RPL17, S100A11, SCG5, SET, SIX3, SMPDL3A, SOCS2, SPINT2 | ||
| MYC | MYC proto-oncogene, BHLH transcription factor | 3.426 | ACLY, ALCAM, ANXA6, APP, CDH1, CDK4, CHP1, CPD, CTSB, DDX5, DSP, ENO1, EPCAM, GAPDH, GDI2, HLA-B, HNRNPA1, HNRNPH1, HNRNPU, HSP90AA1, HSPH1, ITM2B, LGMN, NAP1L1, PDCD4, PEX19, PIAS1, PRKACB, PTEN, RBBP7, RPL11, RPL17, RPL18, RPL18A, RPL35A, RPL37A, RPL38, RPL39, RPL4, RPS15, RPS2, RPS23, RPS27A, RPS28, SCAMP1, SERINC3, SNRPN | ||
| MYCN | MYCN proto-oncogene, BHLH transcription factor | 3.769 | GAPDH, PGRMC2, POLR2L, RBBP7, RPL11, RPL17, RPL18, RPL18A, RPL35A, RPL37A, RPL38, RPL39, RPL4, RPS15, RPS2, RPS23, RPS27A, RPS28, RPS3A, RPS4X | ||
| MLXIPL | MLX interacting protein like | 3.954 | ACLY, MLXIPL, RPL11, RPL17, RPL18, RPL18A, RPL35A, RPL37A, RPL38, RPL39, RPL4, RPS15, RPS2, RPS23, RPS27A, RPS28 | ||
| Top underexpressed genes | Top overexpressed genes | ||||
|---|---|---|---|---|---|
| Gene symbol | Fold change | P value | Gene symbol | Fold change | P value |
| PPP1R1A | −3.24 | .0144 | SIX3 | 18.93 | 0.0153 |
| DNAJB11 | −1.92 | .0218 | SFTPA1 | 15.08 | 0.0368 |
| PSMC3 | −1.63 | .0400 | ARL4D | 6.34 | 0.0497 |
| IAPP | −1.62 | .0179 | HLA-B | 5.89 | 0.0017 |
| ANAPC13 | −1.53 | .0270 | CADM1 | 5.52 | 0.0146 |
3.5 Gene expression profiles of immature β-cells
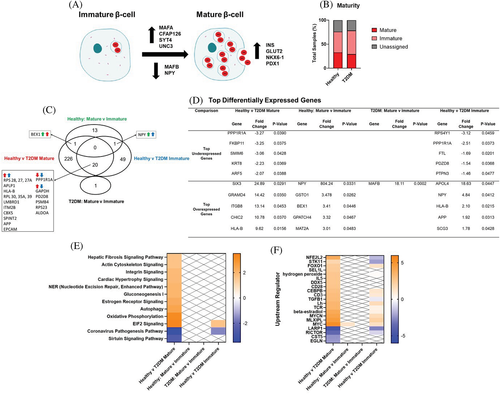
A total of 2698 immature β-cells were identified from the pooled dataset by exclusive and robust expression of markers of immaturity, MAFB and/or NPY vs markers for mature β-cells (MAFA, SYT4, NKX6-1, UNC3, PDX-1, SLC2A2) (Figure 3A).16 The portion of immature β-cells from T2DM donors (49.1%) was greater than immature β-cells from healthy donors (43.2%) (Figure 3B). There were 247 DEGs in mature β-cells from T2DM vs healthy donors, and there were 70 DEGs in immature β-cells from T2DM vs healthy donors (Figure 3C). There were 20 common DEGs in both mature and immature β-cells from T2DM vs healthy donors; however, 5 of those genes were induced in mature but decreased in immature β-cells from T2DM donors. In healthy donors, there were 15 DEGs in immature vs mature β-cells, and in T2DM donors, there was 1 DEG in immature vs mature β-cells. NPY, a marker of β-cell immaturity, was overexpressed in mature vs immature β-cells in healthy donors; interestingly, NPY was also overexpressed in immature β-cells from T2DM vs healthy donors (Figure 3D). Similarly, brain-expressed X-linked 1 (BEX1), a top overexpressed gene in immature vs mature β-cells from healthy donors, was also induced in immature β-cells from T2DM vs healthy donors. Another top overexpressed gene in immature vs mature β-cells in healthy donors was glutathione S-transferase omega 1 (GSTO1), a NFE2L2 target gene that activates NF-κB.37 The only DEG in immature vs mature β-cells from T2DM donors was MAFB, the other maker of β-cell immaturity. In the pathway analysis, as expected, mature and immature β-cells from T2DM vs healthy donors had modified genes involved in energy regulation, hormone signaling pathways, and autophagy pathways (Figure 3E,F). There were no pathway changes in mature vs immature β-cells. However, in the upstream regulator analysis, NFE2L2 signaling and STK11 (serine threonine kinase 11), a tumor suppressor, was activated in mature β-cells but downregulated in immature β-cells from T2DM donors. In immature vs mature β-cells from healthy donors, MYC signaling is induced.38
3.6 Gene expression profiles of senescent β-cells
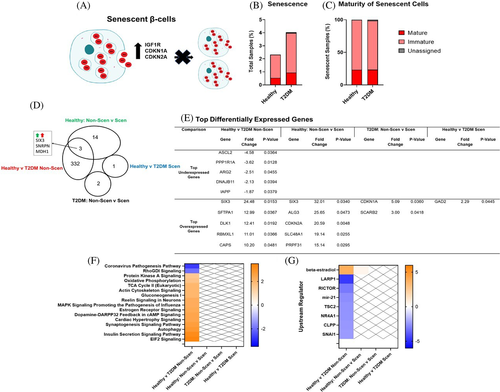
A total of 167 senescent β-cells were identified from the pooled dataset by robust expression of senescent markers IGF1R, CDKN1A, and CDKN2A16 (Figure 4A). A greater percentage of β-cells from T2DM donors (4.04%) were defined as senescent as compared to β-cells from healthy donors (2.32%) (Figure 4B), and the majority of senescent β-cells were also considered immature (Figure 4C). There were 335 DEGs in non-senescent β-cells from T2DM vs healthy donors, and there was 1 DEG in senescent β-cells from T2DM vs healthy donors. In healthy donors, there were 17 DEGs in senescent vs non-senescent β-cells, and there were 2 DEGs in senescent β-cells from T2DM donors. The only DEG in senescent β-cells from T2DM vs healthy donors was glutamate decarboxylase 2 (GAD2), a known autoantigen in INS-dependent diabetes (Figure 3D). Additionally, SIX3 is one of the top overexpressed genes in senescent vs non-senescent β-cells from healthy donors and in non-senescent β-cells from T2DM vs healthy donors. In the pathway and upstream regulator analysis, only non-senescent β-cells from T2DM vs healthy sample had significant pathways changes (Figure 4F,G). As expected, both the mature and immature β-cells from T2DM vs healthy donors modified genes involved in energy regulation, hormone signaling pathways, and autophagy pathways.
3.7 T2DM activated the NFE2L2 pathway in immature and senescent β-cells
A common upstream regulator that was significantly induced with T2DM was NFE2L2 (Tables 2 and 3). To further evaluate this pathway in relationship to cell dysfunction, several NFE2L2 gene targets were evaluated in α- and β-cells. Proliferating α-cells had minimal changes in selected NFE2L2 gene targets (Figure S1A). Mature β-cells from T2DM donors had increased expression of NFE2L2 by 1.5-fold compared to healthy donors (Figure 5A.i). Immature β-cells from T2DM donors had increased expression of NFE2L2, glutathione S-transferase α-4 (GSTA4), glutathione S-transferase Mu 3 (GSTM3), glutamate-cysteine ligase catalytic subunit (GCLC), glutamate-cysteine ligase modifier subunit (GCLM), cytochrome P450 2R1 (CYP2R1), and solute carrier family 35 member A4 (SLC35A4) by 1.3 to 2.6-fold compared to healthy donors (Figure 5A). In healthy donors, expression of NFE2L2, KEAP1, NAD(P)H quinone dehydrogenase 1 (NQO1), GSTA4, and GSTM3 was induced by 1.3 to 2.7-fold in immature β-cells compared to mature β-cells. However, in the T2DM donors, expression of all the NFE2L2 gene targets evaluated (NFE2L2, KEAP1, NQO1, GSTA4, GSTM3, GCLC, GCLM, CYP2R1, and SLC35A2) was induced by 1.1 to 2.7-fold in immature β-cells vs mature β-cells.
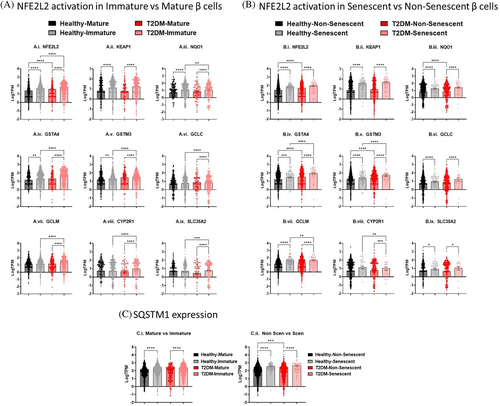
Non-senescent β-cells from T2DM donors had increased expression of NFE2L2, GSTA4, and GSTM3 by 1.8, 1.8, and 1.3-fold, respectively (Figure 5B). Senescent β-cells from the T2DM samples had increased expression of NFE2L2, KEAP1, NQO1, GSTA4, GSTM3, and GCLC; however, the trends were not significant. In healthy and T2DM donors, expression of all the NFE2L2 gene targets (NFE2L2, KEAP1, NQO1, GSTA4, GSTM3, GCLC, GCLM, CYP2R1, and SLC35A2) was induced in senescent β-cells compared to non-senescent β-cells by 1.7 to 5.3-fold.
In addition to the canonical KEAP1 pathway, NFE2L2 can also be activated in a SQSTM1-KEAP1-dependent manner during autophagy dysregulation.31 SQSTM1 expression is increased by 61.8% and 84.4% in the immature β-cells (Figure 5C.i) and 100.4% and 130.0% in senescent β-cells (Figure 5C.ii) in the healthy and T2DM donors, respectively. Only in the non-senescent β-cells was there a 3% increase in SQSTM1 expression in β-cells from T2DM donors compared to healthy donors.
4 DISCUSSION
The development of sc-RNA-Seq techniques has allowed for the high-throughput profiling of transcriptomes across cell types and subpopulations of cells and has facilitated understanding of cellular responses to disease.39 In the present study, a meta-analysis of six sc-RNA-Seq studies from human pancreatic islets was conducted to evaluate the NFE2L2 and redox signaling in α- and β-cells from T2DM vs healthy donors. The transcriptomes of 7036 α-cells and 6029 β-cells were identified and evaluated, and subpopulations of proliferating α-cells, immature, and senescent β-cells were also identified and evaluated.
The modified genes in α-cells from T2DM donors are involved in energy regulation, immune response, xenobiotic metabolism, hormone signaling, and autophagy pathways. In T2DM, α-cells can transdifferentiate to β-cells under an extreme demand for INS,14 and although not specifically evaluated, an increase in the INS secretion signaling pathway was observed in α-cells from T2DM donors. Forty-nine proliferating α-cells were identified, which represented ~0.7% of identified α-cells. This small percentage is expected as α-cells proliferate at very low levels.9 As the number of proliferating α-cells was incredibly small, and due to uneven distribution across the datasets, several dataset comparisons were excluded in the meta-analysis when a dataset had only one or no proliferating α-cells. Although the percentage of proliferating α-cells increased in T2DM donors, the trend was not significant (Figure 2C). Previous work has found that IL6, an inflammatory cytokine elevated in T2DM,40 stimulates α-cell proliferation.13 Interestingly, in α-cells from T2DM donors, several cytokines, including IL6, IL4, IL5, IL13, and IL15, were identified as upstream regulators. Constant with Wang et al,9 transcriptomic analysis of proliferating α-cells found modifications in cell cycle pathways. NFE2L2 activation in proliferating α-cells was limited.
Similar to previous sc-RNA-Seq studies, β-cells from T2DM donors have been found to have altered β-cell immune response, cell cycle pathways, energy metabolism, and autophagy pathways.9-12 The most induced pathway in β-cells from T2DM donors was the INS secretion signaling pathway. In T2DM, there is an increased demand for INS; the increased production of INS in overworked β-cells leads to excessive glucose metabolism and oxidative phosphorylation that increases the generation of ROS.41 There is also an increase of the unfolding or misfolding of proteins in the ER, leading to ER stress.42 Oxidative and ER stress can cause apoptotic cell death, which may cause the reduction in β-cell mass that is observed in T2DM.41-43 As observed herein, pathways and upstream regulators related to apoptosis are induced in β-cells from T2DM donors and include NFE2L2, the master regulator of the antioxidant response. After evaluating the transcriptomes of β-cells from T2DM donors, 2698 immature and 167 senescent β-cells were identified.
β-cells exist in a balance of immature cells and INS-producing mature cells, where the immature cells are thought to reflect proliferative capacity.16, 19 Here, the portion of immature β-cells in T2DM donors was greater than immature β-cells from healthy donors, which is supported by the increase in β-cell proliferation with INS resistance related to obesity.22 Immature β-cells were defined as an increase in MAFB and/or NPY. Interestingly, NPY was also increased in immature β-cells from T2DM samples vs healthy samples. NPY is a counter-regulator of β-cell INS secretion, and overexpression of NPY in rats has been described to impair INS secretion when fed a high-fat diet.44, 45 In T2DM, there is also an increase in β-cell senescence.46 Here, a greater percentage of β-cells from T2DM donors were defined as senescent as compared to healthy donors, as defined by expression of senescent markers IGF1R, CDKN1A, and CDKN2A. Remarkably, the majority of senescent β-cells were also considered immature, thus suggesting that senescent β-cells have an increase in either MAFB or NYP expression vs other markers of mature β-cells. SIX3, which represses Wnt activity and activates the SHH,35 was identified as top overexpressed gene in β-cells from T2DM donors, and SIX3 was also one of the top overexpressed genes in senescent vs non-senescent β-cells. SIX3 has been identified as a transcription factor that governs functional β-cell maturation and may be a potential target for β-cell dysfunction in T2DM.47
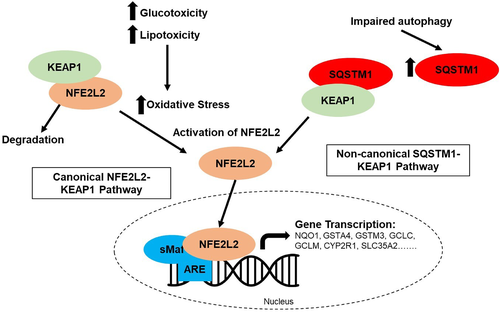
As outlined in Figure 6, lipotoxicity and glucotoxicity associated with T2DM increase oxidative stress and can increase NFE2L2 activation. As expected, α- and β-cells from T2DM donors have increased NFE2L2 activation. Here, NFE2L2 is also activated in immature and senescent β-cells. Immature β-cells have reduced INS secretion and increased proliferation, and NFE2L2 activation is related to both. Exposure of isolated mouse islets or INS-1 cells to oxidative stressors has been described to decrease glucose-stimulated INS secretion,48 and upregulation of NFE2L2 expression increases proliferation of rat INS-1 cells and primary mouse and human β-cells.49, 50 Oxidative damage can also damage β-cells, and NFE2L2 was activated in senescent β-cells as well. The pathways analysis demonstrated modified autophagy pathways in cells from T2DM donors, and NFE2L2 activation in β-cells may also occur through the noncanonical SQSTM1-KEAP1 pathway. Here, SQSTM1 expression was increased in immature and senescent β-cells. This suggests that NFE2L2 activation in β-cells is likely due to multiple pathways.
In conclusion, this transcriptomic meta-analysis provides detailed information about β-cell damage in patients with T2DM. These analyses demonstrate the power of sc-RNA-Seq data to detect transcriptional alterations in subpopulations of α- and β-cells. Although the ability to directly relate the changes of the transcriptome to functional impairments in disease is limited, this analysis provides several hypotheses to understand the effect of T2DM on the α- and β-cells of the pancreas. This study also provides evidence that NFE2L2 activation plays a role in β-cell maturation and dysfunction; redox singling may be a key pathway to target for β-cell restoration and T2DM treatments.
ACKNOWLEDGEMENTS
This work was supported by the National Institute of Health, grant number 5R01ES025748-05 (to A.R.T.-L.). We are grateful to Dr Angela L. Slitt and her laboratory from the University of Rhode Island for providing access to the IPA software purchased from the National Institutes of Health under grant number P42ES027706. The funders had no role in study design, data collection and analysis, decision to publish, or preparation of the manuscript.
DISCLOSURE
The authors have no conflicts of interest, financial or otherwise, to report.


