COVID-19 in the United States: Where are we now? Where have we been?
美国的COVID-19:我们现在怎么样?我们经历了什么?
Coronavirus infectious disease 2019 (COVID-19) was identified in Wuhan, China, in late 2019, and the first case in the United States, a traveler who had returned from Wuhan, was confirmed in late January 2020. The US restricted air travel and declared a public health emergency in the beginning of February, terming this a national emergency in March, allowing federal funding, which was rapidly increased by the end of March, along with offering telemedicine for healthcare.1 Tallies of case numbers tell the story: rapid increase to about 30 000 cases per day from the end of March to early April, stabilizing at this level until mid-June, then increasing to more than 60 000 cases per day by July, dipping back to 40 000 at the end of August, but then again increasing to the current level of more than 120 000 cases per day.2 Individual states showed different patterns: In New York and New Jersey, peaks of 10 000 and 4000 per day in April, decreasing to below 1000 at the end of the month, while in Florida, Texas, and California peaks of 10 000 to 15 000 per day were seen towards the end of July, only decreasing by September, and still remaining at 3000 to 5000 per day. As of this writing, there have been nearly 10 000,000 cases in the US, and nearly 240 000 deaths.3
Death rates tell the story of the toll of the disease. By tracking weekly death rates in the US over past years, the number of excess deaths with COVID-19 can be calculated. Deaths involving COVID-19 began to increase in the beginning of April, peaking over 16 000 per week at the end of April, decreasing at the end of June, then peaking at 8000 deaths per week at the end of July, with levels decreasing again but still remaining at 4000 per week.4
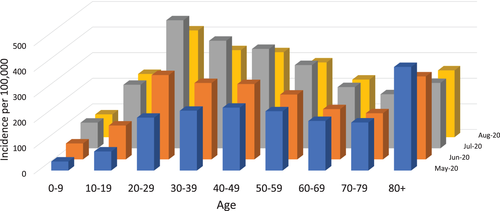
The difference of progressively increasing numbers of reported cases but decreasing death rates, although still terribly high, appears to be explained in part by different age distribution of COVID-19 cases over the months. In May the greatest numbers of cases were the very old, age 80 and over, but progressively in June, July, and August, the peak of cases was among those age 20 to 29.5 From the beginning of February through the end of October, under 100 deaths occurred in those below age 25 (Figure 1). After age 25, the percentage of COVID-19 deaths increased progressively. About 3% of deaths were in those age 25 to 34, 6% at age 35 to 44, and 8% to 10% in every decade thereafter—although the population size decreases as age goes up. Altogether, nearly one of every one hundred Americans age 85 and over died of COVID-19 or its complications during the past 9 months (Table 1).6

| Death with COVID | All deaths | Death with COVID + pneumonia | Population | Percent of deaths | Percent of population | |
|---|---|---|---|---|---|---|
| All ages | 212 328 | 2 330 395 | 96 557 | 328 239 523 | 9.1% | 0.06% |
| Under 1 year | 26 | 13 183 | 4 | 3 783 052 | 0.2% | 0.00% |
| 1-4 years | 15 | 2484 | 2 | 15 793 631 | 0.6% | 0.00% |
| 5-14 years | 39 | 3931 | 7 | 40 994 163 | 1.0% | 0.00% |
| 15-24 years | 388 | 25 319 | 138 | 42 687 510 | 1.5% | 0.00% |
| 25-34 years | 1649 | 51 694 | 733 | 45 940 321 | 3.2% | 0.00% |
| 35-44 years | 4262 | 73 042 | 1891 | 41 659 144 | 5.8% | 0.01% |
| 45-54 years | 11 252 | 133 461 | 5309 | 40 874 902 | 8.4% | 0.03% |
| 55-64 years | 27 034 | 305 504 | 13 281 | 42 448 537 | 8.8% | 0.06% |
| 65-74 years | 45 951 | 462 480 | 22 489 | 31 483 433 | 9.9% | 0.15% |
| 75-84 years | 56 409 | 562 807 | 26 484 | 15 969 872 | 10.0% | 0.35% |
| 85 years and over | 65 303 | 696 490 | 26 219 | 6 604 958 | 9.4% | 0.99% |
There were similar numbers of deaths among non-Hispanic whites, non-Hispanic blacks, and people of Hispanic ethnicity, but, calculated as percentages, minority populations showed double, triple, or even greater multiples in relative death rates, suggesting that these groups were adversely affected to a much greater extent. Similarly, deaths occurred to much greater extent among people with a history of coronary disease and among those with stroke, among those with hypertension, with diabetes, and, strikingly, among those with Alzheimer's disease, perhaps reflecting the tremendous excess of deaths occurring in residents of nursing homes and similar residential facilities.
Deaths occurred to a much greater extent in the early period of the epidemic, with more than 33 000 deaths among residents of New York and 16 000 among residents of New Jersey, particularly occurring during the period through April and early May, while a total of more than 17 000 residents of Florida, nearly 18 000 of California, and more than 19 000 of Texas died because of COVID-19, mostly occurring during later months. The decrease in New York from more than 700 to less than 20 deaths per day from April to the end of July was almost certainly brought about by “lockdown,” closing nonessential businesses, with many working from home, and with vigilance of wearing masks, maintaining physical distance, remaining in well-ventilated areas, as much as possible outdoors, and not gathering in large groups.7 The longest periods of lockdown, over 200 days, were in California, Nevada, Oregon, and Wisconsin, while New York and Illinois had 60- to 80-day periods, and Connecticut, Kansas, Massachusetts, and Michigan had lockdown periods of 20 to 40 days.8
COVID-19 has led to drastic changes in healthcare in the US. During the peak initial COVID period, visits to emergency rooms decreased 42%—and although some unnecessary visits were avoided, it cannot be a good thing that emergency rooms for myocardial infarction and for stroke decreased 23% and 20%, and those for diabetes decreased 10%.9 Outpatient visits decreased more than 20% from average levels in 2018 and 2019, with office visits to physicians from April through June decreasing by just over half, in part replaced by telemedicine visits—which increased from 1% in 2018 and 2019 to more than one third of outpatient visits in 2020.10
So, COVID 19 occurred in multiple “waves” with varying time course in different states, with lockdown appearing to offer a major initial approach to preventing the surge in deaths that has occurred in areas experiencing peaks in infection. The dramatic effect of age in increasing COVID-19 mortality is evident from the analysis. In addition to its myriad economic and social effects, lockdown led to a reduction in non-COVID emergency care, in part undesirable, but with a rapid growth in telemedicine to offset some of the decrease in outpatient care. We face important challenges going forward. We must sustain behavior changes, helping people to take appropriate precautions, perhaps instituting “micro-lockdowns” in small areas seeing resurgence of infection. We need to increase testing availability and make sure that results are rapidly available. Eventually, vaccine rollout will be crucial in establishing a “new normal.”
2019年末全球各地出现新型冠状病毒肺炎(COVID-19)。美国的病例总数从2020年3月底到4月初迅速增加,每天增加约30,000例,一直稳定到6月中旬,然后到7月每天增加超过60,000例,到8月底回落到40,000例,然后又增加到目前每天超过120 000例的水平。各个州表现出不同的模式:在纽约和新泽西,四月份每天的峰值分别为10000和4000,到年底时降至1000以下。自7月底,在佛罗里达州,德克萨斯州和加利福尼亚州的每日峰值为10000至15000,直到9月才下降,但仍保持在每天3000至5000。截至撰写本文时,美国已经有近1000万例病例,死亡24万例。
死亡率说明了这种疾病造成的损失。通过追踪过去几年中美国的每周死亡率,可以计算出COVID-19造成的额外死亡人数。从4月初开始,涉及COVID-19的死亡人数开始增加,在4月底达到每周超过1.6万的峰值,在6月底下降,然后在7月底达到每周8000例死亡的峰值,然后再次下降但仍然保持在每周4000人的水平。
虽然报告的病例数逐渐增加但死亡率降低(虽然仍然非常高),但其差异似乎部分是由于几个月来COVID-19病例的年龄分布不同造成的。 5月份的病例数量最多,主要是在80岁以上年龄较大者,但在6月、7月和8月,病例高峰逐渐出现在20至29岁之间。从2月初到10月底, 25岁以下的人群中有100例死亡。 25岁以后,COVID-19死亡百分比逐渐增加。大约3%的死亡发生在25-34岁的人群中,6%的死亡发生在35-44岁的人群中,此后每个年龄段的死亡人数在8%至10%(尽管随着年龄的增长,人口数量在减少。)在过去的9个月中,每100名85岁以上的美国人中就有近1人死于COVID19或其并发症。
非西班牙裔白人,非西班牙裔黑人和西班牙裔人群中的死亡人数相似,但按百分比计算,少数民族人口的相对死亡率呈两倍、三倍甚至更高的倍数,这表明这些群体在更大程度上受到了不利的影响。同样,在有冠心病病史、卒中者、高血压、糖尿病,特别是阿尔茨海默氏病患者中,死亡的发生率要高得多,这可能反映出在疗养院和类似的住宅设施中居民中死亡人数高得多。
在该流行病的早期,死亡的发生率要高得多,纽约居民死亡人数超过33000,新泽西州居民死亡人数超过16000,特别是在4月至5月初期间。由于COVID-19,佛罗里达州超过17000居民,加利福尼亚州近18000居民和得克萨斯州19000多人死亡,大部分发生在随后的几个月。从4月到7月底,纽约每天的死亡人数从700多下降到不到20,这几乎可以肯定是由于“封锁”的缘故:关闭无关紧要的业务,居家办公,佩戴口罩,保持人与人之间的距离,待在通风良好的区域,尽可能在户外,以及不要大量聚集。最长的“封锁”时间超过200天,位于加利福尼亚州、内华达州、俄勒冈州和威斯康星州,而纽约和伊利诺伊州有60至80天的封锁期,而康涅狄格州、堪萨斯州、马萨诸塞州和密歇根州的封锁期为20至40天。
COVID-19已导致美国医疗保健发生巨大变化。在最初的COVID-19高峰期,急诊室的就诊量减少42%,尽管避免了一些不必要的就诊,但心肌梗死和卒中的急诊量分别减少了23%和20%,糖尿病患者的急诊量减少10%却不是一件好事。 门诊就诊与2018年和2019年的平均水平相比下降了20%以上,4月至6月就医量减少了一半以上,部分被远程医疗就诊所取代——门诊病患者从2018年和2019年的1%增加到了2020的超过三分之一。
因此,COVID-19发生在不同状态下不同时程的多个“浪潮”中,而“封锁”似乎提供了一种主要的基础方法,可以防止在感染高峰期发生的死亡人数激增。从分析中可以明显看出年龄对增加COVID-19死亡率的巨大影响。除了其难以估计的经济和社会影响外,“封锁”还导致非COVID-19紧急医疗服务的减少,这在一定程度上是无益的,但远程医疗的快速增长抵消了部分门诊医疗服务的减少。我们面临着重大挑战。我们必须继续改变行为,帮助人们采取适当的预防措施,比如在发现感染重新流行的小区域内进行“微封锁”。我们需要提高测试的可用性,并确保快速获得结果。最终,疫苗的推出对于建立“新常态”至关重要。


