Underground mining impact on groundwater in Kuye River Basin, China: A coupling model study
Abstract
The Kuye River Basin has experienced a rapid depletion of groundwater due to the increased coal production. In this study, by introducing the empirical equations derived from the three zone theory in the coal mining industry in China as a boundary condition, a calculation model was developed by coupling the soil and water assessment tool and visual modular three-dimensional finite-difference ground-water flow model (SWAT-VISUAL MODFLOW). The model was applied to several coal mines in the basin to quantify the groundwater impact of underground mining. For illustration purposes, two underground water observation stations and one water level station were selected for groundwater change simulation in 2009, producing the results that agreed well with the observed data. We found that groundwater level was closely related to the height of the fractured water-conducting zone caused by underground mining, and a higher height led to a lower groundwater level. This finding was further supported by the calculation that underground mining was responsible for 23.20 mm aquifer breakages in 2009. Thus, preventing surface subsidence due to underground mining can help protecting the basin's groundwater.
1 INTRODUCTION
Located in the Kuye River Basin in China, the Shenfu-Dongsheng coalfield, with an area of 26,565 km2, is one of the top seven largest coalfields in the world, with a proven reserve of 192.2 billion tons, equivalent to one-quarter of the total in China (Wang et al., 2024; Yao et al., 2011). However, the coal mining that has intensified in the Kuye River Basin since launching the Western Development Strategy in China in 2000 has increased the coal yield from 0.2174 × 10⁸ tons in 1998 to 2.03 × 10⁸ tons in 2009. Climate change and anthropogenic activities have profoundly affected the hydrological process in the coalfield, leading to the groundwater level sharply declining and the groundwater depression cones forming.
Many studies have shown that the anthropogenic impact of groundwater intervention in some regions is more extensive than climate change, although the latter can influence underground hydrological processes at local and regional scales (Bhatnagar et al., 2024; Gautam et al., 2024; Montes-Ávila et al., 2024; Ren et al., 2024). Underground mining, as one of these interventions, has a much stronger impact on the underground hydrological process. It can directly alter runoff generation mechanisms (Álvarez et al., 2018; Xu et al., 2018), water quantity (Zhao et al., 2023), and water quality (He et al., 2024; Hou et al., 2024; Xue et al., 2024) at local to basin scales, and have variable effects on groundwater. As for water quantity, Howladar (Howladar, 2013) estimated at least a five meter decline in water level in Dinajpur, Bangladesh during 2001–2011 because of the underground mining occurring in the Barapukuria Coal Mine, and corroborated that the decline was directly proportional to the buried depth of coal seams. The method of coal mining can also have various impacts on hydrological processes. Two basic methods are widely employed: surface mining and underground mining (Weeks, 2011). The former prevails in countries such as the USA, India, and Germany, whereas the latter is mostly practiced in China. Surface mining involves the removal of natural forest soil and vegetative cover and excavation of the rock overlying target coal seams. After coal extraction, the removed overburden is replaced on site and recontoured to a desired topography (Sena et al., 2014). The infiltration rate of the compacted overburden surface decreases so that overland flow directly discharges into river channels. The same coal mining method can exert different effects on hydrological cycles. For instance, the coal mined in Pine Knot Mine, upstream of Schuylkill River, Pennsylvania, USA, experienced a decrease in its baseflow because surface runoff was diverted to the river channels instead of mine storage (Cravotta et al., 2014). In the Kuye River Basin, however, the water inside bedrock fissures near mined pits after coal mining directly drains downward rather than to river channels. As a result, the river water flows into the pits via fissures opening over time (Song et al., 2021). Thus, the original migration pattern of phreatic water transitions from horizontal runoff discharge to vertical seepage, causing a significant drop in groundwater level, reduction in stream baseflow, and attenuation and even dry-up of spring flow (Xin et al., 2014). In brief, coal mining impacts on the hydrological cycle are complicated processes.
The development of remote sensing and geographic information system techniques has enabled the use of distributed hydrological models for quantifying the impacts of anthropogenic intervention on groundwater. The distributed hydrological models are robust tools for estimating the impacts of anthropogenic intervention on water resources, despite some limitations in their applications, such as strict data requirement, tradeoff between simulation accuracy and computation efficiency, and the uncertainties arising from input data, model structure, and parameters (Ghosh et al., 2021). The SWAT-VISUAL MODFLOW (S-VM) model was applied to study agricultural irrigation in some arid and semi-arid regions (Samimi et al., 2020). However, to the best of our knowledge, no study has been reported of the application of the empirical equations of the three zone theory as a boundary condition for modeling the dynamic change of groundwater caused by underground mining in several coal mines at the basin scale. So, we introduced the model to calculate the groundwater breakage induced by underground mining to attract the attention of the water resources managing department.
The aim of this study was to determine why the groundwater level has depleted so quickly in the Kuye River Basin in 2009. This information may enable rational decision-making in sustainable water resources management and planning, and provide useful insights for some managers of the watersheds experiencing a similar situation.
2 MATERIALS AND METHODS
2.1 Watershed and data
The Kuye River, situated in the transitional zone between Inner Mongolia and Shaanxi province (38°22′–39°50′ N and 109°28′–110°45′ E), as shown in Figure 1, is one of the major tributaries of the middle Yellow River, extending 242 km in length and covering a drainage area of 8706 km2. The basin mainly consists of a wind-dust region upstream and midstream and a hill-gully loess region downstream (He et al., 2022). Controlled by a continental monsoon climate, most of the precipitation falls during the flood season (June–September), accounting for 75%–81% of the total (Li et al., 2016). The average annual streamflow is 0.554 billion m3, 57%–74% of which is concentrated between July and October (Liu et al., 2022).
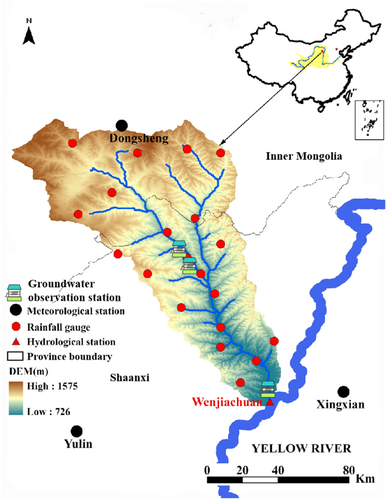
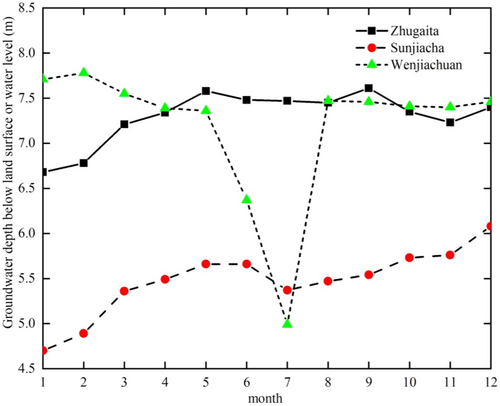
The data used included digital elevation model, geological, and hydro-meteorological data from rainfall gauges and hydrological and meteorological stations. The datasets used in the present study were acquired from the Data Application Environment Center of Chinese Academy of Sciences, National Climate Center of China Meteorological Administration, the Yellow River Conservancy Commission, Ministry of Water Resources, the Environmental and Ecological Science Data Center for West China, National Natural Science Foundation of China (Liu et al., 2003), United Nations Food and Agriculture Organization, and the National Geological Archives of China (Table 1). The driving data for the model included the daily maximum and minimum temperatures, solar radiation, relative humidity, wind speed, precipitation and groundwater level. Figure 2 shows the groundwater depth below land surface and water level observations in 2009 from Zhugaita, Sunjiacha, and Wenjiachuan observation stations.
| Data type | Data description | Scale and time domain | Data source |
|---|---|---|---|
| DEM | ASTER GDEM | 30 × 30 m (2000) | Data Application Environment Center (DAEC) of Chinese Academy of Sciences (CAS) |
| Meteorological data | Dongsheng, Yulin, Xingxian, and 20 rainfall gauges | Daily (1997–2009) | National Climate Center (NCC) of China Meteorological Administration (CMA) |
| Land use data | China Archive | 1:100,000 (2000) | Environmental & Ecological Science Data Center for West China |
| Soil types | Harmonized World SoilDatabase v 1.1 | 1:1000,000 | United Nations Food and Agriculture Organization |
| Geological data | Groundwater system, hydraulic conductivity and specific yield | 2009 | National Geological Archives of China |
| Discharge | Wenjiachuan | Daily (1997–2009) | Yellow River Conservancy Commission (YRCC), Ministry of Water Resources (MWR) |
| Groundwater depth below land surface or water level | Zhugaita, Sunjiacha, and Wenjiachuan | Monthly (2009) | National Geological Archives of China |
2.2 Calibration and validation of SWAT model
We used the SWAT model to determine the groundwater recharge in the Kuye River Basin. The model is built on a sound theoretical and physical basis and is useful for assessing the hydrological responses of complex watersheds (Arnold et al., 1998). Based on topography, soil, and land use characteristics, the model divides a watershed into multiple hydrological response units (HRUs) to simulate hydrological processes such as streamflow, evaporation, and surface water and groundwater recharge.
Based on the performance ratings of Moriasi (Moriasi et al., 2007) and Liang (Liang et al., 2013), the monthly streamflow simulation can be rated as satisfactory if NSE > 0.5, R2 > 0.5 and RE is within ±25% for both calibration and validation periods.
The coupled S-VM model was used to simulate the groundwater response to underground mining in the basin. The HRUs of the SWAT and cells of the VISUAL MODFLOW were interactively interfaced via the method proposed by Zhang et al. (2010). Groundwater recharge (GW-RCHG) and water in shallow aquifers returning to root zone (REVAP) of the basin during the period, impacted by underground mining activities in 2009, were simulated by the SWAT. These values, before incorporation into the submodules of recharge (RCH) and evapotranspiration (EVT) for VISUAL MODFLOW, were calculated using the Kriging method (Cressie, 1988) at a 1 × 1 km cell size to compute the quantity of groundwater.
NRMSE can objectively represent modeling results. A value <10% indicates an optimal result, 10%–20% denotes relatively good, 20%–30% is fair, and >30% is poor (Rinaldi et al., 2003).
2.3 Visual MODFLOW setup
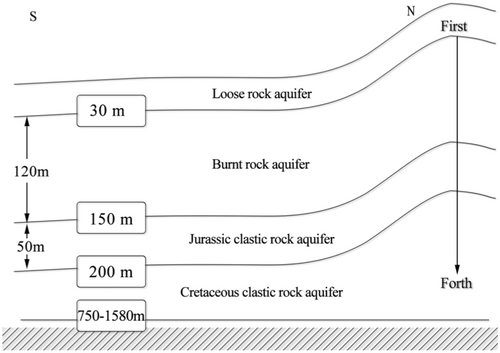
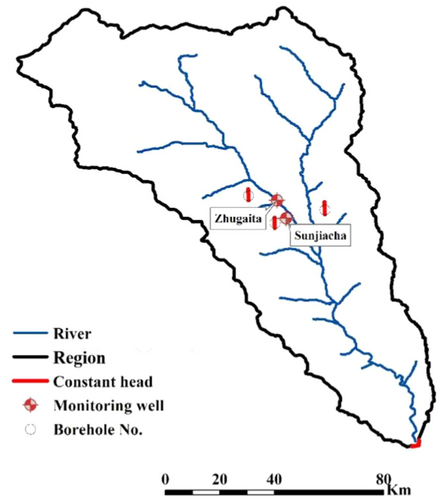
The groundwater system of the coalfield is composed of loose rock aquifer, burnt rock aquifer, Jurassic and Cretaceous clastic rock aquifers (Figure 3). As hydrological connectivity exists between the first and second aquifers, atmospheric precipitation and surface water can replenish the loose rock aquifer and burnt rock aquifer. The four aquifers, characterized by extremely nonuniform fissure development, watery magnitude, and variable permeability along different orientations, can be generalized as three-dimensional, nonhomogeneous, anisotropic, free, and confined-unconfined flow, whose movement follows Darcy's law. Coal seams are usually buried about 30–60 m below ground, as indicated by the borehole data in Table 2. With the exception of the southeast boundary where an outflow path for groundwater is located, no other paths for recharge or outflow have yet been found in the basin, as indicated by the limited data available (Wu, 2013). Figure 4 shows the constant head and zero discharge boundaries that are prescribed. The daily water level in the Kuye River estuary to the Yellow River is defined as the constant head value.
| Borehole No. | Coal burial depth(m) | Caving zone (m) | Fissure zone (m) | Totala (m) |
|---|---|---|---|---|
| 832 | 59.69 | 17.73 | 99.98 | 117.71 |
| S4 | 32.16 | 14.54 | 69.06 | 83.60 |
| S31 | 63.20 | 11.55 | 53.82 | 65.37 |
- a Represents the total height of both caving and fissure zones.
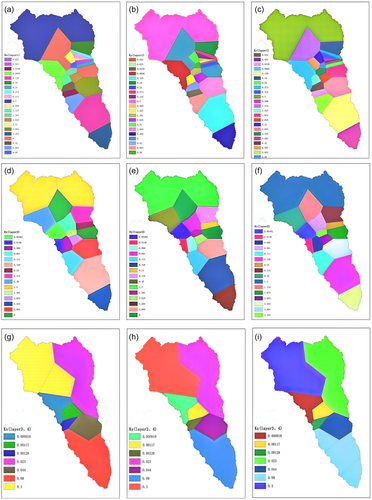
Each aquifer is composed of a regular mesh and a block-centered finite difference 1 × 1 km grid, with a total of 164 rows and 116 columns. Of the total grid area of 19,024 km2, the active grid area is 8706 km2. The model vertically stretches from the top of the surface to sea level, ranging from 750 to 1580 m. The stress period, time step, and time unit are monthly, monthly, and daily, respectively. The hydraulic conductivity (Figure 5) and specific yield (Table 3) after interpolation by the Kriging method at a 1 × 1 km cell size were assigned as initial values. The initial heads were all set to 30 m in depth.
| Storage coefficient | Specific yield | Effective porosity | Total porosity |
|---|---|---|---|
| 0.2 × 10⁻³ | 0.15 | 0.15 | 0.3 |
2.4 Scenario design
To quantify the underground mining impact on the basin groundwater, two scenarios were generated: Scenario A (with underground mining) and Scenario B (without underground mining). The groundwater storage of the two scenarios was individually simulated by the S-VM, indicating their differences in the quantity of groundwater influenced by underground mining.
The height of the fractured zone in boreholes, calculated in Equations (6) and (7), shows that its height is greater than the top of the coal seams, as shown in Table 2. A preliminary assessment of fissure development in the goaf area based on the site investigation suggests that some fissures have penetrated through the aeration belt into the ground surface; therefore, the constant head of three fissures can be assigned as the bottom of the coal seams. Their boundary conditions are graphically represented in Figure 4.
The S-VM model was used to investigate the groundwater for the two scenarios in three steps. First, the SWAT model was executed using meteorological and hydrologic data for 1997–2009 and the land use map for 2000. Second, the groundwater recharge and REVAP, at a daily time step in 2009 simulated by the SWAT, were integrated into the VISUAL MODFLOW. January–February 2009, March–October 2009, and November–December 2009 were defined as the warm-up period, calibration period, and validation period, respectively. Finally, in line with the water balance principle, the groundwater in 2009 was quantified after the two scenarios were formulated.
3 RESULTS AND DISCUSSION
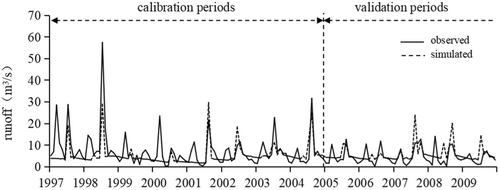
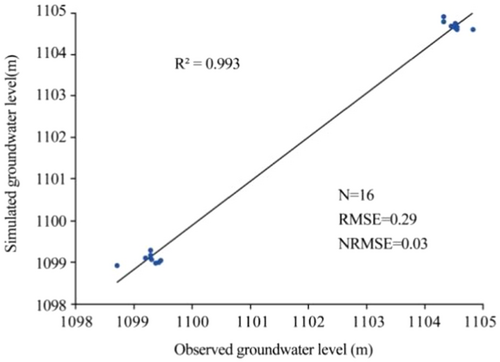
The R2, NSE, P-factor, and R-factor calculated by the SWAT for 1997–2009 were 0.49, 0.42, 0.14, and 0.01, respectively, which satisfy the requirements for the inputs for VISUAL-MODFLOW in this study, although the model simulation results were poor (Li et al., 2016, Figure 6). After determining the optimum values for hydraulic conductivity and specific yield, the dimensions of the three fissures were modified by trial and error to obtain the smallest error for all control points. The S-VM model was developed for groundwater in 2009 using the method introduced in Section 2; its modeling results are shown in Figure 7. For Scenario A, the RMSE values in the calibration and validation periods are 0.29 and 0.10 m, respectively; NRMSE values are 0.03% and 0.009%, respectively. The less calibrated and validated values indicate this coupled model is suitable for simulating the groundwater variability caused by underground mining.
Using the area-weighted method and the data in Table 4, the groundwater storage disrupted by underground mining in 2009 was calculated to be 23.20 mm. The groundwater storage consists of static storage (within aquifer in the upper part of goafs) and dynamic storage (mine discharge). The coal output in 2009 was 2.03 × 10⁸ t with mine discharge of 0.31 m3/t, resulting in a dynamic storage change of 7.23 mm, reducing the static storage by 15.97 mm. Even without underground mining, the aquifer is still depleting to some extent. According to Wu (2013), the water consumed in 2009 for industrial, domestic, and agricultural water use in the basin was 10.80 mm. Disclosed by the Water Resources Bulletin, groundwater supplies 27% of the total amount of water by Yulin in 2009. Based on this, the groundwater drawn for industrial, domestic, and agricultural water use in the basin in 2009 was around 2.90 mm. Figure 8 illustrates the headwater regime of the first aquifer in December 2009 for both scenarios, where the white area represents the portion of the depleted aquifer. Compared with Scenario B, the depletion area of Scenario A is about four-fold larger. Therefore, the underground mining impact on groundwater in 2009 was about eight times greater than the water abstracted from the first aquifer for domestic use and four times the area depleted by domestic use. These outcomes confirm the reasonability of the generated scenarios.
| Scenario | Storage (mm) | Water head (mm) | Seepage from streams to the aquifer (mm) | ET (mm) | Runoff to Groundwater flow (mm) | Total (mm) | |
|---|---|---|---|---|---|---|---|
| A (With underground mining) | Recharge | 27.2 | 0 | 89.3 | 0 | 12.3 | 128.8 |
| Outflow | 27.7 | 2.3 | 118.5 | 4.2 | 0 | 152.7 | |
| Recharge-Outflowa | −0.5 | −2.3 | −29.2 | −4.2 | 12.3 | −23.9 | |
| B (Without underground mining) | Recharge | 50.4 | 0 | 0.2 | 0 | 11.7 | 62.3 |
| Outflow | 50.9 | 0 | 7.3 | 4.8 | 0 | 63 | |
| Recharge-Outflowa | −0.5 | 0 | −7.1 | −4.8 | 11.7 | −0.7 | |
- a Represents the amount of recharge minus the amount of outflow.
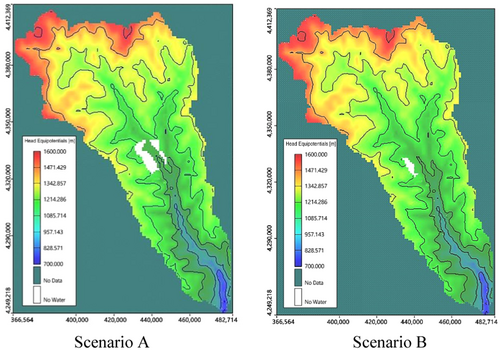
Hydrological models suffer from different sources of uncertainties. Two primary causes of the uncertainties in this modeling were identified after analyses. First, hydraulic conductivity of the VISUAL MODFLOW model was calculated with a lower resolution of 1 × 1 km using Kriging interpolation method. Second, the assumed distribution and depth of the aquifers in Scenario A are likely different from reality. Nevertheless, the NRMSE values of the coupled S-VM in the calibration and validation periods are small (Figure 7). For the Kuye River Basin, with a total difference in groundwater level in the order of 5 m, the RMSE values of 0.29 and 0.1 m are relatively small. Otherwise, Mine water was about 2t produced by a ton of coal mining in China (Gu et al., 2021) The quantity calculated in this paper is 1t, considering the difference in water resources between north and south, the simulation results of the underground mining impact on groundwater in the basin are proven to be reasonable.
We attempted to compute the underground mining-induced impacts on groundwater through a series method of generalization. In designing the scenarios for modeling, three ground fissures were generalized based on our site investigation. The simulating result is fairly good, but with the prerequisite of selecting suitable boundary conditions in the application of the S-VM model.
Underground mining complicates geologic conditions. For instance, goafs form after coal mining; subsequently, subsidence may occur if heavy rains fall. Even Tiankeng-karst geography may be witnessed under certain circumstances. Geological data, such as specific storage and hydraulic conductivity, change in response to disturbed aquifers; consequently, groundwater is affected. As coalmines are widely distributed and involve various mining methods in the basin, collecting enough data within a short time period is impossible. Due to the above-mentioned limitations, the effects of subsidence zones on groundwater were not analyzed. Identifying the impact from each individual coal mine on groundwater needs to be further investigated in future studies.
4 CONCLUSIONS
In this study, the S-VM model was applied to quantify the groundwater change in the Kuye River Basin in 2009, producing the reasonable results confirmed using a comparison with the observed data. After locating three coal mine pits and defining the important parameters for the hydraulic conductivity of four aquifers, we found that the fractured water-conducting zone induced by underground mining was one of major causes of the groundwater reduction in the Kuye River Basin in 2009. The simulation outcomes of this study are constrained by data scarcity and unclear mechanisms, and the simulation process cannot fully capture the entire impact of coal mining on groundwater. Nonetheless, the outcomes provide valuable insights for the management of the Kuye River Basin, particularly in terms of minimizing the height of the water-conducting fracture zone and reducing the interconnections between surface water and groundwater. Therefore, this study may provide a reference for water protection mining in other similar basins.
ACKNOWLEDGMENTS
This work was supported by Special Funding for Basic Research Expenses for Central Government Department-affiliated Institutes[HKY-JBYW-2024-06], National Key Research and Development Program of China[2021YFC3201103-01], Project Funds of Administration for Market Regulation Henan Province [20241110011] and The Open Foundation of the Yellow River Institute of Hydraulic Research [LYBEPR202206].
ETHICS STATEMENT
None declared.
Open Research
DATA AVAILABILITY STATEMENT
The data that support the findings of this study are available from the corresponding author upon reasonable request.


