Integrated optimization and coordination of cascaded reservoir operations: Balancing flood control, sediment transport and ecosystem service
Abstract
Exploring optimal operational schemes for synergistic development is crucial for sustainable management in river basins. This study introduces a multi-objective synergistic optimization framework aimed at analyzing the interplay among flood control, ecological integrity, and desilting objectives under varying water-sediment conditions. The framework encompasses multi-objective reservoir optimal operation, scheme decision, and trade-off analysis among competing objectives. To address the optimization model, an elite mutation-based multi-objective particle swarm optimization (MOPSO) algorithm that integrates genetic algorithms (GA) is developed. The coupling coordination degree is employed for optimal scheme decision-making, allowing for the adjustment of weight ratios to investigate the trade-offs between objectives. This research focuses on the Sanmenxia and Xiaolangdi cascade reservoirs in the Yellow River, utilizing three representative hydrological years: 1967, 1969, and 2002. The findings reveal that: (1) the proposed model effectively generates Pareto fronts for multi-objective operations, facilitating the recommendation of optimal schemes based on coupling coordination degrees; (2) as water-sediment conditions shift from flooding to drought, competition intensifies between the flood control and desilting objectives. While flood control and ecological objectives compete during flood and dry years, they demonstrate synergies in normal years (r = 0.22); conversely, ecological and desilting objectives are consistently competitive across all three typical years, with the strongest competition observed in the normal year (r = −0.95); (3) the advantages conferred to ecological objectives increase as water-sediment conditions shift from flooding to drought. However, the promotion of the desilting objective requires more complex trade-offs. This study provides a model and methodological approach for the multi-objective optimization of flood control, sediment management, and ecological considerations in reservoir clusters. Moreover, the methodologies presented herein can be extended to other water resource systems for multi-objective optimization and decision-making.
1 INTRODUCTION
The construction of large-scale reservoir groups worldwide has been advancing steadily, with these interconnected systems playing an increasingly critical role in regulating river flow. However, social development has introduced a proliferation of operational objectives, including flood control, irrigation, and ecological preservation, significantly complicating reservoir operations (Ai et al., 2017; Wang et al., 2019). Balancing these conflicting objectives presents substantial challenges, necessitating advanced operational strategies.
Multi-objective optimization of reservoir operations is critical for balancing ecological stability with the efficient utilization of water resources. However, addressing Multi-Objective Optimization Problems (MOPs) presents significant challenges due to the inherent conflict between objectives, the large number of decision variables, and the presence of complex constraints (Feng et al., 2024). Broadly, solutions to MOPs can be categorized into two main approaches. The first is the weighted method, which converts MOPs into single-objective problems by assigning weights to individual objectives. These transformed problems are then solved using algorithms such as Dynamic Programming (DP) (Zeng et al., 2019), the Progressive Optimal Algorithm (POA) (Jiang et al., 2018), Genetic Algorithms (GA) (Hu et al., 2014), and Particle Swarm Optimization (PSO) (Zhang et al., 2020). The second approach utilizes multi-objective evolutionary algorithms, such as NSGA-II (Xu et al., 2024) and MOPSO (Chen et al., 2018), which directly identify Pareto-optimal solutions (Zhou et al., 2018).
Recent advances in this domain include the development of hybrid algorithms that integrate multiple methods, such as EPOA-DP (Chen, 2021), SA-NSGA-II (Li et al., 2024), and MBWOHHO (Shen et al., 2024). These hybrid approaches have demonstrated improved convergence and performance (Dahmani & Yebdri, 2020; Leela Krishna et al., 2018). Despite these advancements, achieving a universally optimal scheme remains infeasible due to the inherent trade-offs among competing objectives (Ertel, 2011).
In recent years, synergetic theory has emerged as a promising framework for addressing MOPs in reservoir operations. For instance, Jin et al. (2023) applied synergetic theory to optimize operations in the Yellow River cascade reservoirs, achieving coordinated multi-objective management. Similarly, Wan et al. (2023) employed maximum synergy principles to design flood control schemes, while Hong et al. (2024) leveraged coupling coordination strategies to enhance the sustainability of multi-objective operations. These studies highlight the potential of synergetic theory as a novel and effective approach to addressing the challenges associated with reservoir operation optimization.
The Yellow River, characterized by severe soil erosion and sedimentation, faces serious water-sediment challenges due to climate change and human activities (Wang et al., 2020; Zhang et al., 2020). These issues exacerbate water scarcity, diminish flood control capacity, and disrupt ecological stability (Li et al., 2023; Liu et al., 2020). Despite extensive research on water-sediment regulation in the Yellow River basin (Bai et al., 2016; Zhang et al., 2022), effective coordination among flood control, ecological sustainability, and sediment discharge objectives remains insufficiently addressed.
This study aims to optimize the operation of the Sanmenxia and Xiaolangdi cascade reservoirs in the middle Yellow River under three primary objectives: flood control, ecological sustainability, and desilting. To efficiently derive the optimal reservoir operation, a Multi-Objective Particle Swarm Optimization (MOPSO) algorithm, enhanced with Elitist Mutation (EM), is applied. The Sanmenxia and Xiaolangdi cascade reservoirs, located in the middle Yellow River, are selected as the case study for this research. Additionally, optimal scheme selection is facilitated through the use of a coupling coordination model. The Spearman method is utilized to calculate correlation coefficients between the objectives, and the synergistic-competitive relationships among the objectives are assessed under three different water-sediment conditions. This study aims to contribute novel insights into the multi-objective optimal operation of cascade reservoirs under varying water-sediment scenarios.
The structure of the paper is as follows: Chapter 2 introduces the study area and the data used. Chapter 3 develops the optimization operation model for the cascade reservoirs and proposes a decision-making approach based on the coupling coordination model. Chapter 4 presents the results of the optimization operations. Chapter 5 analyzes the multi-objective outcomes under different sediment conditions and discusses the underlying implications of the findings. Finally, Chapter 6 provides the conclusions of the study.
2 STUDY SITE AND DATA
2.1 Sanmenxia-Xiaolangdi (SMX-XLD) cascade reservoirs
In this paper, the cascade reservoirs on the mainstream, named Sanmenxia (SMX) and Xiaolangdi (XLD), are taken as a case study. The location of SMX-XLD cascade reservoirs is shown in Figure 1.
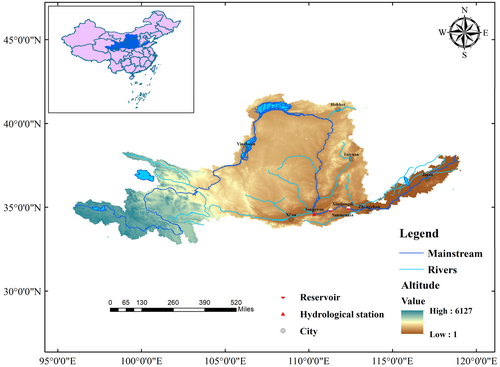
The SMX reservoir, constructed in 1969, is a seasonal regulation reservoir primarily designed for flood control, with additional functions including ice prevention, water supply, hydropower generation, and sediment discharge. However, its regulation capacity has been significantly constrained by extensive sediment deposition.
The XLD reservoir, completed in 1999, functions as an incomplete annual regulation reservoir. It serves multiple objectives, including flood control, sediment discharge, ice prevention, irrigation, hydropower generation, and water supply. The SMX-XLD cascade reservoirs occupy a strategic position in the Yellow River basin, controlling 91% of the water flow and nearly 100% of the sediment transport (Chen et al., 2022). This makes them pivotal in the integrated management and sustainable development of the Yellow River.
The main parameters of the SMX-XLD cascade reservoirs are summarized in Table 1.
| Item | Abbr. | Starting water level () | Ending water level () | Lowest water level () | Highest water level () | Minimum discharge flow () | Maximum discharge flow () |
|---|---|---|---|---|---|---|---|
| Sanmenxia | SMX | 305.00 | 305.00 | 300.00 | 333.65 | 200.00 | 5225.00 |
| Xiaolangdi | XLD | 235.00 | 248.00 | 230.00 | 270.00 | 200.00 | 4500.00 |
2.2 Data
The water-sediment regulation operations of the SMX-XLD cascade reservoirs are concentrated during the flood season, which encompasses the summer flood period (July–August) and the autumn flood period (September–October). These periods are characterized by increased rainfall frequency, making them critical for addressing flood control and water-sediment regulation.
For this study, the summer and autumn flood seasons were selected as the operational periods. Using the annual average runoff of the Yellow River basin as a reference, three representative hydrological years were chosen to illustrate typical scenarios: a flood year (1967), a normal year (1969), and a dry year (2002). The corresponding inflow and sediment processes for these years are depicted in Figure 2.

The ecological flow constraint for the lower reach of the Yellow River is calculated using a monthly frequency method (Yu et al., 2004) in order to determine the ecological guarantee rate (Table 2).
| Month | 11 | 12 | 1 | 2 | 3 | 4 | 5 | 6 | 7 | 8 | 9 | 10 |
|---|---|---|---|---|---|---|---|---|---|---|---|---|
| Ecological flow () | 508 | 463 | 376 | 507 | 894 | 897 | 730 | 1249 | 1038 | 537 | 516 | 728 |
3 METHODOLOGY
3.1 Model framework
The overall framework of the methodology of this study is shown in Figure 3.
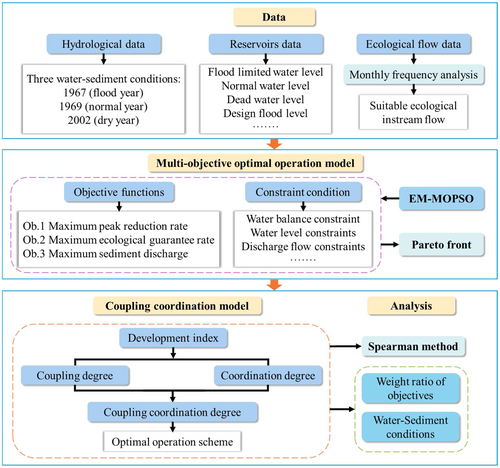
A multi-objective optimization model was developed to address the peak reduction rate, ecological guarantee rate, and sediment discharge for the SMX-XLD cascade reservoirs. The Elite Mutation Multi-Objective Particle Swarm Optimization (EM-MOPSO) algorithm was employed to solve the model, generating a Pareto front under three distinct water-sediment scenarios.
The Pareto front was subsequently evaluated using the Spearman method, which provided correlation coefficients among the three objectives to analyze their synergistic and competitive relationships. Based on these insights, a coupling coordination model was utilized for decision-making to balance the objectives effectively.
Further analysis examined the influence of water-sediment conditions and varying objective weight ratios on the selection of the optimal operation scheme, providing a comprehensive framework for informed reservoir management decisions.
3.2 Multi-objective optimization operation model for the SMX-XLD cascade reservoirs
3.2.1 Objective functions
The objectives of the multi-objective operation model for the SMX-XLD cascade reservoirs in this study are flood control, ecology, and desilting.
- (1)
Flood control objective.
()where denotes the maximum peak reduction rate of the SMX-XLD cascade reservoirs (); denotes the total number of time steps in the operation period (); denotes the inflow of the SMX reservoir (); denotes the discharge of the XLD reservoir (). - (2)
Ecology objective.
()()where denotes the maximum ecological guarantee rate in the lower reach of the Yellow River (); and denote the actual release discharge and the objective ecological flow of the XLD reservoir at time , respectively (). - (3)
Desilting objective.
()()()where denotes the maximum sediment discharge of the SMX-XLD cascade reservoirs ; denotes the number of reservoirs; and denote the sediment inflow and discharge of the reservoir at time , respectively ; denotes the sediment concentration of the inflow of the reservoir at time ; denotes the inflow of the reservoir at time (); denotes the sediment discharge efficiency of the reservoir (); denotes the dry density of the bed sediment in the reservoir area ().
3.2.2 Constraints
- (1)
Water balance constraint.
()where denotes the final reservoir storage for reservoir during the operation period (); denotes the initial reservoir storage for reservoir initial reservoir during the operation period (); and denote the average inflow and discharge for reservoir during the operation period , respectively (); denotes the duration of the operation period (). - (2)
Water level constraint.
()where denotes the water level for reservoir during the operation period (); and denote the lower and upper limits (). - (3)
Initial and terminal water level equality constraints.
()where denotes the flood control water level of the reservoir (); and denote the water levels of reservoir at the beginning and end of the operation period, respectively (). - (4)
Water release constraint.
()where and denote the maximum and minimum water release for reservoir during the operation period (). - (5)
All the variables mentioned above are non-negative.
3.3 Algorithm for the multi-objective optimization operation model
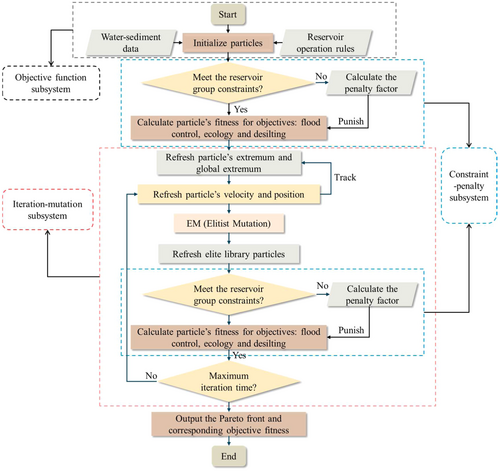
The EM-MOPSO algorithm is employed to solve the multi-objective optimization operation model in this study, introducing Elitist Mutation to address the shortcomings of premature convergence in the MOPSO algorithm while retaining its advantages (Zheng et al., 2017). Additionally, EM-MOPSO can dynamically adjust based on the iteration process to improve search efficiency, significantly enhancing particle diversity and the quality of the Pareto front. This algorithm is implemented in a MATLAB environment. The algorithm flowchart is shown in Figure 4.
- 1.
Initial particle generation: Particles are generated based on the reservoir operation rules, forming the initial swarm.
- 2.
Constraints and fitness calculation: Each particle is examined to ensure it meets the constraint requirements of the reservoir group. The objective fitness is calculated for all particles, with penalties applied to those that violate the constraints.
- 3.
Swarm update and mutation: The particle swarm is updated by tracking both the historical best positions (personal best) and the global best position. Select particles are then subjected to mutation to explore new solution spaces. Once the iteration count meets the predefined requirements, the algorithm outputs the Pareto front along with the corresponding objective fitness values.
To maintain convergence and stability, the algorithm controls the number and magnitude of mutations based on the iteration counts. As the number of iterations increases, both the frequency and extent of mutations decrease. This approach prevents the algorithm from deviating from the optimal solution due to excessive mutations in later stages, ensuring that it remains close to the optimal scheme as it converges.
3.4 Multi-objective decision-making model
The coupling coordination degree model is applied in this study to evaluate the Pareto front and identify the optimal operation scheme. The model uses the coupling coordination degree (D) as the criterion for assessing the quality of different schemes. The degree reflects the harmony and synergy of coordinated development within the system, which is influenced by both the coupling degree (C) and the coordination degree (T) (Zameer et al., 2020).
- (1)
Development index.
If denotes the development index of the objective function, it is determined using to Equation (13). If the objective function values include negative numbers, the calculation follows Equation (14).
()()where denotes the value of the particle corresponding to the objective function; and denote the minimum and maximum value of the objective function across the entire Pareto front, respectively. - (2)
Coupling degree.
()where denotes the number of the objective functions; denotes the development indices of the objective function. - (3)
Coordination degree.
()where denotes the weights of the objective function. - (4)
Calculate the coupling coordination degree.
()
To determine the level of coupling coordination degree in the research system accurately, the D value is divided into 10 grade intervals, as shown in Table 3.
| Degree | [0,0.1] | (0.1,0.2] | (0.2,0.3] | (0.3,0.4] | (0.4,0.5] |
|---|---|---|---|---|---|
| Level | Extreme imbalance | Severe imbalance | Moderate imbalance | Mild imbalance | Near imbalance |
| Degree | (0.5,0.6] | (0.6,0.7] | (0.7,0.8] | (0.8,0.9] | (0.9,1.0] |
| Level | Barely coordination | Primary coordination | Intermediate coordination | Well coordination | High-quality coordination |
4 RESULTS
4.1 Pareto front for the SMX-XLD cascade reservoirs
The Pareto front and the optimal scheme are shown in Figure 5.
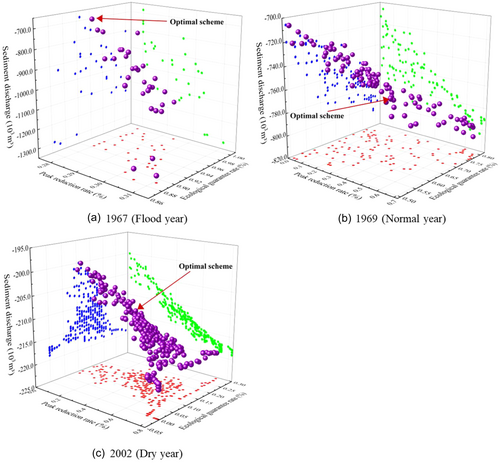
As depicted in Figure 5, the number of particles on the Pareto front for flood year (Figure 5a), normal year (Figure 5b), and dry year (Figure 5c) is 31, 103, and 269, respectively. This trend indicates that the Pareto front expands as water-sediment resources shift from abundant to scarce. The underlying reason lies in the increased complexity of balancing the three objectives—flood control, ecological sustainability, and sediment discharge—under resource-scarce conditions. To identify an optimal scheme that simultaneously satisfies these objectives, the algorithm must explore a broader solution space, thereby generating more particles on the Pareto front. Thus, scarce water-sediment resources lead to a greater diversity of potential solutions.
Additionally, the projections of the Pareto front axes for the three hydrological years reveal distinct interactions among the objectives. A pronounced competitive relationship is observed between the peak reduction rate and sediment discharge, where an increase in the peak reduction rate corresponds to a decrease in sediment discharge. The relationship between the peak reduction rate and ecological guarantee rate, however, is inconsistent: it is competitive during the flood and dry years but synergistic in the normal year. Similarly, the ecological guarantee rate and sediment discharge exhibit significant competitiveness only in the normal year.
4.2 Optimal operation scheme for the SMX-XLD cascade reservoirs
Table 4 shows the optimal schemes obtained for flood, normal, and dry years using the coupling coordination degree model, with maximum coupling coordination degrees of 0.97, 0.77, and 0.70, respectively.
| Peak reduction rate () | Ecological guarantee rate () | Sediment discharge (103 ) | |
|---|---|---|---|
| Flood year | 28.00 | 92.50 | −682.48 |
| Normal year | 44.83 | 61.67 | −762.65 |
| Dry year | 36.87 | 15.00 | −209.26 |
The ecological guarantee rate for the flood year is highest at 92.50%, indicating that abundant in flows are conducive to meeting the optimal ecological condition of the river. However, the peak reduction rate for the normal year is highest at 44.83%, while its sediment discharge is lowest, the sedimentation in the cascade reservoirs is 776.65 × 10³ m3. This means that under stable inflow conditions, cascade reservoirs tend to prioritize achieving the peak reduction rate, at the expense of sediment discharge. These results illustrate the complexity and challenges of the operation of the cascade reservoirs under three water-sediment conditions.
4.3 Optimal operation process of the SMX-XLD cascade reservoirs
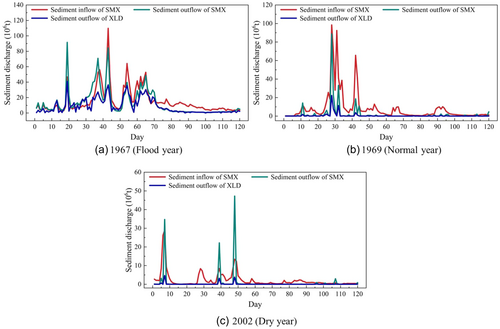
Based on the optimal schemes obtained from the coupling coordination degree model, the optimal operation processes of the SMX-XLD cascade reservoirs were plotted under the three typical years. The discharge and sediment processes are shown in Figures 6 and 7, respectively.
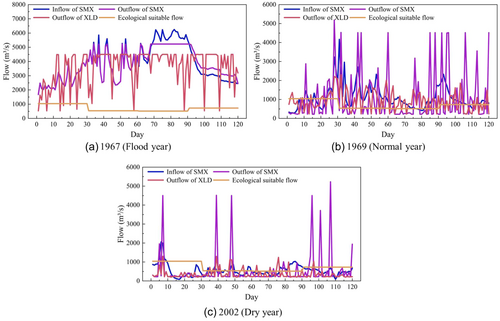
As shown in Figure 6, the discharge process of the SMX reservoir shows a similarity to the inflow pattern in the flood year (Figure 6a). In contrast, the discharge patterns of both the SMX and XLD reservoirs exhibit significant fluctuations in normal year (Figure 6b) and dry year (Figure 6c). This indicates that the regulatory capacity of the SMX reservoir is relatively limited, as it is unable to effectively modulate flow pulses during the period of high inflow.
As shown in Figure 7, the peak sediment discharge periods at the SMX and XLD reservoirs consistently occur during periods of maximum sediment inflow and peak discharge. Additionally, the sediment discharge of the reservoirs increases with increasing sediment inflow during the operation period, indicating a positive correlation, as shown in Figure 7a–c. The results indicate that large flow pulses and high sediment inflow are conducive to generating peak sediment discharge in the cascade reservoirs.
5 DISCUSSION
The relationship between objectives and hydrological conditions is discussed based on optimal schemes for different typical years while analyzing the trade-offs among objectives and the response relationships between the optimal schemes and each objective.
5.1 Trade-offs among objectives under different hydrological conditions
The distributions of coupling coordination degrees of the Pareto front for flood year, normal year, and dry year are shown in Figure 8.

As shown in Figure 8, the coupling coordination rates for flood, normal, and dry years are 96.77, 95.15, and 91.08, respectively. The findings indicate that as the water-sediment resources shift from abundant to scarce, the degree of coupling coordination in the system declines, resulting in a lower proportion of coordinated schemes on the Pareto front (i.e., solutions with a coupling coordination degree D > 0.5 within the Pareto front).
To illustrate the impact of water-sediment conditions on the objectives, the development indices for each objective under three typical years are presented in Table 5.
| Flood year | 0.90 | 0.93 | 1.00 |
| Normal year | 0.63 | 0.76 | 0.42 |
| Dry year | 0.45 | 0.51 | 0.51 |
As shown in Table 5, in the flood year, the development indices () of the three objectives are all greater than 0.9, indicating that abundant water-sediment resources are beneficial for the achievement of these objectives. Compared to the flood year, the water-sediment resources are relatively scarce in the normal year, resulting in a decline in the development indices for the flood control and ecology objectives. However, these objectives still have good development ( > 0.6). The development index of the desilting objective in the normal year is poor ( < 0.5). In the dry year, due to scarce water-sediment resources, none of the three objectives can achieve satisfactory development.
These findings suggest that the development indices of the flood control and ecology objectives are positively correlated with water-sediment conditions, which is consistent with previous research (Liu et al., 2022; Zhang et al., 2016). Furthermore, the relationship between the desilting objective and water-sediment conditions is not as clear-cut, reflecting the complexity of multi-objective reservoir operation under varying water-sediment conditions (Chen et al., 2024).
5.2 Correlation analysis among objectives
To illustrate the correlation between objectives, the correlation coefficients among them are calculated and shown in Table 6.
| Peak reduction rate – Ecological guarantee rate (r1) | Peak reduction rate – Sediment discharge (r2) | Ecological guarantee rate – Sediment discharge (r3) | |
|---|---|---|---|
| Flood year | −0.31 | −0.44 | −0.16 |
| Normal year | 0.22 | −0.62 | −0.95 |
| Dry year | −0.19 | −0.95 | −0.05 |
5.2.1 Correlation between peak reduction rate and ecological guarantee rate
In flood and dry years, the correlation coefficients between the peak reduction rate and the ecological guarantee rate are −0.31 and −0.19, respectively, indicating a weak competitive relationship. Conversely, in normal years, the correlation coefficient is 0.22, suggesting a weak synergistic relationship. This variability highlights the sensitivity of the relationship between the peak reduction rate and the ecological guarantee rate to different reservoir operation modes under critical inflow conditions, resulting in an unstable synergistic-competitive dynamic between these objectives.
5.2.2 Correlation between peak reduction rate and sediment discharge
In all three typical years, the correlation coefficients between the peak reduction rate and sediment discharge are negative, showing a competitive relationship between them. This indicates that as the peak reduction rate increases, sediment discharge decreases. Furthermore, the competitiveness between the two objectives in the dry year is higher than in the flood and normal years, at 115.91 and 53.2, respectively. This indicates that during the operational period with rather low inflow, the optimization space for operation schemes will be limited, which will reduce the sediment discharge potential.
5.2.3 Correlation between ecological guarantee rate and sediment discharge
In flood and dry years, the correlation coefficients between the ecological guarantee rate and sediment discharge are −0.16 and −0.05, respectively, showing a weak competitive relationship. However, during normal years, the correlation coefficient drops significantly to −0.95, demonstrating a strong competitive relationship. This suggests that in flood and dry years, the ecological guarantee rate can be either easily or only marginally met, resulting in a weak correlation between the ecology and desilting objectives. In contrast, normal years reveal a significant trade-off between ecological and desilting objectives, leading to pronounced competition between them.
- 1.
The operational scheme of cascade reservoirs need to be dynamically adjusted to adapt to the seasonal and inter-annual hydrological variations. In the flood and normal years, priority should be given to flood control objective, while in the dry year, emphasis should be placed on ecology and desilting objectives. Continuous monitoring of hydrological data and flow variations, along with timely adjustments to the operational schemes of cascade reservoirs, will benefit water resources management (Xia et al., 2021).
- 2.
The differences in correlation coefficients among various objectives reflect the importance of formulating adaptive cascade reservoirs operation schemes based on actual water-sediment conditions. In the flood year, the competitive relationship between flood control and the other objectives is stronger, indicating that flood control should be prioritized in scheme design. In the normal and dry years, the relationship between flood control and desilting objectives remains competitive, but there is a notable difference in the correlation between the ecology objective and the other objectives. The results indicate that the synergistic-competitive relationships among the objectives vary greatly across different typical years and exist only within specific weight ranges (Chen et al., 2023). Therefore, the optimal operation scheme should comprehensively consider the priorities of each objective to achieve balance and coordination.
5.3 The response of the optimal schemes to the objective weights
The original optimal schemes were established with a weight ratio of 1:1:1 for flood control, ecology, and desilting objectives. To analyze the response of the optimal schemes to the objective weights, the weight coefficients of the ecology and desilting objectives were increased separately. The growth rates of each objective function in the new optimal schemes were calculated relative to those in the original optimal schemes to assess the variations in the characteristics of each objective.
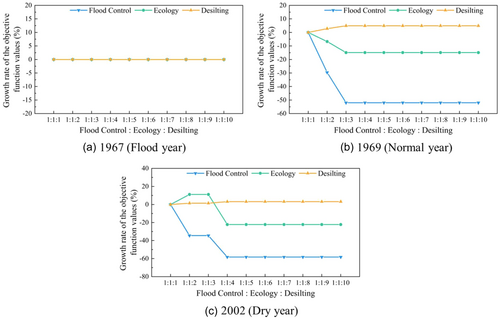
The coupling coordination degree changing process with weight allocations of objectives is shown in Figure 9. The growth rates changing process of the objective function values with weight allocations of the ecology and desilting objectives are shown in Figures 10 and 11, respectively.

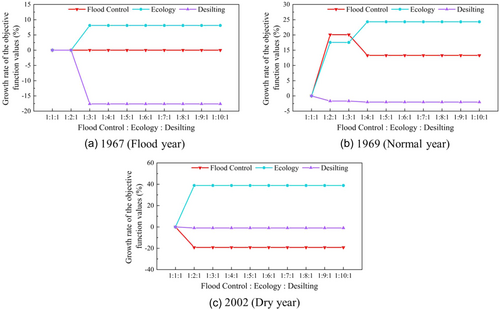
As the weight of the ecology objective increases, there is a notable rise in the maximum growth rates for ecology objective in the flood year (Figure 10a), normal year (Figure 10b), and dry year (Figure 10c), reaching 8.1%, 24.32%, and 38.87%, respectively. The results indicate that in dry year (Figure 10c), prioritizing the ecology objective in the reservoir operation scheme is conducive to enhancing ecological benefits.
When the growth rates of the ecology objective reach their maximum, the growth rates of the flood control objective are 0, 13.29%, and −19.20% in the flood, normal, and dry years, respectively. This result indicates that when inflow is average or high (Figure 11a,b), prioritizing the ecological objective does not affect the flood control objective. However, when inflow is low (Figure 11c), it tends to inhibit the flood control objective. Therefore, a balance between ecological protection and flood control demands is needed in reservoir operation to avoid compromising flood control effectiveness under extreme conditions.
Meanwhile, the growth rates of the desilting objective are −17.62%, −2.02%, and −0.97%, respectively. This shows that as inflow decreases, prioritizing the ecology objective weakens the inhibitory effect on the desilting objective. Thus, the operation scheme for cascade reservoirs can enhance ecological benefits without significantly reducing sediment discharge.
As the weight of the desilting objective increases, the maximum growth rates for desilting objective are 0, 4.90%, and 3.16% in the flood, normal, and dry years, respectively. The results indicate a non-linear relationship between the weight of the desilting objective and its growth rates. In the flood year, since the desilting objective has already reached its maximum value, increasing its weight does not contribute to the growth of other objectives, indicating that this objective has reached a saturation point during the operation period. Consequently, in the flood year, pursuing the desilting objective in the operation scheme blindly may yield no benefits and could result in an imbalance in resource allocation, weakening the reservoir's ability to ensure flood control and ecological protection.
When the growth rates of the desilting objective reach their maximum, the growth rates of the flood control objective are −51.97% and –58.29% in the normal and dry years, respectively. Meanwhile, the growth rates of the ecology objective are −14.87% and −22.20%, respectively. These results indicate that prioritizing sediment discharge benefits in the operation scheme, as water-sediment conditions shift from abundant to scarce, leads to significant losses in other objectives.
According to the optimized results from the SMX-XLD cascade reservoirs, trade-offs among various objectives should be fully considered. As water-sediment resources shift from abundant to scarce, increasing the weight of the desilting objective results in marginal benefits and significant losses. Consistent with the research direction of Peng et al. (2022), the optimal operation scheme for the reservoirs should aim to establish a coordination and balance mechanism among various objectives, rather than merely focusing on the benefits of a single or partial objective.
6 CONCLUSIONS
This study presents a multi-objective optimization framework based on the EM-MOPSO algorithm, which generates Pareto-optimal schemes with coordination rates exceeding 90% under three distinct water-sediment conditions. The research further investigates the synergistic and competitive relationships between the flood control, ecological sustainability, and desilting objectives, as well as the effects of adjusting the relative weights of the ecology and desilting objectives on other objectives within the coupling coordination model. Based on the analysis, the following conclusions are drawn:
- 1.
Based on EM-MOPSO algorithm, coordination among flood control, ecology, and desilting objectives was achieved for different hydrological conditions. A positive relationship exists between the flood control and ecology objectives and water-sediment conditions. By incorporating the coupling coordination degree model for decision-making, the coupling coordination degrees of the optimal operation schemes for flood, normal, and dry years are 0.97, 0.77, and 0.70, respectively. This indicates that abundant water-sediment resources are beneficial for the development of flood control and ecological objectives and promote coordination among these objectives.
- 2.
In three typical years, the synergistic-competitive relationships among the flood control, ecology, and desilting objectives differ significantly. In the flood year, all three objectives exhibit competitive relationships (r1 = −0.31, r2 = −0.44, r3 = −0.16). In the normal year, the desilting objective shows a strong competitive relationship with both the flood control (r2 = −0.62) and ecology objectives (r3 = −0.95), while a weak synergistic relationship is observed between the flood control and ecology objectives (r1 = 0.22). In the dry year, the ecology objective has a weak competitive relationship with both the flood control (r1 = −0.19) and desilting objectives (r3 = −0.05), whereas a strong synergistic relationship is observed between the flood control and desilting objectives (r2 = −0.95). These findings illustrate the influence of changing water-sediment conditions on the relationships among objectives, highlighting the importance of introducing reservoir operation schemes based on water-sediment conditions in practice.
- 3.
Adjusting the weight ratios significantly impacts the benefits of flood control, ecology, and desilting objectives. When adjusting the weight coefficient for ecology objective, the increases during the flood, normal, and dry years are 8.1%, 24.32%, and 38.87%, respectively, while the corresponding total losses for other objectives are 17.62%, −11.27%, and 20.17%. When adjusting the weight coefficient for desilting objective, in the flood year, the original optimal operation scheme achieves the maximum desilting objective, resulting in an increment ratio of 0% for all objectives. In the normal and dry years, the increases of desilting objective by 4.90% and 3.16%, respectively, while the corresponding total losses for other objectives are 66.84% and 80.49%. These results indicate that prioritizing flood control and desilting objectives in the flood year while focusing on ecology objective in the normal and dry years is beneficial for the sustainable development of the Yellow River basin.
Although the method is applied to the Sanmenxia-Xiaolangdi reservoir system, it can be extended to the optimization and decision-making of other water resource systems. This multi-objective optimization framework provides broad potential for reservoir management and optimal resource utilization under varying water-sediment conditions.
ACKNOWLEDGMENTS
This research was funded by the National Natural Science Foundation of China (Grant No. U2243228), the Belt and Road Special Foundation of the National Key Laboratory of Water Disaster Prevention (Grant No. 2022nkms04), MOE (Ministry of Education in China) Liberal Arts and Social Sciences Foundation (Grant No. 23YJCZH332) and the Natural Science Foundation of Anhui Province (Grant Nos. 2308085US13, 2208085US03).
ETHICS STATEMENT
None declared.
Open Research
DATA AVAILABILITY STATEMENT
The data that support the findings of this study are available from the corresponding author upon request.


