Feasibility planning study of lattice radiotherapy for palliation in bulky tumors
Abstract
Purpose
Lattice radiotherapy can potentially deliver high doses to the tumor core, while conventional doses to the periphery resulting in improved response rates in large tumors (> 5 cm). We assessed the feasibility of planning lattice radiotherapy and dosimetrically compared it with conventional radiotherapy.
Methods
This retrospective dosimetric study evaluated 10 patients with large tumors (> 5 cm) treated with palliative intent with a dose of 20Gy in five fractions. High-dose lattice points were created at doses of 50Gy in non-hepatic tumors and 35Gy in hepatic tumors. Lattice plans were compared with treatment plans regarding dose coverage and organ-at-risk dosimetry.
Results
Treated sites included soft tissue metastases to the neck, lungs, abdomen, pelvis, and liver. The mean lesion volume was 1103 cc (352–3173 cc). The maximum tumor size was 16 cm. The target volume coverage was > 95% in all but one case (88% to achieve organ constraints). Dosimetry and organ-at-risk doses were similar in both palliative treatment and simulated lattice plans.
Conclusion
Lattice radiotherapy is feasible in large tumors using volumetric-modulated arc therapy and achieves good coverage while meeting organ constraints. However, a prospective clinical evaluation is required to confirm its efficacy.
1 INTRODUCTION
Cancer contributes to 20% of worldwide mortality, and most cases require palliation at some stage during treatment.1 Large unresectable cancers have high morbidity and mortality rates. Palliative radiotherapy (RT) plays an important role in alleviating symptoms in these patients. Conventional palliative RT is used to treat tumors using homogenous doses of 20 Gy over five fractions or 30 Gy over 10 fractions, with a low toxicity profile and a short duration of treatment.2-4 Bulky voluminous tumors pose challenges even with palliative RT. In these tumors, delivering a homogenous dose presents challenges, such as tumor heterogeneity and radioresistance, owing to the size and volume of the tumor and the large area of irradiation.5
Lattice radiotherapy (LRT) is a form of spatially fractionated radiotherapy (SFRT) in which high-dose areas, called high-dose vertices, are created within the tumor, whereas the rest of the tumor receives conventional doses. This concept evolved from GRID radiotherapy, which is primarily a two-dimensional Cerrobend- or multi-leaf collimator-based delivery system, and showed efficacy in large tumors (> 8 cm).6 LRT provides a highly customizable peak–valley dose distribution that provides the tumoricidal benefits of high dose volumes. This triggers an antitumor immune response while countering the inhomogeneous and hypoxic areas of large tumors.7, 8 LRT ensures that a high therapeutic ratio is achievable within the tumor, with the intent of treatment being palliative and ensuring patient comfort. Many studies have evaluated the feasibility of LRT for the palliation of lung and gynecological tumors.9-12
SFRT began with GRID therapy in the 90s; the radiation beam was filtered through a heavy metal block to deliver beamlets. With time, GRID therapy evolved into LRT, as the former had considerable physical and dosimetric challenges due to the use of a GRID block. The advent of multi-leaf collimators has enabled a more adaptable and precise approach compared to conventional two-dimensional radiotherapy.13, 14 Two new trials, the LITE SABR M1 and LATTICE_01, provided supporting evidence for the practice of LRT.5, 15 LRT is now practicable, and the Radiosurgery Society put forth a white paper by the GRID/LATTICE, microbeam, and FLASH radiotherapy Working Group.16 The future of LRT is with immunotherapy to ensure the best palliation outcomes in patients with metastatic disease. Studies have shown that this combination increased immune responses. In addition, targeting hypoxic areas and placing vertices in these areas can mitigate radioresistance in addition to other mechanisms, including the bystander effect.17
This study aimed to assess the feasibility of planning LRT using volumetric-modulated arc therapy (VMAT) in patients with large tumors (> 8 cm) treated using palliative radiotherapy at our institute.
2 MATERIALS AND METHODS
This retrospective dosimetric feasibility study was conducted at the Department of Radiation Oncology in Kasturba Medical College, Manipal. Ten patients with large bulky tumors (> 8 cm) who underwent palliative radiotherapy were selected for LRT planning. All patients received palliative radiotherapy with supportive care.
Patients were assessed for palliative radiotherapy according to standard practice methods. Radiotherapy simulation was based on the site of the lesion. Patients were simulated based on the site of treatment, and a breath-hold technique was used when required for patients with abdominal and hepatic lesions. Planning computed tomography was performed using intravenous contrast based on creatinine clearance. Triple-phase contrast scans were performed for liver lesions. All hepatocellular images were acquired using breath control with an active breathing coordinator, either a deep inspiratory or deep expiratory breath-hold. The treatment was planned and patients received a palliative dose of 20 Gy over 5 fractions. The gross tumor volume (GTV) was given a 5-mm margin to create a planning target volume (PTV) and to deliver 20 Gy over five fractions.
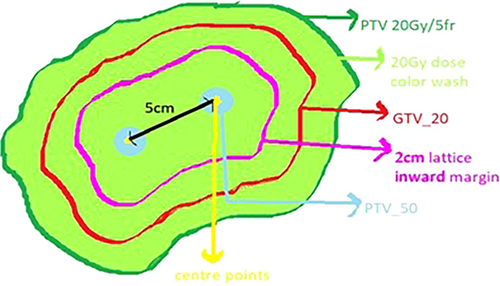
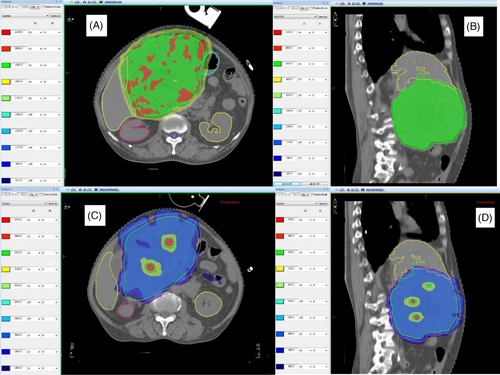
For LRT, a 2-cm inward margin was created using the periphery of the GTV to place high-dose vertices within this central volume. A 1-cm grid was placed over the tumor, and small points were placed at 5-cm distances and at least 3 cm apart on axial slices. These formed the center of high-dose vertices. High-dose vertices were generated using a margin of 0.75 mm all around the small points, generating a globular volume of 1.5 cm in diameter. This high-dose vertex was labelled PTV_50 for non-hepatic tumors and PTV_35 for hepatic tumors. The position and number of high-dose vertices were verified using sagittal and coronal sections to ensure the distance from one center to another, and any high-dose volume projecting out of the 2-cm inward margin was cropped out (Figure 1). The method adopted for LRT was adapted from that of Wu et al. and Duriseti et al.7, 17As described by Wu et al., the placement of vertices depends on the size and shape of the tumor and other factors, such as the preference to avoid any vital structures. Wider tumors tend to accommodate more vertices, whereas elongated tumors have a limited scope for vertex placement. They have recommended high-dose vertices to measure 0.5–1.5 cm in diameter, be created and distributed within the GTV, and be separated by 2.0–5.0 cm from one another (center-to-center).
Duriseti et al. have documented the geometrical arrangement of spherical vertices, each with a diameter of 1.5 cm, 6-cm center-to-center spacing, and separation of 3.0 cm between each successive axial plane of spheres. They followed these principles in their Phase I trial on lattice Stereotactic Body Radiotherapy (SBRT) for large tumors.
Both approaches utilize an inward margin of approximately 2 cm from the GTV to limit high-dose vertices within this volume. We followed the second method of vertex placement.The five non-hepatic sites were prescribed 50 Gy divided into five fractions to high-dose vertices, whereas the five hepatic sites were planned to be administered a dose of 35 Gy over five fractions to high-dose vertices. Organ-at-risk (OAR) dose constraints were followed based on the five-fraction UK stereotactic ablative body radiotherapy (SABR) plan constraints.16 The entire tumor was administered a dose of 20 Gy over five fractions prescribed to the PTV. The number of high-dose vertices varied from 1 to 14 (average of 4) based on tumor volume and width. The wider tumors can accommodate more vertices in each plane.
A dual-arc volumetric modulated arc therapy (VMAT) plan was generated for the above treatment volumes using a 6-MV beam energy on the Monaco Treatment Planning System Version 5.11. Noncoplanar beams/arcs were not utilized. Plans were generated to ensure a PTV dose coverage of 95% to at least 95% of the volume. Within the high-dose PTV, high-dose points up to 107% were accepted. Palliative RT plans of 20 Gy over five fractions were generated using three dimensional conformal radiotherapy (3DCRT) for non-hepatic sites and VMAT for liver lesions also generated lattice plans for the five patients with hepatic lesions using 20 Gy for the entire GTV and 50 Gy to high-dose vertices divided over five fractions.
Ten patients were randomly selected based on tumor size and treatment over the last year. Ethical clearance was not needed due to the dosimetric nature of the study. The target dose coverage, lattice composite, selectivity, and Gradient Index were calculated as described by Duriseti et al.17 The lattice composite is defined as PTV_50 divided by GTV_20 and denotes the tumor volume filled by high-dose vertices. Selectivity was defined as the volume receiving 50 Gy within PTV_50 divided by the volume receiving 50 Gy. The gradient index was calculated as the volume receiving 50% of the treatment isodose divided by the volume encompassed by 100% of the treatment isodose. The doses achieved by the PTV of 20 Gy and at-risk organs were compared between the lattice and palliative-treatment plans using the t-test. Statistical significance was set at p <0.05.
Patient identities were concealed because of the dosimetric nature of the study; all data were obtained through a planning system using radiation chart numbers, and ethical approval was not needed.
3 RESULTS
Ten patients treated with palliative radiotherapy between January and December 2023 were included in this study. Table 1 shows details regarding tumor sites and volumes. The treated sites included soft tissue metastases to the neck, lungs, abdomen, pelvis, and liver. Hepatocellular carcinoma (HCC) was the most common diagnosis, with the liver being the most common site (n = 5). The mean lesion volume was 1103 cc (352–3173 cc). The maximum tumor size in any dimension was 16 cm.
| Sl. No | Age | Sex | Diagnosis | Site treated | Tumor size | Tumor volume | RTdose | Technique |
|---|---|---|---|---|---|---|---|---|
| 1 | 33 | F | Metastatic cystosarcoma Phylloides | Left lung, lower lobe | 13.7 cm x8.0 cm x16.2 cm | 905 cc | 20 Gy / 5 fr | 3DCRT |
| 2 | 65 | F | Ca endometrium with vault recurrence | Hypogastric lesion | 19.0 cm x12.4 cm x11.8 cm | 1086 cc | 20 Gy / 5 fr | 3DCRT |
| 3 | 14 | M | Metastatic Ewing sarcoma | Lung metastases | 8.7 cm x8.2 cm x10 cm | 968 cc | 30 Gy / 10 fr | 3DCRT |
| 4 | 79 | F | Ca oropharynx | Neck nodal metastases | 13.7 cm x7.2 cm x5.8 cm | 352 cc | 20 Gy / 5 fr | VMAT |
| 5 | 73 | M | Metastatic soft tissue sarcoma | Pelvic bone | 9.2 cm x8.9 cm | 820 cc | 20 Gy / 5 fr | 3DCRT |
| 6 | 30 | F | Metastatic adrenocortical carcinoma | Primary and hepatic metastases | 20 cm x16 cm x15 cm | 3173 cc | 35 Gy / 5 fr | VMAT |
| 7 | 72 | F | Hepatocellular carcinoma (HCC) BCLC B | Hepatic lesion | 9.3 cm x9.6 cm x10.9 cm | 522 cc | 35 Gy / 5 fr | SBRT-VMAT (FFF) |
| 8 | 60 | M | HCC BCLC B, HKLC IIIB | Hepatic lesion | 13.3 cm x 11.5 cm x9.6 cm | 1477 cc | 35 Gy / 5 fr | VMAT (FFF) |
| 9 | 55 | M | Metastatic HCC | Hepatic lesion | 6.8 cm x7.1 cm x10 cm | 382 cc | 25 Gy /5 fr | VMAT (FFF) |
| 10 | 76 | M | HCC BCLC B | Hepatic lesion | 13.4 cm x10.1 cm x12.5 cm | 1347 cc | 35 Gy / 5 fr | VMAT (FFF) |
- Abbreviations: 3DCRT, 3DConformal Radiotherapy; BCLC, Barcelona Clinic Liver Cancer (BCLC) Staging System; F, Female; FFF, Flattening Filter Free; HCC, Hepato cellular carcinoma; HKLC, Hong Kong liver cancer (HKLC) staging system; M, Male; VMAT, Volumetric Modulated Radiotherapy.
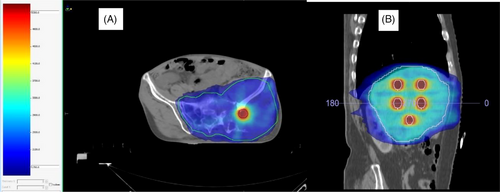
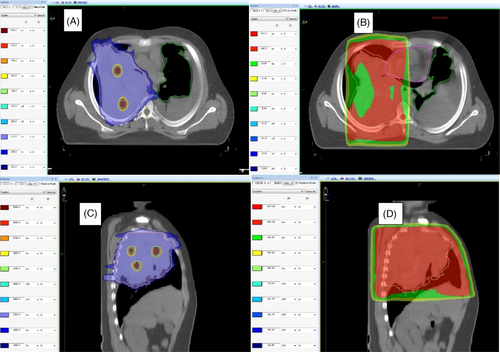
Doses achieved by tumor volumes and indices are summarized in Table 2. The number of high-dose vertices ranged from 1 to 14. Two patients had only one vertex owing to tumor shapes. All ten lattice plans were assessed for dosimetric parameters, such as V95% and V107%, and were found to have adequate target volume coverages of > 95% in all cases except one (88% to achieve organ constraints). All patients had a lattice composite of less than 2%, and it was less than 1% in 7 of the 10 patients. The selectivity observed in this study ranged from 59% to 94%. Nine of the 10 plans had a selectivity > 70%. Figure 2 shows the dose coverage of the lattice plan in a patient with HCC and in another with metastatic soft tissue sarcoma in the pelvis. Figures 3 and 4 show the comparison between conventional and lattice RT plans for two patients: one with metastatic Ewing sarcoma and a lung mass and the other with HCC.
| V95% | V100% | V100% | |||||||||
|---|---|---|---|---|---|---|---|---|---|---|---|
| Case SL.NO | Number of high-dose vertices | PTV_20 | PTV_35/PTV_50 | GTV_20 | PTV_20 | PTV_35/PTV_50 | PTV_20 | V107% | Lattice composite () | Selectivity ) | Gradient score (PTV50) |
| 1 | 5 | 96% | 93% | 99.8% | 99.5% | 3.4% | 2.9% | 4%; 0.7cc | 1.7% | 59.4% | 131.5 |
| 2 | 3 | 96% | 92% | 99.9% | 99.42% | 4.39% | 3.3% | 54%, 6.9cc | 1.2% | 83.5% | 14.66 |
| 3 | 2 | 95% | 95% | 99.98% | 98.62% | 3.13% | 2.3% |
65% 3.9cc |
0.6% | 90% | 39.99 |
| 4 | 1 | 99% | 99% | 100% | 99.64% | 3.7% | 2.39% | 0 | 0.7% | 97% | 45.69 |
| 5 | 2 | 98% | 97% | 98.7% | 94.82% | 0.4% | 0.3% | 0.001%; 0.02cc | 0.66% | 72.5% | 68.22 |
| 6 | 14 | 96% | 97% | 97.93% | 90.35% | 1.55% | 1.16% |
11% 5.6cc |
1.6% | 86% | 106.28 |
| 7 | 2 | 88% | 100% | 91.52% | 75.97% | 1.59% | 1.13% | 11%;0.7cc | 0.8% | 94% | 100.34 |
| 8 | 5 | 95% | 97% | 98.14% | 94.49% | 0.49% | 0.37% | 1% 0.1cc | 0.9% | 72% | 231.58 |
| 9 | 1 | 100% | 98% | 98.29% | 93.61% | 0.66% | 0.44% | 16%; 0.4cc | 0.65% | 86% | 295.82 |
| 10 | 5 | 99% | 97% | 99% | 96.32% | 1.32% | 1.02% | 19%; 3cc | 0.92% | 87% | 129.53 |
- Abbreviations: GTV, Gross tumor volume; PTV, Planning Target Volume.
All plans met the recommended dose constraints. We compared OAR doses between lattice and routine plans and found that the lattice technique achieved similar normal tissue doses in liver and non-liver cases, as shown in Tables 3 and 4. We compared the dosimetry between lattice and conventional plans for the organ and found it insignificant. Additional plan parameters, indices, valley–peak ratios, and mean doses are listed in the appendix (Tables 1, 2 and 3). We also generated lattice plans for five patients with hepatic lesions using 20 Gy to the entire GTV and 50 Gy to high-dose vertices divided into five fractions (Appendix Table 3). We did not find significant differences in OAR doses between conventional RT and lattice plans using 35 Gy to the vertices.
| Sl No | Organ | lattice radiotherapy dose | Conventional palliative radiotherapy dose |
|---|---|---|---|
| 1. | Duodenum D0.1 cc | 20 Gy | 20 Gy |
| Stomach D0.1 cc | 20.9 Gy | 22.9 Gy | |
| Liver-GTV mean | 11.2 Gy | 11.4 Gy | |
| Liver V21 Gy | 4 cc | 500 cc | |
| Spine Dmax | 15 Gy | 15 Gy | |
| Bowel 0.5 cc | 20 Gy | 23 Gy | |
| Kidney_L mean | 9 Gy | 8 Gy | |
| Kidney _R mean | 10 Gy | 11 Gy | |
| 2. | Duodenum D0.1 cc | 0.6 Gy | 0.7 Gy |
| Stomach D0.1 cc | 9 Gy | 11 Gy | |
| Liver-GTV mean | 5 Gy | 6 Gy | |
| Liver V21 Gy | 13 cc | 0 cc | |
| Spine Dmax | 9 Gy | 11 Gy | |
| Bowel 0.5cc | 0.5 Gy | 0.7 cc | |
| Kidney_L mean | 0.2 Gy | 0.3 Gy | |
| Kidney _R mean | 0.2 Gy | 0.3 Gy | |
| 3. | Duodenum D0.1 cc | 21 Gy | 20.5 Gy |
| Stomach D0.1cc | 21 Gy | 20 Gy | |
| Liver-GTV mean | 7.9 Gy | 7.6 Gy | |
| Liver V21Gy | 1299 cc | 0.1 cc | |
| Spine Dmax | 10 Gy | 10.8 Gy | |
| Bowel 0.5cc | 23 Gy | 20.5 Gy | |
| Kidney_L mean | 8 Gy | 5 Gy | |
| Kidney _R mean | 10 Gy | 8 Gy | |
| 4. | Duodenum D0.1 cc | 5.8 Gy | 7 Gy |
| Stomach D0.1cc | 8.6 Gy | 10 Gy | |
| Liver-GTV mean | 9 Gy | 9.9 Gy | |
| Liver V21Gy | 385 cc | 0 cc | |
| Spine Dmax | 12.9 Gy | 12.7 Gy | |
| Bowel 0.5cc | 10 Gy | 10 Gy | |
| Kidney_L mean | 0.2 Gy | 0.3 Gy | |
| Kidney_R mean | 1.7 Gy | 1.9 Gy | |
| 5. | Duodenum D0.1 cc | 22 Gy | 20 Gy |
| Stomach D0.1cc | 14 Gy | 14.9 Gy | |
| Liver-GTV mean | 13 Gy | 13.76 Gy | |
| Liver V21Gy | 1150 cc | 0 cc | |
| Spine Dmax | 12.5 Gy | 10 Gy | |
| Bowel 0.5cc | 22.5 Gy | 20 Gy | |
| Kidney_L mean | 0.4 Gy | 4.7 Gy | |
| Kidney_R mean | 14 Gy | 15 Gy |
| Sl No | Organ | lattice radiotherapy dose(Gy) | Conventional palliative radiotherapy dose (Gy) |
|---|---|---|---|
| 1. | Spinal cord Dmax | 14 | 10 |
| Left lung mean | 9 | 8 | |
| Right lung mean | 4 | 0.4 | |
| Heart mean | 9 | 6 | |
| 2. | Bowel 0.5cc | 25 | 21 |
| Bladder 0.5cc | 27 | 20.9 | |
| Rectum 0.5cc | 23 | 21 | |
| 3. | Heart mean | 12.8 | 19 |
| Lung_R mean | 7.6 | 16.8 | |
| Lung_L mean | 10 | 2.8 | |
| Spinal cord Dmax | 18.4 | 30.9 | |
| 4. | Spinal cord Dmax | 13.4 | 8 |
| Brainstem Dmax | 9 | 7 | |
| 5. | Rectum 0.5cc | 14 | 16 |
| Bladder 0.5cc | 14.5 | 17 | |
| Bowel 0.5cc | 21 | 21 |
4 DISCUSSION
This study evaluated the dosimetric feasibility of the LRT technique in palliative treatment. Lattice VMAT plans using SABR constraints were successfully generated. All plans met the target dose coverage and OAR dose constraint objectives.
SFRT or LRT, a novel method to treat large tumors with heterogeneous doses to trigger better tumoricidal responses, has been explored in a few studies. In 2010, Amendola et al. reported that a large cervical tumor was irradiated using high-dose vertices within low-dose volumes. They reported a complete pathological response and further treated another large ovarian tumor using this technique. In 2019, Amendola et al. reported the safety and efficacy of LRT in bulky, nonoperable non-small cell lung cancers; they treated 10 patients using the LRT technique and demonstrated improved overall survival in otherwise palliative patients.12
Radioresistance in large tumors occurs based on the tumor size, heterogeneous oxygenated and hypoxic areas within the tumor, and challenges in radiotherapy treatment in large fields. Achieving the high doses required to target these tumors is challenging because of tumor characteristics and size. LRT is thought to function via various mechanisms where the tumoricidal effect is augmented using immunomodulation triggered by heterogeneous doses, microvascular changes, and bystander effects.19, 20 This led to the hypothesis that boosting hypoxic tumor areas with higher doses, either through tumor oxygen mapping using positron emission tomography with hypoxia-specific tracers or using electron paramagnetic resonance spectroscopic probes, may be a more direct way of utilizing peak–valley dose distributions. Ferini et al. attempted a metabolism-guided LRT, in which high-dose regions were focused on areas with higher 18-FDG uptake or to a super-avid positron emission tomography area; they demonstrated improved quality of life and relief of symptoms in 30 patients treated using this technique for palliation.5 Studies have also investigated the combination of LRT with immunotherapy and have shown a favorable response in metastatic non-small cell lung cancers, multiple brain metastases, and HCCs.8, 21-23
The current study verified the dosimetric feasibility of LRT VMAT planning and found it to be dosimetrically feasible with excellent sparing of OAR, on par with routine palliative radiotherapy. Wu et al. compared the two-dimensional GRID with lattices in lung and pancreatic tumors using coplanar and non-coplanar plans.24The OAR doses were lower in the lattice plans with high-dose vertices and peak and valley distributions. Kavanagh et al. reported the dosimetric outcomes of the LITE SABR M1 study in which 22 patients were treated using lattice SBRT. All OAR and target constraints were met, except in the left bronchus of one patient.15
Duriseti et al. have recently published their experience with SFRT in various tumors, in which they planned a dose of 20 Gy for the whole tumor and 66.7 Gy for high-dose vertices. That was a retrospective study demonstrating dosimetric and technical feasibility using quality assurance procedures.17 They conducted a phase I study with good physician-reported outcomes for the same prescribed dose and deemed it clinically feasible. They had only one > grade 3 toxicity case possibly associated with radiotherapy. The correlated Patient-Reported Outcomes version of the Common Terminology Criteria for Adverse Events (PRO CTCAE) data showed that patients did not experience increased toxicities with LRT, except for one patient who experienced severe anxiety and nausea. Patient-Reported Outcomes Measurement Information System(PROMIS) scores also showed improved quality of life in terms of physical activity, global health, anxiety, and depression post-LRT. They even correlated LRT with changes in cytokine levels pre- and post-LRT, indicating that a measurable immune-mediated response to LRT might be present.15 Duriseti et al are currently recruiting patients for subsite-specific LRT (NCT 04553471).
The ASTRO guidelines recommend doses of 30–40 Gy divided into five fractions for patients with Child–Pugh B7 scores and doses of 40–50 Gy over 3–5 fractions for patients with Child–Pugh A scores. Our study focused on patients with large hepatic tumors receiving RT with palliative intent; hence, a smaller dose of 25–35 GY over 3–5 fractions was utilized as per the recommendations.25, 26
Furthermore, owing to the radiosensitive nature of HCC, there may not be a dose–response relationship for doses ranging 30–60 Gy administered over 3–5 fractions with biologically effective dose(BED) ranging anywhere between 60 and 180 Gy providing adequate local control, whereas for liver metastases, BED > 100 Gy yields higher local control than lower doses.27, 28
In our study, the lattice contouring protocol was based on that reported by Wu et al. and Duriseti et al. Consensus in the literature regarding the placement of vertices and dose limit for high-dose vertices is absent.29 High-dose vertices in most studies vary from 8 to 25 Gy per fraction, whereas the valley dose varies from 2 to 5 Gy. The Radiosurgery Society has provided dosimetric recommendations for Cerrobend or MLC-based grid therapy. Planning considerations and recommendations for LRT are lacking, and consensus regarding the reporting of LRT is absent.16 Wu et al. have recommend reporting the lattice volume (VL); vertices–GTV volume ratio, peak dose prescribed to the vertices (Dp) and the maximum vertex dose (D max), minimal dose between the vertices (valley dose); DVHs of the total vertices, GTV, CTV/ITV, PTV, VL, and all relevant critical structures; and VPDR defined as D mean (95–100)/Dp of VL; EUDa = -10. However, Duriseti et al et al. consider this form of reporting as insufficient, and additional SFRT metrics DR and DR_1.5, that is, the ratio of mean doses of the high-dose PTV and PTV_AVOID structures and the ratio of the median dose and standard deviation dose within a 1.5-cm ring immediately outside the PTV_6670 spheres, respectively, were reported in their LITE SABR M1 trial.15 In an earlier paper, Duriseti et al. have reported the gradient index, selectivity, and lattice composite.17 A recent study has replaced the traditional peak-to-valley dose ratio with D10/D90, which is the ratio of doses covering 10%–90% of the GTV.30
Ertan et al. have calculated the valley–peak ratio as the ratio of the mean dose of the lattice volume to the mean dose of the high-dose vertices.31 Wu et al. and Zhang et al. recommended that the valley–peak ratio be calculated as the ratio of the DMean of the lattice volume to the prescribed peak dose(Dp) and D90/D10, respectively. With an increasing separation between the vertices and smaller vertex diameters, the valley–peak ratio decreases.
In our study, we calculated the valley–peak dose ratio as given by Kavanaugh et al and Zhang et al: Dp/Dmean (95%–100%) in their studies on planning design for LRT that was also used for their LITE SABR M1 Phase I trials.
Wu et al. identified two retrospective studies where varying vertex sizes were utilized (0.8–1.5 cm in diameter). Generally, smaller vertex diameters are used for small tumors. In a dosimetric study by Ertan et al. on varying vertex diameters (1–2 cm) with varying separation between vertices in two different tumor sizes and comparison of the CyberKnife and VMAT plans, as the vertex diameter and separation increased, the valley–peak ratio decreased for both the CyberKnife and VMAT plans for a smaller GTV. For a larger GTV, as the vertex diameter increased, the valley–peak ratio increased for both the CyberKnife and VMAT plans. Hence, they reported that the valley–peak ratio was affected by varying the vertex diameter, vertex separation, and volume.31
We used a uniform diameter and separation between the high-dose vertices for uniformity in planning and reporting. In addition, this study represents our attempt to establish dosimetric feasibility; hence, adhering to a set of guidelines was preferable.
This study contributes to the literature by demonstrating the feasibility of this novel technique. However, our study is limited by its retrospective and dosimetric design. We plan to prospectively implement this technique in patients requiring palliative radiotherapy at our institute.
5 CONCLUSIONS
LRT is technically and dosimetrically feasible. It provides a promising option for treating patients with large, bulky tumors and may contribute to improving the quality of life of these patients.
ACKNOWLEDGMENTS
The authors have nothing to report.
CONFLICT OF INTEREST STATEMENT
The authors declare no conflicts of interest.
FUNDING INFORMATION
The authors received no specific funding for this study.
ETHICAL STATEMENT
Not applicable.
PRESENTATIONS
None.
Open Research
DATA AVAILABILITY STATEMENT
Date is available on request.


