3D gamma analysis between treatment plans for nominally beam-matched medical linear accelerators using PyMedPhys
Abstract
Beam-matched linear accelerators (linacs) enable flexible patient scheduling and efficient treatment delivery in the event of unexpected machine downtime. The purpose of this study was to test the feasibility of 3D gamma index as an additional metric beyond standard measurement-based comparisons for more efficient evaluation of treatment plans between linacs with nominally matched beam models to ensure safe patient transfer. Seventeen 3D conformal radiotherapy (3DCRT) plans and thirty-six volumetric-modulated radiation therapy (VMAT) plans for different disease sites were selected from the original linac. An in-house script was used to automatically create new plans for the target linac and calculate dose using parameters of the original plans. 3D gamma analysis was performed to compare plan dose distributions between the target and original linacs using PyMedPhys. The 2%/2 mm gamma pass (γ≤1) rate was >99.99% for all 3DCRT plans. The median 1%/1 mm pass rate was 99.86% but two cases failed (< 90%). For VMAT plans, the median and minimum 2%/2 mm gamma pass rates were 99.43% and 93.81%. For 1%/1 mm, the median pass rate was 92.02% but ten cases failed. The results indicated using 3D gamma index can enhance the confidence and add an extra layer for safe patient transfer.
1 INTRODUCTION
In a comprehensive radiation therapy center, usually multiple medical linacs with identical beam models are installed. During the acceptance tests and commissioning, manufacturer engineers and medical physicists work together to tune the beams to make their dosimetric characteristics match each other within acceptance tolerances of predefined criteria. This procedure is called “beam matching.” The primary purpose of beam matching is to ensure full interchangeability of these linacs in clinical practice. There are different ways to implement beam matching. A simple and straightforward approach is first to commission a linac and use its beam characteristics as the reference (standard), and then to tune other linacs to make their dosimetric characteristics match (identical to) the reference linac within the acceptable tolerances.1 Another common method is to use the average of measured data from multiple linacs to be matched as the reference for beam matching.2 Moreover, some linac manufacturers can provide a standard dosimetric dataset (called “golden beam data”) for a specific linac model as the input of the treatment planning system (TPS) for beam modeling.3 The beam matching procedure in this approach is tuning all linacs of the same model to ensure the measured beam data is identical to the golden beam data within the tolerances. Different beam matching procedures have been described in previous literature.1, 2, 4-20
In our clinic, two Varian TrueBeam linacs (Varian Medical Systems, Palo Alto, CA, USA) were installed separately with different hardware configurations. They are labelled as “TrueBeam B” (older) and “TrueBeam C” (newer). The beam data commissioning followed the recommendations of the American Association of Physicists in Medicine (AAPM) Task Group (TG) Report No. 106.21 The absolute doses from the linac were calibrated according to the AAPM TG-51 protocol and its addendum.22, 23 The commissioning and quality assurance (QA) of TPS dose calculations and validations followed the recommendations of AAPM Medical Physics Practice Guideline 5.a.24 The commissioning of intensity-modulated radiation therapy (IMRT) program followed the recommendations of AAPM TG Report No. 119.25 The linac QA program was established following the recommendations of AAPM TG Report No. 14226 and its updated implementation guide from the AAPM TG Report No. 198.27 During the commissioning of TrueBeam C, we performed a comprehensive comparison of dosimetric characteristics with TrueBeam B. We also conducted patient-specific quality assurance (PSQA) following the guideline of AAPM TG Report No. 218,28 including portal dosimetry and measurements using Delta4 phantom+ (ScandiDos, Uppsala, Sweden), on both linacs for the same treatment plan. Different cases covering most disease sites were chosen to evaluate the interchangeability of these two linacs. Beyond measurements, we performed a novel 3D gamma analysis between treatment plans from these two linacs. The purpose of this study was to test the feasibility of 3D gamma index as an additional metric for more efficient evaluation of treatment plans between linacs with nominally matched beam models to ensure safe patient transfer. Based on the systematic analysis results, a cautious patient transfer protocol was established, and it was comprehensively assessed prior to the clinical practice.
2 MATERIALS AND METHODS
2.1 Criteria of Varian beam matching
The manufacturer Varian defined two types of beam matching criteria for linacs of the same machine model: “basic” and “fine,” as described by Hrbacek et al.4 In this work, we only focused on the fine beam matching for photon beams because of the higher stringency. Here we restate these criteria of fine beam matching for evaluating percent depth dose (PDD) curves and lateral dose profiles. The depth of the maximum dose (dmax) along the central axis in water shall be within ±1.5 mm of the average. The relative dose at the depth of 10 cm (PDD10) in water on the central axis should be within ±0.5%. For photon transversal profile measurements, the dose at any point within the central 80% of the field width (defined as the distance between 50% dose points bilaterally with dose at central axis normalized to be 100%) at the depth of 10 cm in water shall be within ±2% of the average of measured values at that point. Above criteria are applied to beam matching for more than two linacs. Because only two linacs were investigated in this study, we modified the criteria to directly compare the differences between them, rather than comparing the data from each linac with their average.
In the TPS plan dose calculation, an output factor (beam energy and field size specific) is used to convert the relative dose to an absolute dose, in the units of cGy, from a specified monitor unit (MU). Therefore, comparing absolute dose with the same MU from beam models of different linacs can more accurately reveal the dose difference in treatment planning. In this study, we compared the absolute dose distributions, including depth dose curves and lateral dose profiles with 100 MU for each beam configuration, following the same acceptance criteria of relative dose-based beam matching.
2.2 1D gamma analysis of beam modeling data
Four photon beams are available in our TrueBeam linacs: 6 MV, 6 MV flattening filter free (FFF), 10 MV FFF, and 15 MV. They are labelled as 6X, 6FFF, 10FFF, and 15X in this report. The Eclipse TPS (Version 16.1, Varian Medical Systems, Palo Alto, CA, USA) is used in our clinic. For TrueBeam B, the PDDs and lateral profiles were acquired using an ionization chamber PTW0.125cc from PTW (Freiburg, Germany) in a Blue Phantom water tank from IBA Dosimetry (Schwarzenbruck, Germany) using a source-to-surface distance (SSD) of 100 cm setup. An EDGE detector from Sun Nuclear (Melbourne, FL, USA) was used for small field scanning (field size < 3 cm × 3 cm). For TrueBeam C, the PDDs and lateral profiles were acquired using an ionization chamber CC13 from IBA in a Blue Phantom2 water tank from IBA. A microDiamond detector from PTW was used for small field scanning (field size < 3 cm × 3 cm). For both linacs, output factors were measured using an ionization chamber CC13 from IBA with an SSD of 90 cm and the depth of detector center at 10 cm in water. Beam data for analysis were selected from four field sizes: 3 cm × 3 cm, 10 cm × 10 cm, 20 cm × 20 cm, and 40 cm × 40 cm. The transversal (crossline) and axial (inline) dose profiles are identical in Eclipse for beam modeling. Therefore, only the transversal dose profiles were analyzed in this study.
We evaluated the level of agreement of matched beams over absolute depth dose curves and absolute lateral dose profiles at the depth of 10 cm with 100 MU using 1D gamma analysis, which was performed using the open-source software PyMedPhys (version 0.39.3)29 (https://pypi.org/project/pymedphys/) developed by Biggs et al. The dose threshold value was set to 10% of the maximum dose in the reference dataset for global gamma index (γ) calculation. The criteria (2%/2 mm) and (1%/1 mm) were used in the gamma analysis, respectively. The beam dataset from TrueBeam B was used as reference and TrueBeam C as evaluation. The dose differences (both local and global) at any point within the central 80% of the field width of lateral profiles were also calculated.
2.3 Dosimetric properties of multi-leaf collimators in Eclipse treatment planning system
The transmission factor and dosimetric leaf gap (DLG) values of multi-leaf collimators (MLCs) were measured for the four available photon beams following the instructions provided by Varian2 using a Farmer-type ion chamber (TN30013, SN 0212) from PTW and used as input to Eclipse. The transmission factors and DLG values of these two linacs were compared for each photon beam energy.
2.4 Selection of treatment plans for comparison
In addition to evaluating the dosimetric characteristics of beam modeling data, we also evaluated the interchangeability of these two linacs using patient treatment plans. Seventeen 3D conformal radiotherapy (3DCRT) plans and thirty-six volumetric-modulated arc therapy (VMAT) plans for different disease sites were selected from the original linac, which could be TrueBeam B or TrueBeam C. An in-house script was used to automatically create new plans for the target linac and calculate dose using the same parameters as the original plans. All the plans were generated using Eclipse and calculated using the anisotropic analytical algorithm (AAA_161). The basic plan information, such as disease site, original TrueBeam, beam energy, prescribed dose per fraction, and number of fractions were listed in Table S1 for 3DCRT plans and Table S2 for VMAT plans in the Supplementary Materials.
2.5 3D gamma analysis
3D gamma analysis was performed to compare plan dose distributions between the target linac (evaluation) and the original linac (reference) using the open-source software PyMedPhys (version 0.39.3). The dose threshold value was set to 10% of the maximum dose in the original plan for global gamma index (γ) calculation. The criteria (2%/2 mm) and (1%/1 mm) were used in the gamma analysis, respectively, for each pair of reference and evaluation plans. These criteria were more stringent than the criteria of (3%/2 mm) as recommended by the AAPM TG Report No. 218 for PSQA.28
2.6 Data analysis of 3D gamma pass rate
The Origin software (version 2021b) was used for data analysis and plotting of the 3D gamma analysis results. 3DCRT plans and VMAT plans were analyzed separately. The results are presented in box charts including the range of gamma index from all plans as well as the mean, median, and standard deviation. In the plots, outlier data points were marked explicitly. Outliers of a dataset were those data points outside the range of 1.5 × interquartile range (IQR) from the first quartile and the third quartile.
3 RESULTS
3.1 Basic beam modeling data
According to the acceptance criteria of fine beam matching by Varian, dmax and PDD10 were evaluated.
The dmax values with field size of 10 cm × 10 cm of TrueBeam B and TrueBeam C were equal for each photon beam. They are 1.5 cm, 1.5 cm, 2.4 cm and 3.0 cm for 6X, 6FFF, 10FFF, and 15X, respectively. PDD10 values of different field sizes are listed in Table 1. The difference of PDD10 values was between -0.4% to 0.7% for all beams and all selected field sizes, close to the Varian fine beam matching criterion (within ±0.5%).
| PDD10 (%) | 3 cm × 3 cm | 10 cm × 10 cm | 20 cm × 20 cm | 40 cm × 40 cm | ||||||||
|---|---|---|---|---|---|---|---|---|---|---|---|---|
| TrueBeam | B | C | Diff. | B | C | Diff. | B | C | Diff. | B | C | Diff. |
| 6X | 59.9 | 60.4 | 0.5 | 66.1 | 66.4 | 0.3 | 69.2 | 69.7 | 0.5 | 71.7 | 72.0 | 0.3 |
| 6FFF | 56.5 | 57.0 | 0.5 | 63.2 | 63.4 | 0.2 | 66.1 | 66.5 | 0.4 | 67.8 | 68.2 | 0.4 |
| 10FFF | 66.6 | 66.9 | 0.3 | 70.7 | 71.1 | 0.4 | 72.1 | 72.8 | 0.7 | 72.9 | 73.5 | 0.6 |
| 15X | 73.4 | 74.0 | 0.6 | 76.5 | 76.1 | −0.4 | 76.5 | 77.1 | 0.6 | 76.5 | 77.1 | 0.6 |
The output factors of the four available photon beams with the four evaluated field sizes are listed in Table 2. The PDD curve was multiplied by the output factor for each setup of beam energy and field size to obtain its absolute dose curve, in the units of cGy per 100 MU. Both PDD10 and output factor were multiplied to the relative lateral dose profile (normalized at the central axis) at 10 cm to obtain the corresponding absolute lateral dose profile, in the units of cGy per 100 MU. The absolute depth dose curves and lateral dose profiles were then used in the 1D gamma analysis.
| Output factor | 3 cm × 3 cm | 10 cm × 10 cm | 20 cm × 20 cm | 40 cm × 40 cm | ||||
|---|---|---|---|---|---|---|---|---|
| TrueBeam | B | C | B | C | B | C | B | C |
| 6X | 0.832 | 0.832 | 1.0 | 1.0 | 1.105 | 1.102 | 1.191 | 1.183 |
| 6FFF | 0.844 | 0.844 | 1.0 | 1.0 | 1.087 | 1.083 | 1.141 | 1.135 |
| 10FFF | 0.884 | 0.889 | 1.0 | 1.0 | 1.049 | 1.048 | 1.079 | 1.076 |
| 15X | 0.847 | 0.846 | 1.0 | 1.0 | 1.068 | 1.068 | 1.121 | 1.118 |
3.2 1D gamma analysis for absolute depth dose curves and lateral dose profiles
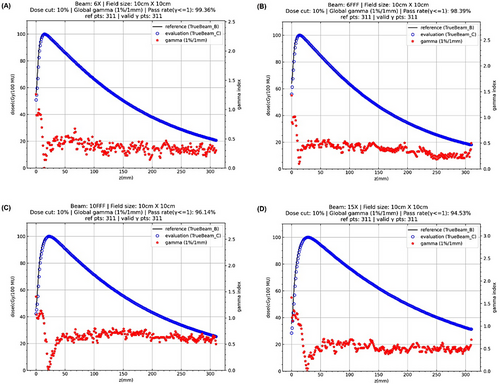
1D gamma analysis (1%/1 mm) results of absolute dose curves along the central axis with the field size of 10 cm × 10 cm for four available photon beams are illustrated in Figure 1. 1D gamma (1%/1 mm) index values and absolute depth dose curves of other field sizes are illustrated in the Supplementary Materials. 1D gamma (1%/1 mm) pass rates of absolute depth dose curves for all photon beams and all four field sizes are listed in Table 3. The lowest gamma (1%/1 mm) pass rate was 94.53% for 15X with field size of 10 cm × 10 cm. The gamma pass rate was higher than 95% for all other setups. In contrast, the gamma pass rate was 100% for all setups when the criteria of 2%/2 mm were used.
| gamma pass rate (%) | 3 cm × 3 cm | 10 cm × 10 cm | 20 cm × 20 cm | 40 cm × 40 cm |
|---|---|---|---|---|
| 6X | 100 | 99.36 | 99.68 | 98.39 |
| 6FFF | 100 | 98.39 | 99.68 | 97.75 |
| 10FFF | 100 | 96.14 | 97.11 | 96.14 |
| 15X | 100 | 94.53 | 95.50 | 95.18 |
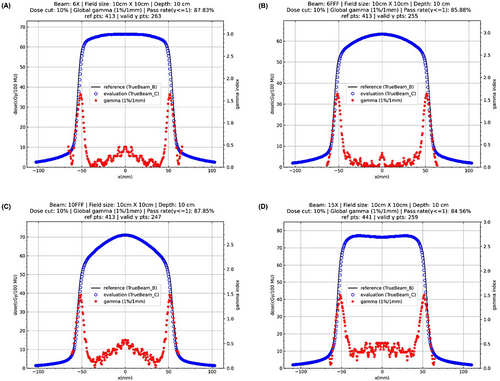
1D gamma analysis (1%/1 mm) results of absolute lateral dose profiles at the depth of 10 cm in water with the field size of 10 cm × 10 cm for four available photon beams are illustrated in Figure 2. 1D gamma (1%/1 mm) index values and lateral profiles of other field sizes are illustrated in the Supplementary Materials. 1D gamma (1%/1 mm) pass rates of lateral profiles for all setups are listed in Table 4, which showed poor gamma pass rates for most setups.
| gamma pass rate (%) | 3 cm × 3 cm | 10 cm × 10 cm | 20 cm × 20 cm | 40 cm × 40 cm |
|---|---|---|---|---|
| 6X | 88.61 | 87.83 | 91.71 | 84.49 |
| 6FFF | 100 | 85.88 | 92.26 | 98.92 |
| 10FFF | 88.61 | 87.85 | 93.12 | 83.69 |
| 15X | 100 | 84.56 | 73.33 | 61.31 |
For the field size of 3 cm × 3 cm, the gamma pass rate was 100% for 6FFF and 15X, and 88.61% for 6X and 10FFF. For the field size of 10 cm × 10 cm, the gamma pass rate was approximately between 85% to 88% for all beams. For the field size of 20 cm × 20 cm, the gamma pass rate was slightly higher than 90% for all beams except 15X whose pass rate was only 73.33%. For the field size of 40 cm × 40 cm, the gamma pass rate was close to 99% for 6FFF, and approximately 85% for 6X and 10FFF, whereas it was as low as 61.31% for 15X. In contrast, the gamma pass rate was 100% for all setups when the criteria of 2%/2 mm were used.
The 1D gamma results with the more stringent criteria of (1%/1 mm) showed that the dosimetric characteristics of beam modeling data from these two linacs were not ideally identical, but they were close to each other. The results with the loose criteria of (2%/2 mm) showed an excellent agreement (100% pass rates).
The local and global maximum dose differences at any point within the central 80% of the field width at the depth of 10 cm in water are listed in Table 5 and Table 6, respectively. For the field size of 3 cm × 3 cm, the local and global maximum dose differences were between approximately -5% to -3%. For other field sizes, the local and global maximum dose differences were within ±2%. Only the results of field size of 3 cm × 3 cm were out of the tolerance of fine beam matching criteria (dose difference within ±2%).
| Local difference (%) | 3 cm × 3 cm | 10 cm × 10 cm | 20 cm × 20 cm | 40 cm × 40 cm |
|---|---|---|---|---|
| 6X | −3.81 | 0.45 | 0.51 | 1.35 |
| 6FFF | −5.22 | −0.46 | −0.41 | 0.68 |
| 10FFF | −3.26 | 0.57 | 0.93 | 1.60 |
| 15X | −4.26 | −0.79 | 1.13 | 2.03 |
- Note: field width is defined as the distance between two lateral 50% dose points. Local dose difference = (Evaluation dose-Reference dose)/Reference dose ×100%
| Global difference (%) | 3 cm × 3 cm | 10 cm × 10 cm | 20 cm × 20 cm | 40 cm × 40 cm |
|---|---|---|---|---|
| 6X | −3.55 | 0.45 | 0.51 | 1.32 |
| 6FFF | −4.85 | −0.41 | −0.32 | 0.49 |
| 10FFF | −2.96 | 0.57 | 0.93 | 1.43 |
| 15X | −3.79 | −0.77 | 1.12 | 2.00 |
- Note: global dose difference = (Evaluation dose-Reference dose)/DCAX ×100%. CAX stands for the central axis.
Based on the comparison of basic beam modeling parameters, 1D gamma pass rate of both depth and lateral dose curves, and dose differences in lateral dose profiles, we conservatively treated these two machines as “nominally-beam-matched” linacs.
3.3 Dosimetric properties of MLCs
Although the dosimetric properties of MLCs were not used in the above beam matching analysis, they are critical in determining the dose distributions in patient treatment plans. The transmission factor and DLG values of MLCs used in Eclipse TPS were compared in Table 7. The transmission factors of TrueBeam C were slightly lower than TrueBeam B, but the DLG values of TrueBeam C were wider than TrueBeam B. The impact of dosimetric properties of MLCs on treatment plans are assessed later in the dosimetric comparison of 3DCRT and VMAT plans from these two linacs.
| Transmission factor | Dosimetric leaf gap (cm) | |||
|---|---|---|---|---|
| Beam | TrueBeam B | TrueBeam C | TrueBeam B | TrueBeam C |
| 6X | 0.0150 | 0.0137 | 0.1200 | 0.1870 |
| 6FFF | 0.0120 | 0.0113 | 0.1030 | 0.1900 |
| 10FFF | 0.0150 | 0.0144 | 0.1290 | 0.2100 |
| 15X | 0.0170 | 0.0162 | 0.1370 | 0.2100 |
3.4 3D gamma pass rate from patient treatment plans
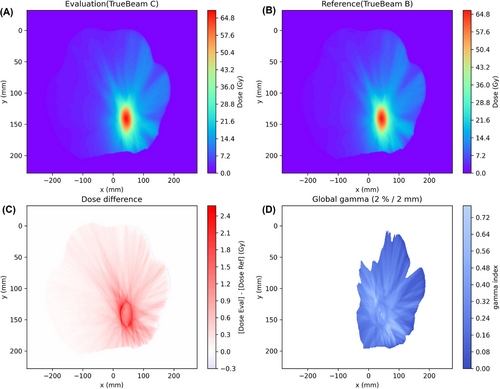
Figure 3 illustrates 3D gamma analysis results using PyMedPhys for a lung patient (No. 40 in Table S2 in the Supplementary Materials) treated with the stereotactic body radiation therapy (SBRT) technique as an example. The dose maps of a selected slice for the target (evaluation) and original (reference) plans were compared. The absolute dose difference and global gamma index (γ) maps were also presented.
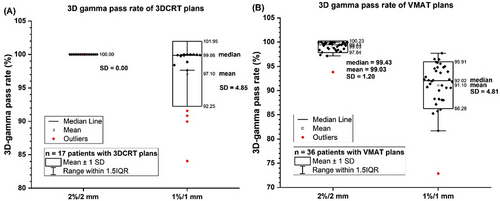
The distributions of 3D gamma pass rate of 3DCRT conformal plans from seventeen patients and VMAT plans from thirty-six patients were illustrated in Figure 4. The gamma pass rates from two criteria 2%/2 mm and 1%/1 mm were presented. The gamma pass rates were listed in Table S1 for 3DCRT plans and in Table S2 for VMAT plans in the Supplementary Materials. The 2%/2 mm gamma pass rate (γ≤1) was >99.99% for all 3DCRT plans. The median 1%/1 mm pass rate was 99.86% but two cases failed (< 90%). For VMAT plans, the median and minimum 2%/2 mm gamma pass rates were 99.43% and 93.81%, respectively. For 1%/1 mm, the median was 92.02% but ten cases failed (< 90%).
4 DISCUSSION
Although the beam matching procedure is labor intensive, there are many advantages to installing beam-matched machines in a radiation oncology department. First and foremost, beam-matched linacs can enable flexible patient scheduling and treatment delivery in the event of unexpected downtime. Beam matching ensures that the patient treatment is consistent regardless of which machine is used. In addition, using beam-matched linacs can facilitate the management of radiotherapy facilities, simplify the training of system operations, reduce risks of mis-operations, and allow for implementation of standardized clinical workflows and physics QA procedures. Ideally, if the dosimetric characteristics of different linacs are identical (within the acceptable tolerances), the same treatment plan can be used across different machines without replanning and repeating PSQA prior to patient transfer. However, it is challenging to ideally match all linacs of the same model especially for those released at different times with different hardware configurations. Linacs of the same model with less optimal or nominally matched beams might also be interchangeable in clinical practice. However, it is critical to perform a comprehensive comparison of dosimetric characteristics of the beams during commissioning. Even though the beam characteristics of these linacs could meet the acceptance criteria of matched beams defined by the manufacturer, full interchangeability might not be guaranteed. Additional treatment plan dose calculation, evaluation, and review can be recommended prior to transferring a patient between linacs. In this study, we performed a systematic comparison of the dosimetric characteristics of two Varian TrueBeam linacs using gamma analysis beyond the requirements of beam matching defined by the manufacturer.
1D gamma analysis with the more stringent criteria of 1%/1 mm showed that these two linacs were not ideally identical, especially for the lateral profiles (see Figure 2 and Table 4), whereas the results from the loose criteria 2%/2 mm showed an excellent agreement (100% gamma pass rates) between these two linacs. The identical dmax and close PDD10 values (see Table 1) indicated these two linacs are approximately beam matched (dmax within ±1.5 mm and PDD10 within ±0.5%). However, the dose difference (see Table 5 and 6) with the small field size of 3 cm × 3 cm did not meet the fine beam matching criterion (within ±2%). As a result, we conservatively treated these two machines only as “nominally-beam-matched” linacs. We had to perform a more comprehensive patient plan evaluation of the full interchangeability of these linacs prior to patient transfer in clinical practice.
In this study, we developed an effective strategy for rapid recalculation of plans intended for transfer using the target linac model with the same plan parameters as in the original linac. The open-source software PyMedPhys has been broadly applied in different medical physics studies.30-36 Sun et al. performed 3D gamma analysis using PyMedPhys to investigate the impact of setup errors on the robustness of VMAT plans for multiple brain metastases.30 In the current study, we further tested the feasibility of 3D gamma analysis for plan dose evaluation for patient transfer validation. The 3D gamma analysis results from seventeen 3DCRT plans and thirty-six VMAT plans showed excellent pass rates for two criteria of 2%/2 mm and 1%/1 mm. The promising results indicated the feasibility of transferring patients between the two “nominally-beam-matched” linacs. Nevertheless, in our clinical practice, a more cautious patient-transfer protocol has been created and evaluated on a plan type and case-by-case basis.
A few more Varian TrueBeam linacs are being commissioned and pending installation in our clinic. We anticipate the 3D gamma analysis method in this report may shed new light on the implementation of beam matching of linacs. Although this study was based on Varian TrueBeam linacs, the methodology can be applied in other linac models from different manufacturers and extended to other modalities such as proton and heavier ion therapy.
One limitation of the present work is that only photon beam data were compared, and only photon-based treatment plans were analyzed. In our future work, we will investigate the feasibility of patient transfer with electron beam-based treatment plans.
5 CONCLUSION
Beyond the comprehensive and robust measurement-based dose comparisons, 3D gamma analysis can be used to efficiently evaluate dose distributions between two treatment plans. Using the 3D gamma index as an additional plan evaluation metric can enhance the confidence for safe patient transfer between linacs of identical models with similar but separate beam models. We hope the approach of 3D gamma analysis can provide an extra layer of safety for treatment of transferred patients.
ACKNOWLEDGMENTS
In memory of our colleague Dr. Fanqing Guo, who made significant contributions to this work and passed away as this report was being completed. The authors would like to acknowledge the Texas Advanced Computing Center (TACC) at The University of Texas at Austin for providing high-performance computation resources that have contributed to the research results reported within this paper. URL: http://www.tacc.utexas.edu
CONFLICTS OF INTEREST STATEMENT
Simon Biggs is currently employed by Anthropic PBC. Other authors declare no conflicts of interest.
FUNDING INFORMATION
The authors received no specific funding for this work.
ETHICAL STATEMENT
Not applicable.
INSTITUTIONAL REVIEW BOARD STATEMENT
Not applicable.
INFORMED CONSENT STATEMENT
Not applicable.
Open Research
DATA AVAILABILITY STATEMENT
The measurement and calculation results in this study are available in tables of this report and the Supplementary Materials.


