Radiation induced liver injury (RILI) evaluation using longitudinal computed tomography (CT) in image-guided precision murine radiotherapy
Abstract
Purpose
We aim to perform image-guided, dose-escalated, well-controlled liver-irradiated animal studies and subsequently evaluate radiation induced liver injury (RILI) using longitudinal CT.
Methods
Eighteen 6–8 weeks mice were divided into three groups: control, 15Gy and 30Gy irradiated groups. The animal protocol was approved by the animal care ethics committee of our institution. Precision radiotherapy started with CT simulation, followed by treatment planning using volumetric modulated arc therapy (VMAT), image guidance with cone beam CT (CBCT) and radiation delivery on a medical linear accelerator. Weekly CT was conducted on the same CT simulator using same scanning parameters. At the end of fifth week, all mice were sacrificed, and histological staining was performed. Body weight, liver volume, HU values and histogram distributions were analyzed.
Results
Body weight of irradiation groups was significantly reduced compared to that of the control group (p<0.05). Liver volume in irradiated groups was reduced too. The average liver HU was significantly reduced in irradiated groups (HU mean = 62±3, 48±6, and 36±8 for the control, 15Gy and 30Gy respectively; p control vs. 15Gy < 0.05, p control vs. 30Gy < 0.05). A linear relationship between liver HU and radiation dose was found. Furthermore, HU histogram changes with time and dose showed not only density but also structure might be affected by radiation. HE and Masson Trichrome staining confirmed histological change and increased collagen deposition in irradiated liver.
Conclusion
Longitudinal unenhanced CT is a useful imaging tool to evaluate the severity and progression of radiation induced liver injury.
1 INTRODUCTION
Radiation induced liver injury (RILI), or radiation induced liver disease (RILD) is a serious complication that may arise from the lower thoracic, upper abdominal, or total body irradiation.1 Despite of technical advances of intensity modulated radiotherapy (IMRT), stereotactic body radiotherapy (SBRT) and proton therapy achieving excellent local control with minimal toxicities,2 RILD is still considered as one of the most devastating consequences and remains a challenge in modern RT.3 RILD may limit the course of cancer therapy, has severe chronic side effects, and is associated with high mortality rates.4 Hence, it is important to investigate the RILD progression not only to facilitate treatment options but also to improve quality of life in patients undergoing effective radiotherapy (RT).
According to radiobiology, the liver parenchyma is a parallel structure with independent subunits to produce bile, metabolize ingested nutrients, eliminate wastes, store glycogen and synthesize plasma proteins. RILD can occur as an acute response within a few weeks of RT or as a late-response months to years after RT. RILD is categorized into classic and non-classic, where classic RILD is the radiation dose-limiting complication with the characteristics of venocclusive disease (VOD), and non-classic RILD is more common clinically in patients with underlying liver disease.5 Risk factors of RILD include Child-Pugh grade B, >800cc liver volume receiving 18Gy, mean liver dose (MLD), and severity of liver cirrhosis.6 It has been reported that the probability of RILD from SBRT was less than 5% because the volume of irradiated liver with high radiation dose is relatively small. Meanwhile, the whole liver irradiation is clinically possible to improve symptoms and quality of life in patients with hepatocellular carcinoma (HCC) or liver metastases (LM).7 Although RILD is considered as the most dreaded toxicity and limits RT use in cancer therapy, yet the underlying mechanism remains unclear,8 which may be obstructed by the lack of well-characterized animal models.9
Rodents have advantages in preclinical RILD models because of their similarity of anatomy, physiology and genetics to humans.9 Wang et al.10 noticed fat accumulation in hepatocytes and increased expression of hedgehog ligands in mouse liver of mice one week after 20Gy total body irradiation (TBI). Alternations of liver morphology and hepatic fibrosis were developed in the repairing process of liver damage from high-dose radiation. However, it is inappropriate for radiation delivery to the whole body of mice because TBI can lead to immunosuppression, endocrine dysfunction and multi-organ failure, which interferes with the RILD investigation. We should adopt hepatic irradiation for the preclinical RILD research. Imaeda et al.11 conducted intraoperative radiotherapy (IORT) in rats in order to confirm the whole liver irradiation. After irradiation, the abdomens were surgically closed, and rats were carefully maintained. The invasive surgical procedures could only help to approximately set up the radiation field to the right upper quadrant of the abdomen instead of conformal to the whole liver. Applying non-invasive imaging to guide the liver-specific radiation seems more reliable in preclinical RILD models. Melin et al.12 incorporated image guided radiotherapy (IGRT) in the mouse model of RILD and discovered radiation-induced mitochondrial DNA instability to produce the late effect of fibrosis. Yannam et al.13 performed dose escalated SBRT experiments in the cynomolgus monkeys, a type of non-human primates, to explore pathogenesis of veno-occlusion disease (VOD) in RILD and to verify safety limits of RT. With IGRT, preclinical RILD research becomes more precise and accurate to mimic clinical settings.
Meanwhile, imaging harbors the potential of longitudinal, quantitative and noninvasive monitoring of tissue microenvironment, which facilitates personalized radiotherapy to ensure patients receiving effective treatment while avoiding normal tissue injury.14 Radiomics extracts quantitative data from medical images that aims to discover imaging biomarkers for clinical evaluation,15 which may help to identify an early sign of normal tissue damage and allow to reoptimize treatment regimen to alleviate RILD. Previously Averts et al.16 reported that radiomics enables decoding tumor phenotypes. Sun et al.17 correlated noninvasive radiomics features to quantitative tumor infiltration of CD8 T cells. Fridman et al.18 summarized immune texture in cancer prognosis and treatment. Braman et al.19 applied intra and peri-tumoral radiomics to predict treatment response using breast MRI. Similar to assessing tumor characteristics, imaging or radiomics is also promising for noninvasive, quantitative and longitudinal evaluation of normal tissue injury.
Previously normal tissue complications were estimated largely based on empirical data or a consensus of experts by Emami et al.20 or QUANTEC21 for partial or whole liver irradiation. The liver is particularly sensitive to radiation, where quantitative and non-invasive imaging is suitable for RILD assessment. In this study, we aim to apply image guidance to precisely deliver dose-escalated radiation to the whole liver and subsequently investigate CT radiomics, body weight, and histopathological changes of RILD.
2 METHODS
2.1 Animal preparation
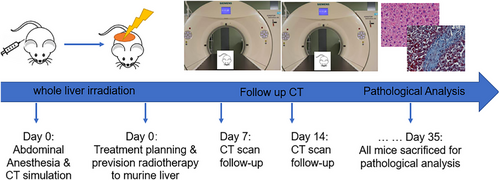
Eighteen 6∼8 weeks old female BALB/c mice were purchased from GemPharmatech Company (Guangdong, China). All mice were given a normal laboratory diet and water ad libitum and were handled according to protocols approved by the animal care ethics committee of Peking University Shenzhen Hospital. Mice were divided randomly into three groups: control, 15Gy irradiation to the whole liver, and 30Gy irradiation to the whole liver (n = 6 mice per group). All mice were watched once daily, weighed twice weekly, and scanned with CT weekly after RT. Prior to RT delivery and CT scans, mice were anaesthetized with ketamine and xylazine (100 mg/kg and 10 mg/kg) by intraperitoneal injection. At the end of fifth week or Day 35, all mice were euthanized via overdose anesthesia. The experimental scheme was shown in Figure 1, 2 .
2.2 Precision radiotherapy
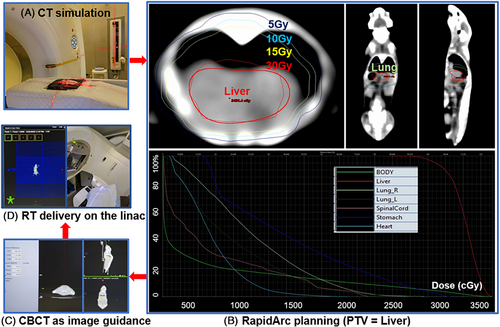
As previously described in Section 2.1 Animal Preparation, all mice were divided into three groups (control, 15Gy, and 30Gy to the whole liver) with n = 6 mice in each group. Mice were anesthetized, immobilized in the prone position, and scanned without contrast agent using a computed tomography (CT) simulator (Siemens, Munich, Germany) with a 512×512 resolution and 0.75 mm slice thickness.
Treatment planning was designed with a clockwise (CW) and a counterclockwise (CCW) volumetric modulated arc therapy (VMAT), i.e. RapidArc, using 6MV photon beams (Eclipse treatment planning system, version 15.6, Varian Medical System, USA). The planning target volume (PTV) was delineated to encompass the whole liver on the abdominal window level. Organs at risk (OAR) of the right and left lung, stomach, heart and spinal cord were also contoured. The prescribed dose was 15 Gy or 30 Gy in a single fraction, with the goal of 95% of PTV receiving the prescribed dose while minimizing dose to OAR. Such dose regimen was chosen because it was safe, convenient, and effective to generate RILD in previously published animal studies.11 On board imaging of cone-beam CT (CBCT) was acquired as image guidance prior to VMAT delivery and six-degree couch shift was conducted for each mouse undergoing RT to achieve precision radiation treatment (TrueBeam linear accelerator, version 2.7, Varian Medical System, USA).
2.3 Histological analysis of liver samples
At the end of fifth week or Day 35 post-RT, all mice were sacrificed to perform hematoxylin and eosin (HE) and Masson Trichome (MT) staining to evaluate liver tissue morphology and collagen content (American Master Tech Scientific). At least two liver tissue sections from each mouse were used to make histological slides, and five fields per slide were randomly selected in each irradiated group study. For all digital imaging, investigators were blinded to all sample conditions. All HE and MT samples were imaged with identical settings on a Leica microscope (Leica Biosystems, Wetzel Gmbh Germany) and quantification was performed using ImageJ software (v.2.0.0, NIH).
2.4 The follow-up CT scans
Unenhanced CT scanning was acquired weekly post RT on the same CT simulator (Siemens, Munich, Germany) with the same image resolution and slice thickness (512×512, 0.75 mm slice thickness). The average Hounsfield units (HU) of the liver and the histogram of HU values were analyzed for each follow-up CT scan. First-order statistics of HU (mean, median, standard deviation, skewness, and kurtosis) were calculated using Python 3.8 and R 4.2.1 (http://www.r-project.org). The liver volume was calculated in the Eclipse treatment planning system (version 15.6). In order to maintain the same standard of contouring pre- and post-RT livers, the window level preset of “Liver” was selected and auto-contouring tool was used. Once the liver was contoured, the liver volume was automatically calculated in TPS by multiplying the voxel volume with the number of voxels enclosed in the liver contour.
HU values used in CT are derived from a linear transformation of attenuation coefficients on density of air and pure water. Skewness is a measure of symmetry or lack of symmetry in the distribution of HU values in liver tissue. For instance, a positive skewness (or right skewed) means more clustered HU values towards the left tail of the distribution while the right tail of the distribution is longer. Kurtosis refers to the proportion of data that is heavy-tailed or light-tailed in comparison with a normal distribution, which is used to find the outliers in our data. Increased skewness and kurtosis may imply more heterogeneous distribution within live parenchyma.22
3 RESULTS
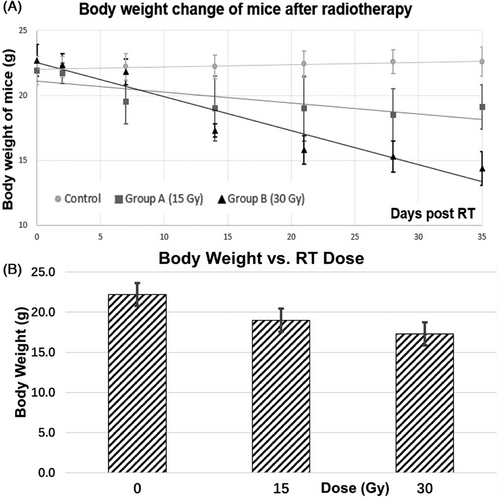
The body weight, the liver volume, mean and median HU, skewness and kurtosis for the control, 15Gy and 30Gy irradiated groups at the end of experiments were summarized in Table 1. Firstly, significant reduction in body weight of the irradiated groups was observed (p≤0.005 for control vs. 15Gy; p<0.001 for control vs. 30Gy). There was also significant weight loss by 25% between the 15Gy and 30Gy irradiated groups (p = 0.01). Secondly, although not statistically significant, the liver volume was substantially reduced in irradiated groups, by 14% and 22% for the 15Gy and 30Gy irradiated groups from the baseline control group, respectively. Thirdly, for follow-up CT image analysis, the average HU value decreased from 62 at the baseline without radiation, to 48 in the 15Gy irradiated group, to 36 in the 30Gy irradiated group. There was significant difference in mean and median HU values between the control and 15Gy irradiated group, as well as between the control and 30Gy irradiated group (both p< 0.05). For skewness and kurtosis of liver HU values, the 15Gy and 30Gy irradiated groups had increased skewness and kurtosis compared to the control group, showing enhanced heterogeneity within liver parenchyma post-RT.
| Weight (g) | Liver volume (cc) | HU mean | HU median | skewness | kurtosis | |
|---|---|---|---|---|---|---|
| Control | 22.2±1.1 | 0.60±0.15 | 62±3 | 64±5 | 22±4 | 496±174 |
| 15Gy | 19.0±1.7 | 0.57±0.12 | 48±6 | 48±2 | 23±4 | 527±166 |
| 30Gy | 17.3±1.3 | 0.34±0.33 | 36±8 | 42±10 | 29±0 | 825±9 |
| control vs. RT15Gy | 0.005* | NS | 0.009* | 0.047* | NS | NS |
| Control vs. RT30Gy | <0.001* | NS | 0.005* | 0.014* | 0.012* | 0.008* |
| RT15Gy vs. RT30Gy | 0.010* | NS | NS | NS | 0.025* | 0.018* |
- * p<0.05: significant (in RED); NS: not significant (p≥ 0.05). n = 6 per group.
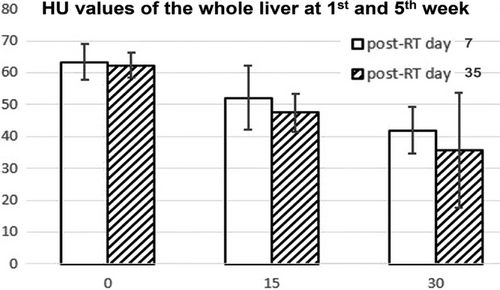
The slope of the 5th week RILD was a little steeper than that of the 1st week, demonstrating reduced tissue density in the liver parenchyma when radiation dose increased, and also more severe liver damage occurred in the later stage of RILD.
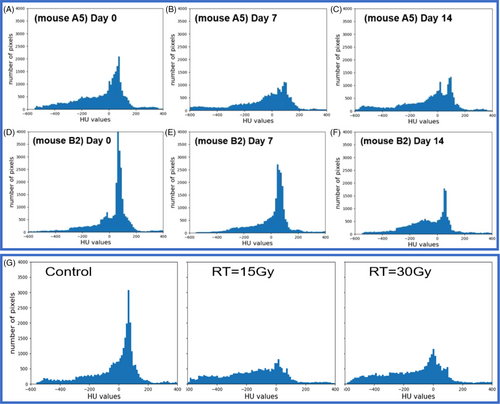
Meanwhile, HU histograms demonstrated the attention or density change in liver parenchyma longitudinally (Figure 5(A-C) for the 15Gy irradiated mouse A5 example and Figure 5(D-F) for the 30Gy irradiated mouse B2 example). In Figure 5(G), the averaged HU histogram (n = 6 per group) showed the irradiated groups had very different distribution of HU values compared to that of the non-irradiated control group.
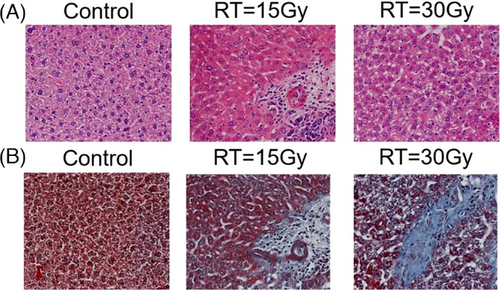
Finally, HE and MT histological images in Figure 6 demonstrated more collagen deposition in the irradiated groups, indicating more fibrosis in liver parenchyma with increased radiation dose.
4 DISCUSSION
We found the mice body weight of the irradiation groups was significantly reduced compared to that of the control group (p<0.05). The average liver HU for the control, 15Gy, and 30Gy irradiated groups were 62±3, 48±6, and 36±8, respectively, where a significant difference was observed between the control and irradiated groups (p control vs. 15Gy < 0.05; p control vs. 30Gy < 0.05). A linear relationship was observed between liver HU and radiation dose. Furthermore, HU histogram changes with time and dose showed not only density but also structure might be affected by radiation, which was confirmed by microscopic changes and increased collagen deposition in irradiated livers shown in the HE and Masson Trichrome staining results. Therefore, longitudinal unenhanced CT is a useful imaging tool to evaluate the severity and progression of radiation induced liver injury.
In this study, an image guided, volumetric modulated arc planned, dose-escalated precision radiation delivery to murine livers was conducted, followed by weekly CT scans to estimate liver tissue damage noninvasively and longitudinally. Eventually mice were sacrificed, and histological staining was performed in non-irradiated and irradiated liver samples. Our results found that the overall density and HU distribution of liver parenchyma had changed with time after irradiation (Figure 5). At the end of our study (i.e., Day 35 post radiotherapy), substantially reduced body weight and liver volume, much lower mean HU with shifted histograms, and more collagen depositions in the liver were observed in the irradiated groups (Figure 6). Specially, although there was no statistically significant difference in liver volume between the non-irradiated and irradiated groups, the mean HU value was significantly decreased in irradiated groups (pcontrol vs.15Gy = 0.009; pcontrol vs.30Gy = 0.005) (Table 1). A linear relationship between weight loss and days post irradiation was observed in both 15Gy- and 30Gy- irradiated groups, while weight in the non-irradiated group had almost no change (Figure 3). Similarly, a linear relationship between liver HU reduction and radiation dose was found, with steeper slope in the 5th week than 1st week demonstrating more aggressive HU reduction or more severe tissue damage developed gradually with time in radiation induced liver injure (Figure 4).
Another contribution of this study was that we quantitatively and longitudinally evaluate the change of voxel-by-voxel HU mapping in liver parenchyma after high-dose liver irradiation. As we all know, SBRT is an emerging, effective, and noninvasive treatment option for lung, liver, and other thoracic or abdominal cancers, a tradeoff exists between tumor control and SBRT-induced liver toxicity,23 which makes our study of RILI preclinically or clinically relevant.
Thirdly, RILI as a special type of normal tissue damage with pathological progression and repair is suitable for imaging studies. One of the earliest imaging studies of RILI was performed by Lawrence et al in 1995, where they found 74% follow-up CT showed low-attenuation area in the liver near the target volume.24 Later, Chiou et al applied triple-phase CT to evaluate RILI and found low-density changes were common within 3 months post-RT, while high-density changes were common after prolonged follow-up.25 Herfarth et al observed that focal liver reactions occurred after liver SBRT in all patients in that study. However, the volume of focal appearance decreased with time in their follow-up CT scans.26 Kimura et al reported that dynamic contrast enhanced CT images of liver injury after SBRT could be classified into three different patterns, either hyperdensity in all enhanced phases, or hypodensity in arterial and portal venous phases, or isodensity in all enhanced phases. Specially, these three types of patterns changed over time and became merged into the first type eventually for most patients.27 Advances in medical imaging may detect liver injury progression by providing non-invasive, quantitative and longitudinal analysis. One of the most commonly used imaging equipment clinically is CT. All those CT imaging studies motivated us to design the experiment in order to investigate the longitudinal change of HU values and distributions in a well-controlled, dose-escalated, image-guided, precision radiotherapy study.
Previously published animal studies in rats or non-human primates showed similar observations as ours in liver parenchyma changes of RILI progression. For example, Imaeda et al11 conducted an invasive intraoperative radiotherapy (IORT) by surgically opening the abdomen in rats to ensure the whole liver irradiation. They found differences in cell number, apoptotic cell proportion, and the Ki-67 labeling index between the 15 Gy and 30 Gy groups, and the TGF-β1 and α-SMA expression, which supported the gradual progression of radiation-induced liver fibrosis following IORT. However, the procedure was very different from the noninvasive clinical RT workflow and the observed hepatic change could be affected by the recovery of surgical procedure. Wu et al built a mouse RILD model of SBRT delivery using helical tomotherapy, where decreased body weight, increased ALT/AST, and increased liver fibrosis were observed with the increased radiation dose to the whole liver.28 Yannam et al13 performed RILD experiments in non-human primates, where they detected veno-occlusive disease after dose escalated, hypofractionated SBRT in thirteen monkeys. Those animal models demonstrated RILI changed hepatic circulation and tissue density, which may be evaluated quantitatively in longitudinal CT. Imaging is a noninvasive method of assessing the tumor and its microenvironment, and together with biochemical screening, also can be used to longitudinally monitoring normal tissue characteristics such as liver parenchyma damage. Specifically, quantitative imaging evaluation may facilitate to track tissue changes of underlying molecular process of RILI. Cao et al built a CT perfusion model to predict individual patient's radiosensitivity in the liver.29 Similarly, Price et al proposed longitudinal SPECT/CT imaging evaluation to identify patients with high risks of RILD.30 Thakur et al conducted quantitative analysis of longitudinal lung CT for radiation induced lung injure.31 Braman et al19 used dynamic contrast enhanced MRI markers to successfully predict pathological response to cancer therapy. For children, an ultrasound imaging evaluation for cancer therapy-related liver injury was suggested with relative low cost and no ionizing radiation.32 Compared to other imaging modalities, CT has the advantages of being fast and readily available with good detection of injury related fibrosis; however, it also has the limitation of requiring further characterization of focal lesions.32
5 CONCLUSION
The efficacy of radiotherapy is often hindered by radiation induced normal tissue damage, such as RILI as one of the most devastating consequences. It is critical to develop noninvasive and quantitative evaluation techniques for RILI. The CT scans are routinely used clinically, fast and robust with HU as a relative quantitative measurement of tissue attenuation. We have developed a well-controlled animal study for RILI with longitudinal unenhanced CT in mice post radiation at multiple time points to evaluate progression of liver injury. There is a linear relationship observed between HU reduction in liver parenchyma and radiation dose, where the slope of the fifth week is steeper than that of the first week, demonstrating more severe liver parenchyma attenuation occurring in the late stage. Overall, longitudinal unenhanced CT is a useful imaging tool to evaluate the severity and progression of radiation induced liver injury.
CONFLICT OF INTEREST STATEMENT
All authors declare no conflicts of interest.
ETHICAL STATEMENT
Animal Welfare: The present study followed institutional guidelines for humane animal treatment and complied with relevant legislation from Peking University Shenzhen Hospital.
Open Research
DATA AVAILABILITY STATEMENT
The experimental data generated in the current study are available within the manuscript.


