Alcohol Dehydrogenase 4-Mediated Retinol Metabolism Inhibits Hepatocellular Carcinoma Progression Through Inhibiting the Wnt/β-Catenin Pathway
Jiaying Li, Mingshu Gao, and Yanan Zhang contributed equally to this study.
ABSTRACT
Hepatocellular carcinoma (HCC) ranks third in global cancer-related mortality, with limited therapies for advanced stages. Retinol, the alcohol form of vitamin A, has long been associated with liver diseases. Plasma retinol levels have been inversely correlated with the risk and poor prognosis of HCC. In this study, transcriptome data analysis identified retinol metabolism as the seventh KEGG-dysregulated pathway in cirrhosis tissue, ascending to the top position in HCC tissue compared to normal tissue. Specifically, a consistent downregulation of ADH4 (alcohol dehydrogenase 4), the retinol dehydrogenase among human ADHs, was observed, which correlated with poor prognosis in HCC patients. In vivo experiments demonstrated that silencing ADH4 enhances liver fibrosis and the progression of HCC. Mechanistically, ADH4 elevated intracellular levels of RA (retinoic acid), a biologically active derivative of retinol. RA-activated retinoid receptors RARs/RXRs, leading to inhibition of the downstream Wnt/β-catenin pathway and thereby hindering HCC progression. In contrast, the knockdown of ADH4 in hepatocytes triggers apoptosis. Notably, additional results demonstrated that the combined treatment of RA and cisplatin achieved synergistic antitumor effects in a mouse HCC model. In summary, our research elucidates that ADH4-mediated RA production suppresses HCC growth, providing a theoretical foundation for HCC treatment.
Graphical Abstract
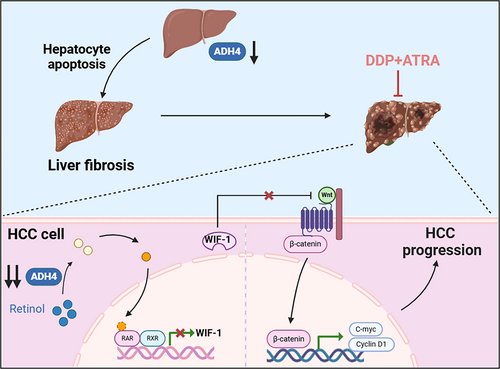
The downregulation of ADH4 expression induces hepatocyte apoptosis, thereby contributing to liver fibrosis and the initiation of hepatocellular carcinoma (HCC). Moreover, sustained suppression of ADH4 in HCC cells disrupts retinoic acid synthesis, leading to reduced expression of the Wnt/β-catenin signaling inhibitor WIF-1 via RARs/RXRs-mediated mechanisms. This disruption fosters the upregulation of oncogenic regulators such as c-Myc and Cyclin D1, thereby accelerating HCC progression. Notably, the combination therapy involving all-trans retinoic acid (ATRA) and cisplatin exhibits a pronounced synergistic antitumor effect.
1 Introduction
Hepatocellular carcinoma (HCC), which constitutes 75%–85% of all primary liver cancers, was the third leading cause of cancer-related mortality globally in 2020. The late-stage diagnosis of HCC in most patients poses a therapeutic challenge, as curative interventions such as resection, transplantation, or ablation are no longer viable options. Based on findings from two extensive randomized clinical trials, sorafenib has been recommended as the standard therapy for advanced HCC. Nevertheless, sorafenib as a standalone therapeutic regimen exhibits modest survival advantages, suboptimal tumor response rates, and a clinically significant incidence of treatment-related adverse events. Cisplatin-based hepatic arterial infusion chemotherapy (HAIC) has emerged as a clinically validated alternative to sorafenib for HCC patients presenting with portal vein tumor thrombosis (PVTT) [1]. By selectively delivering chemotherapeutic agents to tumor-supplying arteries, HAIC achieves enhanced local drug concentrations, thereby reducing systemic toxicity and yielding superior objective response rates compared to conventional systemic chemotherapy regimens [2, 3]. Recent evidence increasingly supports the efficacy of combining cisplatin-based HAIC with systemic therapy for HCC [4], suggesting that the combination of cisplatin with other agents may further improve the survival of patients with advanced HCC.
Recent studies suggest that the metabolic state of tumors evolves throughout disease progression [5]. Understanding these metabolic changes and pinpointing key reprogramming activities could pave the way for effective treatments. Previous studies have demonstrated that hexokinase 2 expression is heightened in HCC cells, and its knockdown inhibits HCC cell proliferation and enhances sorafenib sensitivity by promoting the tricarboxylic acid cycle [6]. Additionally, glutaminase 1 is highly expressed in HCC cells and correlated with unfavorable prognosis. Targeting glutaminase 1 leads to increased reactive oxygen species accumulation, inhibition of the Wnt/β-catenin pathway, and suppression of HCC cell stemness [7]. Besides, the expression of FABP4 (FA-binding proteins) is lower in multiple tumor tissues compared to normal tissues and FABP4 inhibits HCC cell proliferation and invasion in vitro [8].
Retinol, the alcohol form of vitamin A, fulfills several critical biological functions, including promoting vision, facilitating cell growth and differentiation, and maintaining the immune system. Studies have highlighted the complex roles of retinol and its metabolites in cancer development and progression. Retinol is metabolized to retinal and retinoic acid (RA), with RA functioning as the bioactive metabolite that orchestrates transcriptional regulation of genes involved in cellular proliferation, differentiation, and apoptotic pathways [9]. RA exerts its effects via ligand-activated nuclear receptors—retinoic acid receptors (RARs) and retinoid X receptors (RXRs)—which heterodimerize to bind retinoic acid response elements (RAREs) and modulate target gene expression.
Previous studies have demonstrated a significant correlation between aberrant RA signaling and the progression of various human cancers. Notably, Nadine Martinet et al. have identified substantial alterations in the expression of RARs and RXRs in pre-cancerous lung cancer lesions, potentially leading to a functional deficiency in vitamin A and thereby facilitating carcinogenesis [10]. Yue Sun et al. have found a significant association between the RA metabolic pathway and the transformation of activated CD4+ memory T cells, as well as the prognosis of gastric cancer patients [11]. Furthermore, RA has shown promising therapeutic benefits in human cancers. Aggeliki K. Meligova et al. demonstrated that RA augments the antiproliferative effects of antiestrogen drugs in breast cancer patients [12]. Additionally, Yu-Hua Song et al. reported that acute promyelocytic leukemia (APL) patients with FLT3-ITD mutations experience higher early mortality rates during induction therapy; however, administration of RA improves the prognosis for these patients [13]. Nonetheless, the role of retinol/RA in HCC treatment and the underlying molecular mechanisms remain to be fully elucidated.
Here, we identified significant changes in retinol metabolism in cirrhosis tissue and HCC tissues, specifically marked by the pronounced downregulation of the key metabolic enzyme ADH4. This downregulation exhibited a positive correlation with both overall survival and relapse-free survival among HCC patients. Subsequent investigations indicated that silencing ADH4 enhances liver fibrosis and the progression of HCC. RA primarily inhibited HCC cell proliferation through the suppression of the Wnt/β-catenin signaling. Furthermore, the combination of all-trans retinoic acid (ATRA) with cisplatin markedly enhanced therapeutic efficacy compared to monotherapy in a mouse HCC model. This study identifies a therapeutically exploitable prognostic marker that exhibits both diagnostic relevance and targetable molecular features in HCC management.
2 Results
2.1 The Downregulation of the Critical Retinol Metabolism Enzyme ADH4 Is Significantly Correlated With Poor Prognosis in Hepatocellular Carcinoma (HCC) Patients
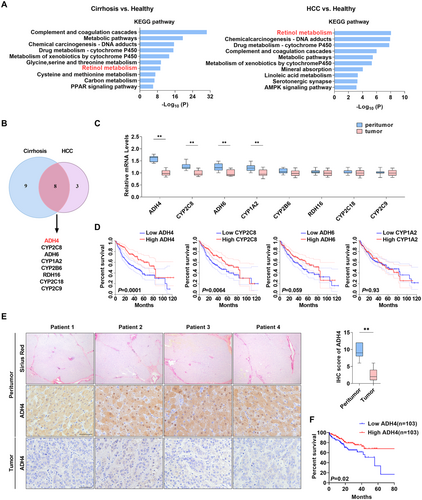
To explore the characteristics of gene expression at cirrhotic and HCC stages, we examined the transcriptomic data encompassing healthy controls, cirrhotic tissues, and HCC tissues. Our analysis identified that genes downregulated in both cirrhotic and HCC tissues were enriched in various metabolic pathways, including drug metabolism and P450-related detoxification functions, suggesting impaired liver function. Notably, dysregulated retinol metabolism emerged as one of the top ten KEGG pathways when comparing cirrhotic tissue to normal tissue and ranked highest when comparing HCC tissue to normal liver tissue (Figure 1A and Supporting Information S1: Figure 1A,B). Further examination of retinol metabolism-related genes using GEO data revealed eight significantly downregulated genes (ADH4, CYP2C8, ADH6, CYP1A2, CYP2B6, RDH16, CYP2C18, CYP2C9) in both pathological states (Figure 1B). Among these, the downregulation of ADH4, CYP2C8, ADH6, and CYP1A2 was further validated at the mRNA level in 56 paired cirrhosis and HCC tissues (Figure 1C). Prognostic analysis using TCGA data indicated that ADH4 downregulation was most significantly associated with poor patient prognosis (Figure 1D). Subsequent studies confirmed that ADH4 protein levels were markedly lower in HCC samples compared to paired cirrhosis tissue (2.2 ± 0.3 vs. 9.5 ± 0.4, p < 0.01, Figure 1E). Besides, we also found that patients with lower ADH4 expression (median as cutoff) had a poorer prognosis (p < 0.01, Figure 1F). These findings suggest that the downregulation of ADH4-mediated retinol metabolism abnormalities likely plays a tumor-promotional role.
2.2 ADH4 Markedly Suppresses the Proliferation of HCC Cells
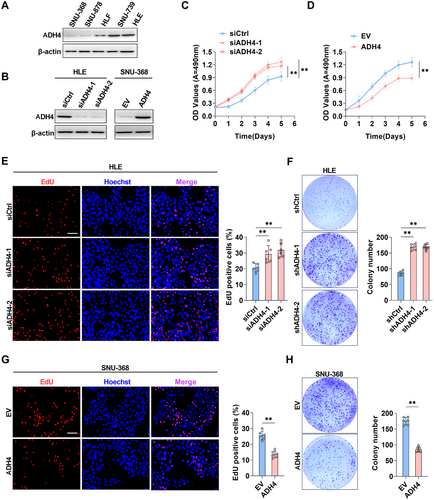
To investigate the influence of ADH4 on cell proliferation, we initially measured ADH4 expression across five HCC cell lines, identifying the lowest protein levels in SNU-368 cells and the highest in HLE cells (Figure 2A). We performed ADH4 knockdown in HLE cells (Figure 2B) and SNU-739 cells (Supporting Information S1: Figure 2A) and generated cell models with ADH4 overexpression in SNU-368 cells (Figure 2D). The 3-(4,5-dimethylthiazol-2-yl)-5-(3-carboxymethoxyphenyl)-2-(4-sulfophenyl)-2H-tetrazolium (MTS) cell viability assays indicated that the growth rate of HLE cells with ADH4 knockdown was significantly elevated compared to the control group (p < 0.01), whereas the growth rate of SNU-368 cells overexpressing ADH4 was significantly reduced relative to controls (p < 0.01, Figure 2C,E and Supporting Information S1: Figure 2B). Consistently, ADH4-knockdown HLE and SNU-739 cells exhibited a marked increase in 5-ethynyl-2′-deoxyuridine (EdU) incorporation compared to control groups (p < 0.01, Figure 2F and Supporting Information S1: Figure 2C), and in SNU-368 cells overexpressing ADH4 the 5-ethynyl-2′-deoxyuridine (EdU) incorporation significantly lower than control group (p < 0.01, Figure 2H). Besides, the number of colonies formed were significantly higher in HLE cells with ADH4 knockout compared to the control group (p < 0.01, Figure 2G), and significantly lower in SNU-368 cells overexpressing ADH4 (p < 0.01, Figure 2I). Collectively, ADH4 overexpression markedly inhibited the proliferation of HCC cells, whereas ADH4 knockdown elicited the opposite effects.
2.3 The Downregulation of ADH4 Induces Liver Fibrosis and Facilitates HCC Progression
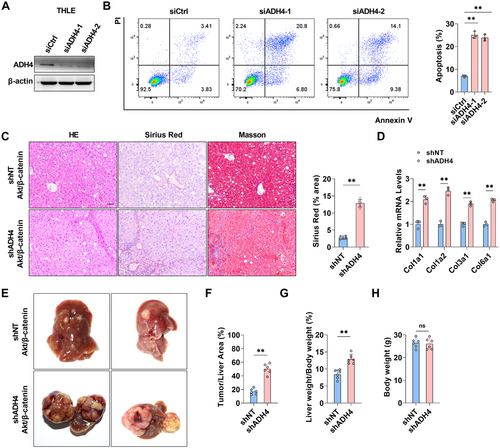
Hepatocyte death not only initiates liver fibrosis but also accelerates its progression through mechanisms such as inflammation, activation of hepatic stellate cells, and deposition of the extracellular matrix. In this study, we hypothesize that the downregulation of ADH4 in fibrotic liver tissue may correlate with increased cell death. To evaluate this, ADH4 expression was silenced in THLE cells (Figure 3A). The proportion of apoptotic cells in the ADH4-knockdown group was significantly elevated compared to the control group (p < 0.01) (Figure 3B). Furthermore, a mouse model was developed using hydrodynamic tail vein injection to co-express ADH4-specific shRNA together with the oncogenes AKT and β-catenin (Supporting Information S1: Figure 3). Four weeks after injection, liver tissues were collected and analyzed using HE, Sirius Red, and Masson staining. As illustrated (Figure 3C), this model exhibited mild liver fibrosis, a feature absent in the control mice overexpressing only AKT and β-catenin. Consistently, mRNA levels of collagen-associated genes were significantly upregulated (Figure 3D). By 8 weeks postinjection, mice in the ADH4-knockdown group presented a significantly higher tumor burden compared to controls (Tumor/liver area, 43.1% ± 4.3 vs. 18.7% ± 5.2, p < 0.05) (Figure 3E–H). These findings suggest that the knockdown of ADH4 in hepatocytes significantly promotes the progression of hepatic fibrosis and aggravates tumor burden, potentially driven by hepatocyte apoptosis resulting from ADH4 depletion.
2.4 Liver-Specific ADH4 Overexpression Inhibits HCC Progression In Vivo
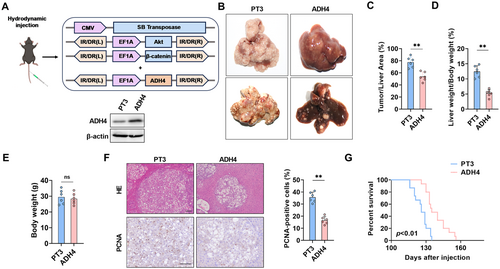
To further elucidate the role of ADH4 in tumorigenesis in vivo, we overexpressed ADH4 in conjunction with the oncogenes AKT and β-catenin in mouse liver via hydrodynamic injection and WB was used to verify the efficiency of liver overexpression of ADH4 (Figure 4A). After 12 weeks, liver tissues from the mice were harvested. As illustrated (Figure 4B), ADH4-overexpressing livers exhibited a significantly reduced tumor burden compared to control mice (77.6% ± 3.6 vs. 53.8% ± 3.1, p < 0.01, Figure 4C). Consistent with these observations, the ADH4 overexpression group exhibited a markedly reduced liver-to-body weight ratio compared to controls (p < 0.01, Figure 4D). Notably, no significant alterations in body weight were observed in ADH4-overexpressing mice, indicating favorable tolerability and safety profiles of the intervention (Figure 4E). Histological examination revealed that livers overexpressing ADH4 exhibited fewer tumor nodules and a smaller cross-sectional diameter of nodules compared to control mice (Figure 4F). Immunohistochemical (IHC) staining analysis showed that ADH4 overexpression in tumor lesions markedly reduced PCNA staining, indicative of suppressed tumor cell proliferation (p < 0.01, Figure 4F). Moreover, ADH4 overexpression remarkably prolonged the lifespan of mice (Figure 4G). Overall, liver-specific overexpression of ADH4 effectively slowed the progression of spontaneous tumor development in mouse models.
2.5 ADH4 Inhibits the Progression of HCC by Upregulating RA Levels to Activate RARs/RXRs
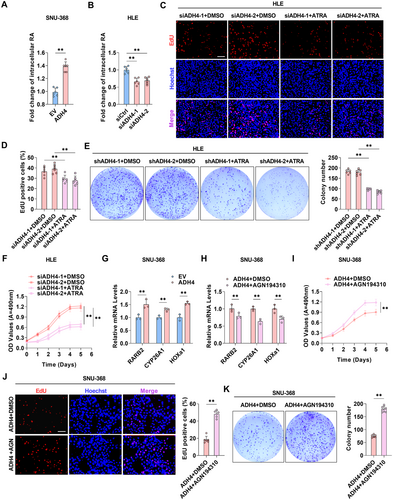
ADH4 plays a pivotal role in catalyzing the oxidation of retinol to retinoic acid (RA) during retinoid metabolism. To examine the impact of ADH4 on retinol metabolism in HCC cells, we quantified intracellular RA levels and observed that RA levels have a significant increase in SNU-368 cells overexpressing ADH4 and decrease in HLE cells with ADH4 knockdown (p < 0.01, Figure 5A,B). Furthermore, in SNU-368 cells overexpressing ADH4, the expression of genes within the RA biosynthetic pathway is upregulated, whereas it is downregulated in HLE cells with ADH4 knockdown (Supporting Information S1: Figure 4A,B). Additionally, we evaluated whether ATRA treatment could counteract the effects of ADH4 knockdown on HCC cell proliferation. In ADH4-knockdown HLE cells, ATRA treatment significantly inhibited proliferation and colony-forming capabilities (Figure 5C–F). RA is known to regulate the transcription of target genes, such as RARβ (RARB2), cytochrome P450 26A1 (CYP26A1), and homeobox A1 (HOXa1), through the activation of RARs and RXRs [14, 15]. Consistently, our qPCR analysis demonstrated elevated expression levels of RARB2, CYP26A1, and HOXa1 in SNU-368 cells overexpressing ADH4 (p < 0.01, Figure 5G). Given the vital role of RARs/RXRs activation in tumor growth [16], we hypothesized that ADH4-induced RA may influence tumor growth via RARs/RXRs. Treatment of ADH4-overexpressing SNU-368 cells with AGN194310, an RAR antagonist, significantly reduced the expression of RARB2, CYP26A1, and HOXa1 (p < 0.01, Figure 5H) and enhanced the proliferation and colony-forming abilities of ADH4-overexpressing cells (Figure 5I–K). These findings suggest that ADH4 impedes tumor growth by elevating RA levels and subsequently activating RARs/RXRs.
2.6 The ADH4/RARs/RXRs Axis Inhibits HCC Progression By Suppressing the Wnt/β-Catenin Pathway
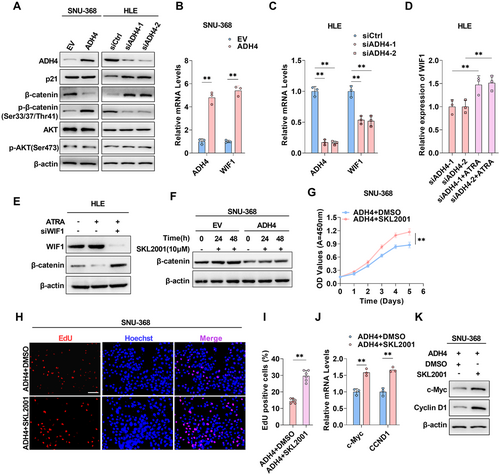
To further elucidate the mechanism by which ADH4 inhibits HCC progression through the activation of RARs/RXRs, we analyzed key molecules within the classical downstream pathways of RARs/RXRs—specifically the Wnt/β-catenin, p53 signaling, and PI3K/Akt signaling pathways [17-19]—in SNU-368 cells overexpressing ADH4 and HLE cells with ADH4 knockdown, compared to control cells. Notably, we detected substantial changes in the abundance and phosphorylation states of β-catenin (Figure 6A). Subsequently, we assessed the expression of RXR downstream genes—WIF1, CDKN1A, and CDKN1B [20-22]—via qPCR using an RXR inhibitor. Among these, WIF1 exhibited the most significant changes in expression (Supporting Information S1: Figure 5A). Wnt inhibitory factor 1 (WIF1) is known to interfere with the interaction between Wnt and its receptor by directly binding to Wnt, thereby preventing the accumulation of β-catenin through phosphorylation and inhibiting the Wnt/β-catenin pathway. Correspondingly, our examination of WIF1 levels revealed a significant elevation in WIF1 expression and secretion in ADH4-overexpressing HCC cells relative to controls, whereas a reduction was observed in the knockdown cells (Figure 6B,C; Supporting Information S1: Figure 5B–F). We hypothesized that ADH4 may principally inhibit HCC progression by increasing RA levels and suppressing the Wnt/β-catenin pathway. To test this hypothesis, we first treated ADH4 knockdown HLE cells with RA and found that ATRA treatment offset the reduction in WIF1 levels induced by ADH4 knockdown (Figure 6D). We have further demonstrated that ATRA treatment reduces β-catenin expression. Conversely, WIF1 knockdown reversed these effects (Figure 6E), indicating that WIF1 mediates the regulatory relationship between ADH4 and the Wnt/β-catenin pathway. (Figure 6E). We then utilized the Wnt/β-catenin pathway agonist SKL2001 to enhance intracellular β-catenin levels (Figure 6F,G), observing that SKL2001 treatment increased the proliferation capacity of ADH4-overexpressing HCC cells. (Figure 6H–J). Moreover, SKL2001 reversed the ADH4-mediated suppression of β-catenin downstream tumor-related genes, including c-Myc and CyclinD1 (Figure 6K,L). Collectively, these findings substantiate that ADH4 exerts its antitumor effects through the RARs/RXRs-mediated suppression of the Wnt/β-catenin pathway.
2.7 The Combined Treatment With RA and Cisplatin Elicited Synergistic Antitumor Effects
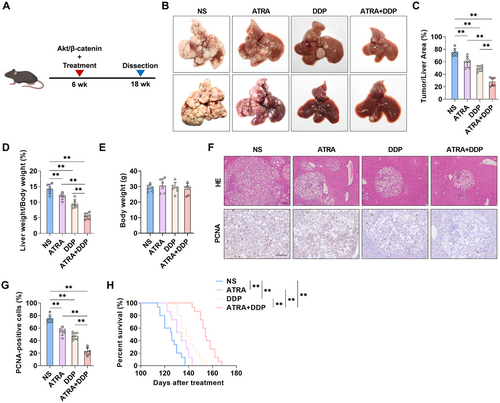
To further investigate the role of RA in HCC progression, we examined the efficacy of ATRA in combination with cisplatin. Mice injected with Akt and β-catenin plasmids were randomly divided into four groups: control, ATRA treatment, cisplatin treatment, and ATRA-cisplatin combination treatment. The mice received intraperitoneal injections of either a single reagent or a combination of the two every 3 days (Figure 7A). After 3 months, significant differences in tumor growth were observed between the control group and both the ATRA and cisplatin treatment groups; nevertheless, the most pronounced inhibition of tumor growth was seen in the ATRA-cisplatin combination group, indicating a synergistic antitumor effect (Figure 7B). As illustrated (Figure 7B), ATRA-cisplatin treatment exhibited a significantly reduced tumor burden (Figure 7C) and the lowest liver-to-body weight ratios (Figure 7D). Notably, administration of ATRA, DDP (cisplatin), or their combination resulted in no significant alterations in body weight among treated animals, indicating favorable tolerability and safety profiles of these therapeutic regimens (Figure 7E). Histological analysis revealed fewer tumor nodules in the livers of the ATRA-cisplatin-treated mice compared to other treatment groups (Figure 7F). Immunohistochemical staining indicated that ATRA-cisplatin treatment most effectively inhibited tumor cell proliferation, as evidenced by PCNA staining (Figure 7F,G). Consistently, ATRA-cisplatin treatment also resulted in the longest survival times (Figure 7H). The findings demonstrate that the combined administration of ATRA and cisplatin synergistically suppresses HCC progression in mouse models while markedly enhancing survival outcomes.
3 Discussion
In recent years, the prevalence of nonalcoholic steatohepatitis (NASH) has consistently risen, emerging as a major etiological contributor to cirrhosis and HCC. This study reveals significant enrichment of the retinol metabolism pathway in cases of cirrhosis and HCC, with its prominence increasing as cirrhosis advances to liver cancer. Previous investigations support these findings: for example, serum retinol levels have been positively correlated with the incidence of nonalcoholic fatty liver disease (NAFLD), and retinol deficiency has been notably linked to advanced fibrosis [23]. Additionally, research examining the association between plasma retinol levels and liver cancer risk provides novel insights into HCC prevention. Hada et al. demonstrated that elevated serum retinol concentrations are associated with a reduced risk of liver cancer [24], further highlighting the potential role of retinol in cancer prevention.
Among the differential genes involved in retinol metabolism in cirrhosis and liver cancer, ADH4 demonstrates significant clinical prognostic value. As a member of the alcohol dehydrogenase (ADH) family, ADH4 functions as a retinol dehydrogenase, facilitating the conversion of retinol to RA. Homozygous Adh4 mutant mice are viable and fertile on a standard diet without apparent defects; however, under vitamin A deficiency during gestation, these mutants exhibit a higher incidence of stillbirths compared to wild-type mice, underscoring the critical role of ADH4 in retinol metabolism [25]. Moreover, recent studies identify ADH4 as a prognostic protein biomarker for predicting survival outcomes in HCC patients [26-28]. These findings imply a strong association between ADH4 and tumorigenesis, despite its previously unreported role in HCC as a retinol metabolic enzyme.
RA, the active metabolite of retinal, is essential in vertebrate morphogenesis, growth, cellular differentiation, and tissue homeostasis [9]. This study demonstrated that ADH4 facilitates the conversion of retinol to RA, thereby inhibiting HCC cell proliferation and tumor growth. Consistently, RA also shows significant potential in therapies against other tumor types. For instance, RA has been shown to induce differentiation in APL treatment and inhibit breast cancer cell growth [29-31]. It also suppresses migration and proliferation of precancerous squamous cells [32]. Furthermore, RA enhances antitumor immune responses by modulating the immune system, particularly affecting T cell differentiation and function [33].
Our results indicate that knockdown of ADH4 reduces RA levels and WIF1 expression while increasing β-catenin levels in HCC cells. However, supplementation with RA reverses these effects, suggesting that ADH4-mediated RA production suppresses the Wnt/β-catenin signaling pathway by upregulating WIF1. RA exerts its regulatory effects on the transcription of target genes by interacting with nuclear receptors and utilizing both direct and indirect mechanisms. Direct regulation involves the formation of a heterodimer between the RAR and RXR, which binds to DNA response elements [34], thereby activating or repressing the transcription of key developmental genes that influence cell differentiation and proliferation [35]. Notably, previous studies have demonstrated that RARs/RXRs directly enhance WIF1 expression by binding to its promoter [20]. Therefore, WIF1 functions as an endogenous antagonist of the Wnt/β-catenin pathway by directly interacting with Wnt ligands, preventing their binding to receptors, and promoting the degradation of β-catenin [36]. This inhibition consequently deactivates downstream Wnt/β-catenin targets, such as c-Myc and Cyclin D1 [37, 38], which are critically involved in cancer progression [39].
Combination therapy offers significant potential in tumor treatment by enhancing antitumor efficacy and minimizing the toxicity associated with single-agent therapies. In a primary mouse liver cancer model, we demonstrated that combining ATRA with cisplatin significantly enhances efficacy compared to cisplatin alone. Additional studies suggest that the combination of RA and γ-secretase inhibitor (DAPT) effectively inhibits gastric cancer cell growth and induces apoptosis [40]. Furthermore, RA overcomes tamoxifen resistance in breast cancer cells by significantly inhibiting cell viability and proliferation [41, 42]. In the treatment of APL, the combination of RA and arsenic trioxide shows superior outcomes over traditional chemotherapy, with reduced hematological toxicity [43].
In addition, the present study still has limitations. Notably, while we established that the downregulation of ADH4 promotes the proliferation of HCC cells through activation of the Wnt/β-catenin signaling pathway, it paradoxically induces apoptosis in normal hepatocytes. The underlying mechanisms responsible for this contrasting biological response remain poorly understood and require further in-depth exploration. Furthermore, the clinical sample size analyzed in this study was relatively limited, and the observed correlation between diminished ADH4 expression and prognosis in fibrosis-associated HCC necessitates validation in larger, more diverse patient cohorts.
This study demonstrated that ADH4 expression is consistently downregulated in liver fibrosis and HCC tissues, with its reduced expression strongly correlating with poor prognosis in HCC patients. In a murine model, ADH4 silencing was shown to exacerbate liver fibrosis and accelerate HCC progression. Mechanistically, the loss of ADH4 was linked to the activation of the Wnt/β-catenin signaling pathway through the attenuation of RA-mediated β-catenin degradation in HCC cells. Notably, our findings revealed that combination therapy of RA and cisplatin exerted synergistic antitumor effects in a murine HCC model.
4 Materials and Methods
4.1 Cell Culture and Tissue Collection
Typical HCC cell lines SNU-739, SNU-878, and SNU-368 were acquired from the Korean Cell Line Bank (Seoul, Republic of Korea), HLF and HLE cell lines were obtained from the Japanese Collection of Research Bioresources Cell Bank (Osaka, Japan), THLE were obtained from ATCC (Manassas, VA). Cells were cultured in RPMI-1640 or Dulbecco's Modified Eagle's Medium (DMEM) (Gibco, Thermo Fisher Scientific Inc, Waltham, MA) supplemented with 10% fetal bovine serum (FBS) under standard conditions. When the cell confluence rate reached 60%–80%, Lipo2000 (11668, Invitrogen) reagent was used to transfect the cells according to the instructions. After 6 h, the fresh medium containing G418 (500 μg/mL) was replaced. The new screening medium was replaced every 2–3 days. After 2 weeks of transfection, the expression of ADH4 was detected by WB, and the corresponding experiments were carried out. All cell lines underwent authentication via short tandem repeat (STR) DNA profiling at the FMMU Center for DNA Typing, with confirmation of mycoplasma-free status through standardized screening protocols. Additionally, 56 paired liver cirrhosis and HCC tissue samples were collected from Xijing Hospital, affiliated with the Air Force Medical University (Xi'an, China). All participants provided written informed consent, and the study was approved by the ethics committee of the Air Force Medical University (KY20213188-1).
4.2 The Analysis of Transcriptome Data
Transcriptome analysis was conducted using the GEO2R tool to examine differential expression in the GSE164760 data set. Initial steps involved defining group classifications, followed by differential expression analysis utilizing the limma package with default parameter settings. Genes exhibiting a fold change greater than 2 or less than 0.5, along with a P-value below 0.05, were identified as differentially expressed genes. Enrichment analysis of these differentially expressed genes was carried out via the DAVID platform, with a particular emphasis on pathways associated with metabolism.
4.3 Intracellular RA Analysis
For intracellular RA analysis, a Tretinoin ELISA kit (CB13702-Hu) from Shanghai Coibo Biology was utilized. The cell suspension was diluted with PBS (pH 7.2–7.4) as per the manufacturer's instructions, achieving a concentration of approximately 1 × 10⁶ cells/mL. Cells were subjected to repeated freeze-thaw cycles to lyse them and release intracellular components. Subsequently, the supernatant was collected following centrifugation at 2000–3000 rpm for approximately 20 min. An equal volume of sample or standard was added to each well of a 96-well plate, followed by the addition of an HRP conjugate. The plate was incubated at 37°C for 1 h, washed with a washing buffer, and then TMB substrate was added to each well. After an additional incubation at 37°C for 20 min, the reaction was terminated with a stop solution. OD values were measured at 450 nm using an enzyme-linked immunosorbent assay reader. The RA concentration was determined based on the standard curve and OD values, with all experiments conducted in triplicate.
4.4 Cell Viability Assay
The CellTiter 96 AQueous One Solution Cell Proliferation Assay Kit (G3581, Promega, WI) was employed to assess cell proliferation. Cells were prepared following the manufacturer's instructions and seeded into a 96-well plate. Subsequently, 20 μL of CellTiter 96 AQueous One Solution was added to the medium and incubated for 4 h. The absorbance was then measured at 490 nm using a multi-wavelength microplate reader (SynergyLX, Bio Tek, VT).
4.5 Colony Formation Assay
Cells were diluted to a concentration of 1 × 10⁴ cells/mL, and 100 μL of this suspension was seeded into a 6-well plate. Cultures were continued until visible colonies formed. The supernatant was discarded, and cells were gently washed twice with PBS. Subsequently, 2 mL of 4% paraformaldehyde was added for fixation for 15 min. After removing the fixative, an appropriate volume of crystal violet staining solution was applied for 30 min. The staining solution was washed off and images were captured after air drying. The proportion of colony formation relative to the average post-adhesion cell count across five fields (4× magnification) was statistically analyzed.
4.6 Western Blot
Total cellular protein was extracted from HCC cells with RIPA lysis buffer. Protein concentration was measured using the BCA method, and equal amounts of protein were subjected to electrophoretic separation on a 10% SDS-PAGE gel. Subsequently, proteins were electrophoretically transferred onto polyvinylidene fluoride (PVDF) membranes, followed by blocking with 5% nonfat milk in Tris-buffered saline containing 0.1% Tween-20 (TBST) for 1 h at room temperature. The membrane was then incubated overnight with a primary antibody against ADH4 (16474-1-AP, Proteintech, Wuhan, China), β-actin (8480, Cell Signaling Technology, MA), Phospho-β-Catenin antibody (9561, Cell Signaling Technology, MA). Phospho-β-Catenin antibody specifically detects endogenous β-catenin when phosphorylated at serine residues 33, 37, or threonine residue 41. Following three washes, the membrane was incubated with an HRP-conjugated secondary antibody for 1 h (S001, TDY BIOTECH, Beijing, China). Protein bands were detected using ECL reagent (34580, Thermo Fisher Scientific, MA) and imaged. Band intensity was analyzed using ImageJ software (National Institutes of Health, MD).
4.7 Immunohistochemistry (IHC)
HCC and peritumoral tissue sections were collected for immunohistochemical staining using the UltraSensitiveTM SP (Mouse/Rabbit) IHC Kit (KIT-9730, MaiXin Biotechnologies, Fuzhou, China). Evaluation of results was conducted blindly by two expert pathologists, assessing the proportion of positive cells and staining intensity. A total score of < 2 was considered negative (−), ≥ 2 to < 7 weakly positive (+), ≥ 7 to < 12 moderately positive (++), and ≥ 12 strongly positive (+++). The primary antibodies used in this study are listed in Supporting Information S1: Table 1.
4.8 EdU Staining
HCC cells were seeded into 24-well plates at a density of 2 × 10⁴ cells per well. A Cell-Light EdU Apollo567 In Vitro Kit (C10310-1, Ribobio, Guangzhou, China) was employed to assess DNA replication activity. Briefly, cells were exposed to EdU solution for 2 h to label replicating DNA, followed by fixation, Apollo staining, and nuclear staining. Images were captured using a fluorescence microscope (FV3000, Olympus, Tokyo, Japan). ImageJ software (National Institutes of Health, MD) was utilized to quantify EdU and Hoechst-33342 positive cells, and the percentage of EdU positive cells among Hoechst-33342 positive cells was determined.
4.9 qRT-PCR
Total RNA was extracted using the E.Z.N.A. Total RNA Kit I (#R6834; OMEGA Bio-Tek Inc. GA) following the manufacturer's protocol. The reverse transcription was performed using the PrimeScript RT kit with gDNA Eraser (RR047A, Takara, Tokyo, Japan) according to the manufacturer's instructions. For qRT-PCR analysis, cDNA was amplified with TB Green Premix Ex Taq II (RR820A, Takara, Tokyo, Japan) under the following cycling conditions: 95°C for 5 s and 60°C for 45 s over 40 cycles. A melting curve analysis was conducted to verify PCR specificity. The primers used are shown in Supporting Information S1: Table 2. Cq values were obtained during the exponential phase of amplification. The relative expression level of the target gene was calculated using the ΔΔCT method, with GAPDH serving as the internal control.
4.10 Experimental Animals
All experimental mice were housed in cohorts of 3–5 animals under controlled conditions at the specific pathogen-free (SPF) facility of Air Force Medical University. The animals were subjected to a 12-h light/dark cycle with a regulated ambient temperature of 22 ± 0.5°C and provided ad libitum access to standard rodent chow and autoclaved water, except during designated experimental protocols. Sleeping Beauty (SB)-mediated hydrodynamic injection was conducted on 6-week-old male C57BL/6 J mice as previously described [44]. The plasmids employed in this model, namely pT3-EF1α-HA-myr-Akt, pT3-EF1α-ΔN90-β-catenin, and pCMV/SB transposase, were generously provided by Prof. Xin Chen from the University of California, San Francisco. In brief, 20 μg of target gene-containing plasmid DNA was combined with SB transposase at a 25:1 weight ratio (plasmid: transposase) in 2 mL of saline solution per mouse. The mixture was filtered to remove any particulates and administered via tail vein injection over a 5–7 s interval. The full-length mouse ADH4 sequence was amplified from hepatic cDNA and cloned into the pT3-EF1α vector using Gateway cloning technology (Thermo Fisher Scientific). Image J software was used to quantify the ratio of tumor to liver area. First, convert the image to a grayscale image, and then adjust the selected area in the threshold path to determine the area occupied by the tumor [45]. The animal study was approved by the Ethics Committee of the Fourth Military Medical University for animal research (IACUC-20210340).
4.11 Statistical Analysis
All experiments were independently executed with a minimum of three replicates. Statistical analysis was performed using GraphPad Prism 8.0 software (San Diego, California, USA). Data are presented as the mean ± standard error (SEM) of three independent replicates. A two-tailed unpaired t-test was employed to determine significant differences between groups, with p < 0.05 considered statistically significant.
Author Contributions
Jiaying Li: conceptualization (equal), data curation (lead), formal analysis (lead), project administration (equal), software (equal), writing – original draft (equal), writing – review and editing (equal). Mingshu Gao: data curation (equal), formal analysis (equal), methodology (equal), software (equal), validation (equal). Yanan Zhang: data curation (equal), formal analysis (equal), investigation (equal), methodology (equal), software (equal). Dawen Liao: formal analysis (equal), methodology (equal), software (equal). Feng Zhou: conceptualization (equal), funding acquisition (equal), project administration (equal), resources (equal). Zhaohui Zhang: conceptualization (equal), validation (equal), visualization (equal). Lele Ji: funding acquisition (equal), supervision (equal). Yilin Zhao: supervision (equal), validation (equal). Qichao Huang: conceptualization (equal), supervision (equal), validation (equal), writing – review and editing (equal). Qian Bi: conceptualization (equal), funding acquisition (equal), project administration (equal), validation (equal), visualization (equal). Nan Wang: conceptualization (equal), methodology (equal), project administration (equal), resources (equal), validation (equal), writing – review and editing (equal). All authors have read and approved the final manuscript.
Acknowledgments
We acknowledge the use of BioRender for the design of the Graphical Abstract. We would like to thank the patients and investigators who submitted in the GEO database for providing high-quality data analyzed in this study. We thank Professor Xin Chen (University of California) for donating the vectors used in the hydrodynamic injection. This study was supported by the Beijing Nova Program (20220484197), Xuzhou Key Research and Experimental Development Projects (KC21212), Innovative Talent Promotion Program the Youth Science and Technology Nova Program of Shaanxi Province (No. 2023KJXX-023), and the Key Program of the Natural Science Basic Research Plan in Shaanxi Province of China (No.2021JZ-28).
Ethics Statement
The animal study was approved by the Ethics Committee of the Air Force Medical University for animal research (IACUC-20210340). All participants provided written informed consent, and the study was approved by the Ethics committee of the Air Force Medical University (KY20213188-1).
Conflicts of Interest
The authors declare no conflicts of interest.
Open Research
All data needed to evaluate the conclusions in the paper are present in the paper and/or the Supporting Materials.


