Fexofenadine Overcomes Osimertinib Resistance by Inhibiting c-Met in Non-Small Cell Lung Cancer
ABSTRACT
Osimertinib is the only third-generation EGFR tyrosine kinase inhibitor clinically approved for first-line treatment of advanced NSCLC patients harboring EGFR mutations. However, drug resistance severely hinders its clinical efficacy. Acquired MET amplification is an important mechanism causing osimertinib resistance. This study is the first to identify fexofenadine, originally indicated for allergic rhinitis and chronic urticaria, as a putative Met-inhibitor by in silico chemical-protein interactome analysis of known Met inhibitors. Fexofenadine was verified to inhibit recombinant Met kinase in cell-free assay and phosphorylation of Met and other downstream signaling molecules in osimertinib-resistant NSCLC cell lines. KINOME profiling revealed a similar kinase inhibition profile between fexofenadine and a known Met-inhibiting drug cabozantinib using Spearman rank-order correlation analysis. Among the tested osimertinib-resistant NSCLC cell lines, fexofenadine was the most efficacious in potentiating osimertinib in NCI-H820 (having MET amplification and EGFR-T790M mutation). Transcriptome profiling in NCI-H820 revealed that the differentially expressed genes following fexofenadine treatment were enriched in epithelial-mesenchymal transition-related biological pathways. Importantly, fexofenadine was also shown to significantly potentiate the antitumor effect of osimertinib in a drug-refractory NSCLC patient-derived tumor xenograft model in NSG mice, without inducing notable adverse effects. These findings advocate the clinical evaluation of repurposing fexofenadine to overcome osimertinib resistance.
Graphical Abstract
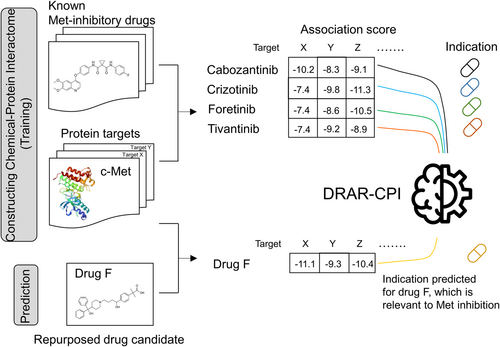
Fexofenadine was identified as a new Met inhibitory drug by a computational drug repurposing tool called “DRAR-CPI” via chemical-protein interactome analysis of known Met inhibitors. It was shown to overcome osimertinib resistance in non-small cell lung cancer by inhibiting Met in vitro and in vivo.
1 Introduction
Lung cancer is the most predominant cause of cancer deaths worldwide [1]. Advanced non-small cell lung cancer (NSCLC), which makes up more than 85% of all lung cancer cases, is known to display dismal prognosis. Recent advancements in personalized medicine have allowed a subset of NSCLC patients harboring specific epidermal growth factor receptor (EGFR) mutations (exon 19 deletion or L858R missense mutation in particular) to respond well to EGFR tyrosine kinase inhibitors (TKIs) with a manageable safety profile. EGFR is a member of the ErbB receptor tyrosine kinase family and its aberrant regulation represents a major oncogenic driver of lung cancer (particularly in Asian population (> 50%), but the frequency is significantly lower in Western population and comparable with the frequency of KRAS G12C). EGFR signaling is activated by EGF (ligand)-induced receptor homo- or heterodimerization, which stimulates downstream intracellular pathways (including MAPK, PI3K/AKT, JAK, and STAT) to promote cancer cell proliferation and survival [2, 3]. EGFR sensitizing mutations (notably exon 19 deletion and L858R missense mutation) are constitutively active and mediate oncogene-addicted signaling to sustain cancer growth [4, 5]. The specific blockade of these oncogene-addicted signaling pathways by EGFR TKIs provides the unique selectivity of the targeted drugs to kill cancer cells. However, the efficacy of EGFR TKIs in NSCLC is severely hindered by the emergence of drug resistance [2, 6, 7]. The most prevailing resistance mechanism is the secondary “gatekeeper” EGFR T790M mutation, which sterically obstructs the interaction of 1st- and 2nd-generation EGFR inhibitors to the ATP-binding pocket of the kinase [6]. This has been overcome by the discovery of third-generation TKIs, which selectively and irreversibly inhibit the sensitizing EGFR mutations (exon 19 deletion or L858R) and the resistant T790M mutation while sparing wild-type EGFR [8, 9]. Moreover, the third-generation TKIs could give rise to longer progression-free survival than the 11st-st- and 22nd-generation TKIs and are also active for tumors in the central nervous system.
Currently, osimertinib is the only 3rd generation EGFR TKI clinically approved by the major pharmaceutical regulatory agencies for the treatment of progressing EGFR T790M-positive patients who failed the earlier-generation EGFR inhibitors. In 2018, osimertinib was also designated as first-line therapy for all advanced NSCLC patients bearing EGFR mutations regardless of T790M status [10, 11]. While osimertinib represents a remarkable advancement in EGFR-targeted drug discovery, most NSCLC patients inevitably relapse and develop drug resistance. Importantly, there are only limited therapeutic options for these drug-refractory patients. A novel strategy to overcome osimertinib resistance is badly needed.
Acquired osimertinib resistance can be mediated by either EGFR-dependent or EGFR-independent mechanisms. When osimertinib is given as second-line therapy (i.e., given to patients after progression on first or second-generation EGFR TKIs), the major resistance mechanism is the loss of EGFR T790M mutation, occurring in about half of the patient population [12, 13]. Importantly, it is usually associated with the emergence of other competing resistance mechanisms including MET amplification, KRAS mutations, and histological transformation to cells [12, 14]. Besides, the acquisition of tertiary EGFR mutations (primarily C797S; reported in about 21% of the drug-refractory patients) represents another major EGFR-dependent mechanism [15]. Investigational fourth-generation EGFR TKIs (e.g., EAI045 [16] and JBJ-04-125-02 [17]) were designed to specifically target the EGFR C797S mutant but they have not yet been clinically approved. On the other hand, activation of compensatory bypass pathways, aberrant downstream signaling, or histologic transformation to small-cell lung cancer (SCLC) have been reported to trigger EGFR-independent osimertinib resistance [18, 19]. Importantly, these aberrations can occur simultaneously with EGFR tertiary mutations, underscoring the intriguing heterogeneity of osimertinib resistance.
MET gene amplification represents the most common cause of bypass pathway activation that mediates acquired EGFR TKI resistance (up to 50% after 2nd-line osimertinib failure [12] or 7%–15% after an inadequate response from first-line osimertinib treatment) [13]. The MET gene encodes a cell surface receptor tyrosine kinase, c-Met (also commonly called Met), which regulates an array of intracellular signaling pathways to mediate embryogenesis and wound healing in normal cells. Hepatocyte growth factor (HGF) is a natural high-affinity ligand for Met [20]. In cancer cells, aberrant HGF/Met activation caused by MET gene amplification, mutations, or overexpression leads to persistent activation of the downstream PI3K/Akt, Ras/MAPK, JAK/STAT, SRC, and Wnt/β-catenin pathways to promote cancer progression [20]. To this end, MET amplification is also known as a major mechanism causing intrinsic osimertinib resistance [21, 22]. Indeed, MET amplification could occur concurrently with or without loss of T790M mutation in EGFR TKI-refractory patients. Tremendous amount of research efforts has been invested to investigate novel approaches for overcoming osimertinib resistance.
Consistent with the accumulated understanding of the role of MET amplification in osimertinib resistance, a few recent preclinical investigations revealed the application of Met inhibitors (such as the multi-kinase inhibitor, crizotinib) to circumvent osimertinib resistance in EGFR-mutated and MET-amplified NSCLC cell lines [23, 24]. Moreover, crizotinib+osimertinib combination has also been investigated in osimertinib-refractory NSCLC patients harboring MET amplification in recent clinical trials [25, 26]. Numerous small molecule Met inhibitors have been designed, which generally have a U-shaped conformation and they lodge into the ATP-binding pocket within the activation loop of Met [27].
As MET dysregulation is frequently observed in various cancer types, Met represents an attractive molecular target for cancer therapy [28, 29]. Drug repurposing refers to the identification of new medicinal indications for existing drugs. The aim of this study was to identify new Met-inhibitory candidates from non-oncology drugs to overcome osimertinib resistance both in vitro and in vivo. By using an open-source in silico tool (DRAR-CPI) and a drug-target interactome approach, fexofenadine was found to be a novel Met inhibitor. The mechanisms contributing to the circumvention of osimertinib resistance were thoroughly investigated. The circumvention of osimertinib resistance by fexofenadine was also verified in an osimertinib-refractory NSCLC patient-derived tumor xenograft (PDX) model.
2 Results
2.1 In Silico Identification of Clinically Approved Non-Oncology Drugs With Putative Met Inhibitory Activity
To identify putative Met inhibitors from non-oncology drugs for repurposing to overcome osimertinib resistance, the molecular docking function of an open-source in silico program (DRAR-CPI) [30-32] was utilized to construct a chemical-protein interactome of several known Met inhibitors (including crizotinib, cabozantinib, foretinib, and tivantinib) (Table S1). The two multi-kinase inhibitors (crizotinib and cabozantinib) were chosen because they are clinically approved drugs with potent Met-inhibitory activity [33, 34]. Foretinib (currently in Phase 2 trial) and tivantinib (currently in Phase 3 trial) were selected because of their high specificity and potency toward Met (IC50 for Met in cell-free assay: foretinib = 0.4 nM [35]; tivantinib = 0.13 nM [36].
The top 12 non-oncology drugs displaying the highest association score to the four inputs are known as Met inhibitors (closest to 1 and p value < 0.05) are summarized in Table S2. The priority of the drug candidates is ranked by considering (i) a docking affinity score to c-Met; (ii) drug concentration achievable in vivo; and (iii) the Z' score. The docking affinity score is computed by the server to reflect the interaction strength of the drug molecule with Met. A more negative value suggests a stronger interaction. On the other hand, the Z' score takes into account the interactome profile of the library molecules toward multiple protein targets, thus strengthening the prediction of drug-protein interaction compared to solely using the docking score. A Z'-score of less than −0.5 suggests that the identified drug molecule has a high chance of interacting with the protein of interest [37].
2.2 In Vitro Met Kinase Inhibitory Effect by the Drug Candidates
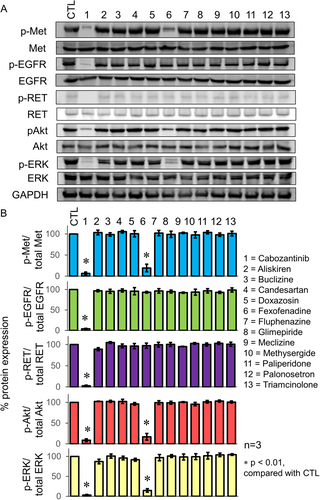
The putative Met-inhibitory drug candidates were tested for their potential inhibitory effect on recombinant Met kinase, corresponding to amino acids 956–1390 of Met, which contains the tyrosine kinase domain. The test was performed using a commercially available kinase inhibition assay kit. Consistent with our hypothesis, two drug candidates (fexofenadine and aliskiren) with the most negative docking affinity score to Met were found to inhibit Met kinase in a concentration-dependent manner (Table S3). Moreover, fexofenadine (and to a much lesser extent, aliskiren) was also found to inhibit phosphorylation of Met and the downstream signaling molecules in an osimertinib-resistant NSCLC cell line, NCI-H820, which harbors EGFR T790M and MET amplification (Figure 1). The Met-inhibitory effect from fexofenadine appears to be specific because it did not affect phosphorylation of EGFR and RET in NCI-H820 cells, which are two tyrosine kinases significantly inhibited by the control multikinase inhibitor cabozantinib (Figure 1). Similar Met-specific inhibitory effect (but not EGFR or AXL) of fexofenadine was also observed in another osimertinib-resistant H1975 OsiR cell model (Figure S1). The binding conformation of fexofenadine to Met (PDB: 3F66) is visualized in Figure S2.
2.3 Kinase Profiling of Fexofenadine
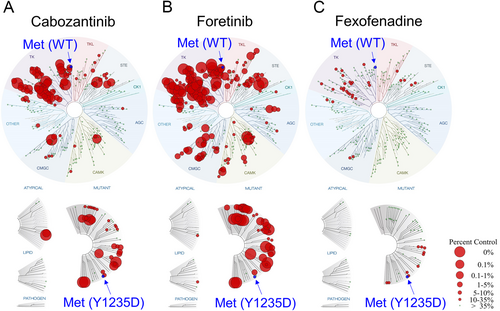
To evaluate the specificity of tyrosine kinase inhibition by fexofenadine, the interaction between fexofenadine and 468 human kinases was quantitatively assessed by Eurofins DiscoverX's KINOMEscan profiling service (scanMAX, Eurofins DiscoverX, Fremont, CA, USA). The TREEspot kinase interaction map showed that fexofenadine exhibited high binding affinity against MET, MET(1250 T), and MET(Y1235D), with corresponding % control values of 28, 16, and 15, respectively (Figure 2; Table S4). The data confirmed that fexofenadine inhibits Met kinase in vitro. Moreover, fexofenadine was also found to share a similar kinase inhibition profile as the control clinically approved multikinase inhibitor cabozantinib, with significant activity against Met, Ret, Axl, and VEGFR2 using Spearman rank-order correlation analysis (correlation coefficient = 0.6789; p < 0.001; n = 328 kinases) (Table S5).
2.4 Fexofenadine Enhanced the Anticancer Activity of Osimertinib in Resistant NSCLC Cells In Vitro
The circumvention of osimertinib resistance by fexofenadine was studied in a few NSCLC cell lines exhibiting different resistance mechanisms (H1975 OsiR, H820, A549; osimertinib-responsive H1975 cells were used as the control for comparison). H1975 OsiR is an osimertinib-resistant NSCLC cell line derived from H1975 after prolonged incubation in increasing concentration of osimertinib for more than 12 months. The MET gene copy number of the NSCLC cell lines was evaluated by a quantitative polymerase chain reaction (PCR) method (MET copy numbers for A549, H1975, H1975 OsiR, and H820 were 2.1, 2.7, 5.3, and 7.2, respectively, which was consistent with the findings reported previously) [38]. H1975 OsiR was also found to exhibit EGFR T790M loss and Met hyper-phosphorylation (Figure S3). The combination of osimertinib and cabozantinib (a control Met inhibitor) was investigated at their equipotent concentrations using median effect analysis. A more pronounced synergistic anticancer effect was observed in the osimertinib-resistant cells (CI = 0.48 ± 0.11, 0.41 ± 0.08, and 0.71 ± 0.12 in H1975 OsiR, NCI-H820, and A549, respectively) than in the osimertinib-sensitive H1975 counterpart (CI = 0.92 ± 0.12) following osimertinib+cabozantinib combination treatment.
Since fexofenadine exhibited the most potent Met-inhibitory effect among the drug candidates screened, it was shortlisted for in-depth investigation in the osimertinib-resistant NSCLC cell lines (H1975 OsiR: EGFR T790M loss and MET amplification; NCI-H820: EGFR T790M and MET amplification; A549: KRAS G12S) (Table 1). As fexofenadine alone (up to the highest concentration tested, 10 μM) did not inhibit cancer cell proliferation by more than 20%, the anticancer effect of the osimertinib+fexofenadine combination was not evaluated by median effect analysis. A fixed concentration of osimertinib was combined with a range of different concentration of fexofenadine (2.5, 5, or 10 μM). Among the NSCLC cell models investigated, fexofenadine could enhance the anticancer activity of osimertinib the most significantly in NCI-H820 cells (displaying MET amplification and EGFR T790M) (Table 1). In osimertinib+fexofenadine combination-treated NCI-H820 cells, simultaneous drug exposure was shown to enhance the anticancer effect to a similar extent as the administration schedules with fexofenadine-preceding-osimertinib or vice versa (% cell viability after simultaneous treatment, fexofenadine-preceding osimertinib, and osimertinib-preceding fexofenadine dosing sequence are 25% ± 7%, 30% ± 4%, and 27% ± 6%, respectively). In a normal bronchial epithelial BEAS-2B cell line, fexofenadine did not significantly increase the cytotoxic effect of osimertinib (Table 1).
| [Fexofenadine] μM | ||||
|---|---|---|---|---|
| Cell viability (%) | 0 | 2.5 | 5 | 10 |
| H1975 (sensitive to osimertinib) | ||||
| No osimertinib | 100% | 101% ± 8% | 97% ± 7% | 88% ± 3% |
| +0.01 μM osimertinib | 52% ± 6% | 57% ± 5% | 49% ± 6% | 41% ± 5% |
| H1975 OsiR (osimertinib-resistant subline derived from H1975) | ||||
| No osimertinib | 100% | 92% ± 4% | 89% ± 6% | 82% ± 7% |
| +5 μM osimertinib | 56% ± 5% | 50% ± 4% | 40% ± 5%* | 30% ± 5%** |
| NCI-H820 (osimertinib-resistant; MET amplification and EGFR T790M) | ||||
| No osimertinib | 100% | 101 ± 7% | 96 ± 6% | 85 ± 8% |
| +5 μM osimertinib | 59% ± 8% | 50% ± 4% | 38% ± 6%* | 25% ± 7%** |
| A549 (osimertinib-resistant; KRAS G12S) | ||||
| No osimertinib | 100% | 98 ± 7% | 99 ± 8% | 84 ± 4% |
| +5 μM osimertinib | 60% ± 9% | 53% ± 7% | 48% ± 6% | 44% ± 4%* |
| BEAS-2B (normal bronchial epithelial cells) | ||||
| No osimertinib | 100% | 101 ± 7% | 94% ± 5% | 95% ± 9% |
| +5 μM osimertinib | 94% ± 6% | 93% ± 5% | 88% ± 7% | 84% ± 8% |
- * p < 0.05
- ** p < 0.01, compared with osimertinib treatment alone without fexofenadine.
2.5 Circumvention of Osimertinib Resistance in NCI-H820 Tumor Xenograft in Nude Mice and Osimertinib-Refractory PDX in NSG Mice
NCI-H820 is a commercially available NSCLC cell line bearing EGFR exon 19 del, T790M, and MET amplification. As reported above, fexofenadine was shown to remarkably enhance the anticancer effect of osimertinib in MET-amplified NCI-H820 cells in vitro. The fexofenadine+osimertinib combination was further investigated in (i) NCI-H820 implanted tumor xenograft in nude mice; and (ii) osimertinib refractory PDX in NSG mice.
When the tumors became palpable at about 14 days following the inoculation of the tumor cell suspension in the flank of the mice, the mice were randomized and treated with the various treatment groups (n = 8/group for NCI-H820 model; n = 6/group for PDX model). In the NCI-H820 tumor xenograft model, the tumor volume was found to be 1027 ± 156, 734 ± 108, and 426 ± 128 mm2 for osimertinib (25 mg/kg/day) alone, fexofenadine (40 mg/kg/day) alone, and osimertinib+fexofenadine combination, respectively (vs. 1240 ± 144 mm2 for control) at the end of the observation period (Day 35). There was remarkably greater inhibition of tumor growth by the osimertinib+fexofenadine combination than by osimertinib or fexofenadine alone (p < 0.01) (Figure 3A,C).
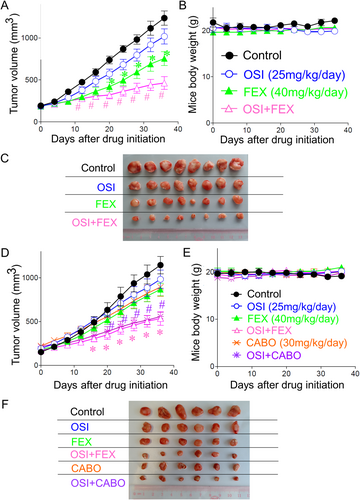
In the osimertinib-refractory PDX model, tumor volume was found to be 950 ± 124, 803 ± 103, 485 ± 125, 845 ± 102, and 516 ± 104 mm2 for osimertinib (25 mg/kg/day) alone, fexofenadine (40 mg/kg/day) alone, osimertinib+fexofenadine combination, cabozantinib (30 mg/kg/day) alone, and osimertinib+cabozantinib combination, respectively (vs. 1164 ± 184 mm2 for control) at the end of the observation period (Day 35). There was significantly greater tumor growth inhibition by the osimertinib+fexofenadine combination than osimertinib/fexofenadine alone; and osimertinib+cabozantinib combinations than osimertinib/cabozantinib alone (p < 0.05). While both osimertinib+fexofenadine and osimertinib+cabozantinib combination exhibited remarkable tumor growth inhibition, the antitumor effect of these two combinations did not show an appreciable difference (Figure 3D,F). All treatment groups and drug combinations were well tolerated without causing notable damage to major organs (Figure S4) or obvious animal body weight loss (Figure 3B,E).
2.6 Transcriptome Profiling of Osimertinib-Resistant NSCLC Cells Following Fexofenadine Treatment
To understand the biological activities of the validated Met inhibitor (fexofenadine), RNA sequencing analysis was performed to investigate the alterations in gene expression patterns in NCI-H820 cells following 24-h treatment with osimertinib (5 μM) alone, fexofenadine (10 μM) alone, or their combination. Total RNA samples were subjected to strand-specific mRNA sequencing on DNBSEQ platform (BGI Genomics, China). The reads were aligned to the control human transcriptome (version GRCh37.75) to estimate the transcript-level abundance. Genes that have a false discovery rate (FDR) < 0.05, fold change > 2, and minimum mean expression across all samples > 1 were considered as differentially expressed genes (DEGs). The gene expression heatmap for showing the characteristic DEGs for the four treatment groups is shown in Figure 4A.
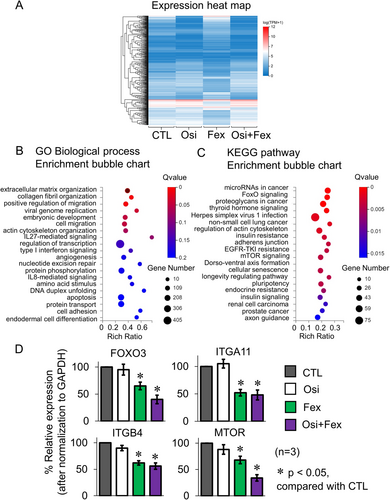
To systematically interpret the biological effect of the identified DEGs, the Dr. Tom multi-omics data visualization system (BGI genomics) was used to analyze the enrichment of the Gene Ontology (GO) terms and KEGG pathways of the DEGs following osimertinib+fexofenadine combination treatment. The most significantly enriched GO terms (under the biological processes category) for the significant DEGs are ranked in Figure 4B. They are related to the biological processes of cell adhesion, extracellular matrix organization, and transcription regulation. The KEGG pathway analysis for the most significant DEGs is shown in Figure 4C. Notably, the top-ranked pathways are related to EGFR TKI resistance, and proapoptotic signaling (FoxO and mTOR). Four representative genes (including FOXO3 (FoxO signaling), ITGA11 (ECM organization), ITGB4 (cell adhesion), and MTOR (EGFR TKI resistance) regulating these biological processes or pathways were selected for reverse transcription-PCR validation. The expression profiles of these candidate genes before and after osimertinib+fexofenadine combination treatment were consistent with the RNA-seq findings (Figure 4D).
Similar findings were also obtained in another osimertinib-resistant H1975 OsiR cell model (exhibiting MET amplification and EGFR T790M loss) after osimertinib+fexofenadine combination treatment (Figure S5). Using the GO terms, the DEGs were significantly enriched in a few biological processes (cell migration, extracellular matrix organization, and transcription regulation). On the other hand, the Hippo signaling, MAPK signaling, and PI3K-Akt signaling pathways, which promote apoptosis, were highly ranked by KEGG analysis.
2.7 Inhibition of Met and Downstream Signaling Pathways by Fexofenadine
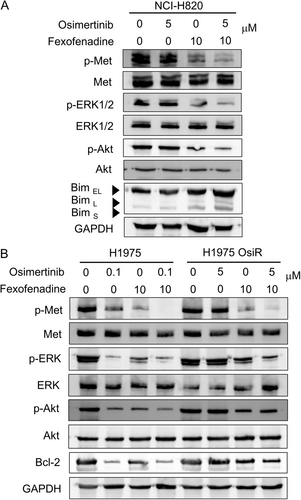
As fexofenadine was shown to potentiate the anticancer effect of osimertinib the most in NCI-H820 (harboring MET amplification and EGFR T790M) among the tested NSCLC cell lines (Table 1), a detailed mechanistic investigation was conducted in NCI-H820. NCI-H820 cells did not respond to osimertinib treatment and they displayed minimal pAkt and pERK inhibition following osimertinib treatment alone. In contrast, compared to osimertinib alone, osimertinib+fexofenadine combination was shown to cause significantly more pronounced pAkt and pERK inhibition, as well as induction of the apoptotic protein Bim (Figure 5A), apparently circumventing osimertinib resistance. Similar inhibition of Met and downstream signaling molecules by the osimertinib+fexofenadine combination was also observed in the other osimertinib-resistant H1975 OsiR cell line (Figure 5B).
2.8 Induction of Apoptosis and Inhibition of Epithelial-Mesenchymal Transition (EMT) by Osimertinib+Fexofenadine Combination
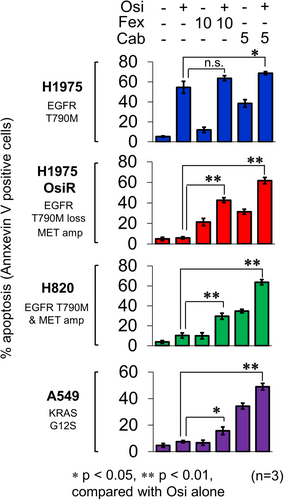
The induction of apoptosis by osimertinib+fexofenadine combination was evaluated in osimertinib-sensitive (H1975) and osimertinib-resistant NSCLC cell lines (H1975 OsiR, NCI-H820, and A549) (Figure 6). The drug combination was found to induce the most pronounced apoptosis in NCI-H820.
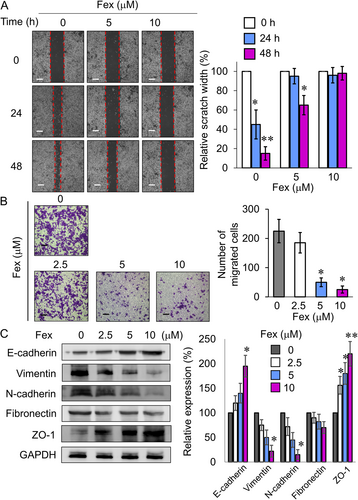
EMT is pivotal for tumor invasion and metastasis and it is strongly associated with osimertinib resistance [39]. Met inhibitors are known to increase E-cadherin expression to reverse EMT [40]. In NCI-H820 cells, fexofenadine was shown to dose-dependently increase E-cadherin and ZO-1 protein expression, but reduce vimentin, N-cadherin, and fibronectin expression, which correlated well with the inhibition of cancer cell migration and invasion (Figure 7). Similar inhibitory effects on cancer invasion and EMT markers by fexofenadine were also noted in osimertinib-sensitive H1975 and -resistant H1975 OsiR cell lines (Figure S6).
3 Discussion
Drug repurposing offers the promise of significant cost and time reduction in the development of new medicine as the formulation, pharmacokinetic properties, adverse effects, and post-marketing surveillance safety data have been established for the repurposed drug candidates [41]. In the current study, we employed an in silico drug repurposing tool (DRAR-CPI) to identify putative Met-inhibitory candidates from approved non-oncology drugs. DRAR-CPI searches the drug repurposing potential of drug candidates by using the chemical-protein interactome compiled in its database [30]. Similarity between the library drugs in DRAR-CPI and the input known Met inhibitors was compared using the chemical-protein interactome analysis. The drug candidates that share the closest similarity with the four known Met inhibitors were shortlisted as putative Met-inhibitory drug candidates for further validation. Among the positive hits identified, fexofenadine was confirmed to be a novel Met-inhibitory drug by cell-free biochemical assay, kinase profiling assay, and cell-based signaling assay.
The reversal of osimertinib resistance by the novel Met-inhibitory drug candidate (fexofenadine) was then investigated in human NSCLC cell models exhibiting different osimertinib resistance mechanisms (MET amplification and EGFR T790M in NCI-H820), MET amplification and EGFR T790M loss in H1975 OsiR, and KRAS G12S mutation in A549). Fexofenadine is an H1-selective and non-sedating antihistamine indicated for the symptomatic relief of seasonal allergic rhinitis or chronic idiopathic urticaria [42]. Interestingly, a recent meta-analysis revealed that antihistamine use (particularly two H1-selective antihistamines, desloratadine, and loratadine) was associated with improved survival for cancer patients [43]. However, the underlying mechanism has not been elucidated. Fexofenadine has also been reported to reduce the abundance of immunsuppressive M2-like macrophages within the tumor immune microenvironment, thereby enhancing T cell antitumor immunity [44]. Our study is the first to demonstrate the novel Met inhibitory activity of fexofenadine. Furthermore, the application of fexofenadine to overcome resistance to anticancer drugs has not been systematically investigated.
The Met inhibitory effect of fexofenadine was ascertained by the cell-free recombinant Met kinase assay (Table S3), though its Met inhibitory effect is less potent than that of the known Met inhibitor cabozantinib (IC50 of fexofenadine and cabozantinib = 54 ± 13 and 2.6 ± 0.5 nM, respectively) against recombinant Met kinase. The kinase selectivity of fexofenadine was evaluated using the KINOMEscan profiling assay. Interestingly, fexofenadine was found to share similar kinase inhibition profile as cabozantinib (Tables S4 and S5). Fexofenadine was also shown to inhibit phosphorylation of Met and downstream signaling molecules in NCI-H820 cells (Figure 1). Interestingly, unlike the control multikinase inhibitor cabozantinib (which inhibits phosphorylation of Met, EGFR, and RET), fexofenadine was found to specifically inhibit Met (but not EGFR and RET in NCI-H820 [Figure 1], nor EGFR and AXL in H1975 OsiR [Figure S1]).
Although fexofenadine alone only displayed mild anticancer effect in the NSCLC cell lines tested, it could dose-dependently enhance the anticancer efficacy of osimertinib in all osimertinib-resistant NSCLC cell models tested (Table 1). BEAS-2B is a normal human bronchial epithelial cell model commonly employed for the evaluating the general toxicity of investigational drugs to lung tissues in a tissue culture system [45]. Fexofenadine alone was not cytotoxic to BEAS-2B cells. Moreover, the osimertinib+fexofenadine combination did not alter the viability of BEAS-2B cells (Table 1). Thus, the osimertinib+fexofenadine combination may produce a preferential anticancer effect on NSCLC cells. In addition, fexofenadine was also found to increase the antitumor efficacy of osimertinib in NCI-H820 tumor xenograft and a PDX derived from an Asian osimertinib-refractory NSCLC patient, thus affirming its potential to circumvent resistance in vivo (Figure 3). Although fexofenadine exhibited a less Met-inhibitory effect and a much milder antitumor effect than cabozantinib (the control Met inhibitor), it is remarkable that the osimertinib+fexofenadine combination was only slightly less potent and statistically insignificant than the osimertinib+cabozantinib combination in the PDX model (Figure 3F). In this study, the enhancement of osimertinib activity by fexofenadine was only tested in one PDX model demonstrating MET amplification. Apart from MET amplification and overexpression, MET exon 14 skipping mutation represents another important oncogenic driver in NSCLC. While MET amplification was significantly associated with Met overexpression, the co-occurrence rate of MET exon 14 skipping mutation and MET amplification varies considerably (0%–40.5%) [22, 23]. As NSCLC is known to be highly heterogeneous, the investigation of fexofenadine+osimertinib combination in other PDX models displaying different genetic abnormalities is warranted to facilitate clinical translation.
In all NSCLC cell lines investigated, fexofenadine induced mild but concentration-dependent apoptosis. Importantly, the osimertinib+fexofenadine combination was found to trigger more pronounced apoptosis than the two individual drugs alone, particularly in the osimertinib-resistant NSCLC cells (H1975 OsiR, NCI-H820, and A549) (Figure 6). EMT, a prominent oncogenic process responsible for invasion and metastasis of cancer cells, is an important mechanism leading to osimertinib resistance [46]. To this end, fexofenadine was shown to suppress cancer migration and invasion in the osimertinib-resistant NCI-H820 cells, which was accompanied by the induction of E-cadherin and ZO-1; but reduction of vimentin, N-cadherin, and fibronectin (Figure 7C). Since reduced apoptosis and EMT are commonly reported in osimertinib-resistant NSCLC, these mechanisms may be associated with the circumvention of osimertinib resistance by osimertinib+fexofenadine combination.
The mechanisms triggering the induction of apoptosis and inhibition of EMT by fexofenadine were further evaluated by RNA sequencing analysis. In NCI-H820 cells, the osimertinib+fexofenadine combination was shown to modulate genes predominantly in biological processes related to cell adhesion and extracellular matrix organization, as well as pathways relevant to apoptosis and EGFR TKI resistance (FoxO and mTOR signaling). Representative genes (FOXO3, ITGA11, ITGB4, and MTOR) were also found to be significantly inhibited by the osimertinib+fexofenadine combination (Figure 4). Similar findings were also observed in the other osimertinib-resistant NSCLC cell (H1975 OsiR) (Figure S5). The modulation of the apoptotic and EMT-related pathways is likely responsible for the circumvention of osimertinib resistance by fexofenadine. This study is apparently the first in-depth study about the modulation of cancer-related pathways by fexofenadine.
A recent clinical study investigated the modulation of fexofenadine pharmacokinetics by osimertinib in advanced NSCLC patients [47]. Upon the coadministration of osimertinib (given once daily) and fexofenadine, the area under the plasma concentration-time curve and maximum concentration for fexofenadine was increased by 27% (90% CI, 11.2–45.8) and 25% (90% CI, 5.6–48.1), respectively. The increase in fexofenadine exposure following osimertinib coadministration was consistent with the fact that osimertinib is a weak P-glycoprotein inhibitor. Importantly, no new osimertinib/fexofenadine safety findings were observed [47].
It has been recently reported that the retention of osimertinib and its active metabolite AZ5104 in the brain could be reduced by two major drug-efflux pumps (ABCB1 and ABCG2) [48]. Therefore, the pharmacological inhibition of ABCB1 and ABCG2 during osimertinib therapy has been proposed to benefit cancer patients, especially those with brain metastases or with high expression of the transporters in the tumor cells, without invoking toxic side effects [48]. We found that fexofenadine did not influence the transporter activity of ABCB1 or ABCG2 (Figure S7). In agreement with these findings, fexofenadine did not appreciably alter the plasma and tumoral level of osimertinib in the PDX study (Table S6).
In conclusion, the antihistaminergic drug fexofenadine was identified for repurposing as a Met inhibitor to overcome osimertinib resistance both in vitro and in vivo. The circumvention of drug resistance involved the inhibition of Met and other downstream signaling pathways, subsequently leading to the induction of apoptosis and suppression of cell migration/EMT. As fexofenadine is clinically approved, the findings advocate its translation into clinical practice to improve the efficacy of EGFR-targeted cancer therapy in NSCLC patients.
4 Materials and Methods
4.1 Cell Lines and Chemicals
Human NSCLC cell lines A549, H820, and H1975 were bought from the ATCC (Manassas, VA, USA). H1975 OsiR is an osimertinib-resistant subline derived from H1975 by drug selection in progressively increasing osimertinib concentration (up to 10 μM) for more than 12 months. The human bronchial epithelial BEAS-2B cells (from ATCC) were used to test the general drug toxicity in normal tissues. All cell lines have undergone authentication by short tandem repeat analysis for identity confirmation and tested mycoplasma-free.
Cabozantinib, crizotinib, ferotinib, tivantinib and the putative Met-inhibitory drug candidates (aliskiren, buclizine, candesartan, doxazosin, fexofenadine, fluphenazine, glimepiride, meclizine, methysergide, paliperidone, palonsetron, and triamcinolone) were obtained from Cayman Chemical Company (Ann Arbor, MI, USA).
4.2 In Silico Identification of Met Inhibitory Drugs by Constructing Chemical-Protein Interactome of Known Met Inhibitors
To identify putative Met inhibitors from non-oncology drugs for repurposing to overcome osimertinib resistance, the molecular docking function of an open-source DRAR-CPI platform [29-31] was utilized to construct a chemical-protein interactome of the four known Met inhibitors (crizotinib, cabozantinib, foretinib, and tivantinib) (Table S1). DRAR-CPI compiles three-dimensional structures of 385 targetable human proteins and 254 small molecules with established molecular targets. The server was designed to assess the associations between the drug of interest (i.e., to be repurposed) and the library drugs according to their docking configurations towards the presumed targets, with an aim to identify new indications for the drug of interest [49-51]. In our study, the structures of the four known Met inhibitors (crizotinib, cabozantinib, foretinib, and tivantinib) were uploaded to construct a chemical-protein interactome. The web server employed a docking program to compute the binding energy between each of the four Met inhibitors and the collection of 385 targetable human proteins in the database.
Association scores between the four uploaded Met inhibitors and the 254 library drugs in the database were compared, reflecting the degree of similarity of their interaction profiles across the collection of 385 targetable human proteins in the Chemical-Protein Interactome analysis. A p value was calculated using the Kolmogorov–Smirnov statistic to evaluate the probability of similarity between the library drugs and each of the four uploaded Met inhibitors. A smaller p value suggests a higher similarity.
4.3 Kinase Profiling Assay
The selectivity of interactions between the putative Met inhibitors and 468 human kinases were quantitatively measured using Eurofins DiscoverX's KINOMEscan profiling service (scanMAX, Eurofins DiscoverX, Fremont, CA, USA). KINOMEscan employs an active site-directed competition binding assay to quantitatively measure the interaction between the tested compound and the kinases in a quantitative manner [52]. Since the KINOMEscan assay does not require ATP, the readout reflects the true thermodynamic interaction affinities between the tested compound and the target kinase. Fexofenadine was tested at 1 μM, and the interaction is reported as “% control.” The “% control” is calculated as 100 × (test compound signal – positive control signal)/(negative control signal – positive control signal). The kinase interaction profile was processed using TREEspot, which is a data visualization software developed by KINOMEscan. The similarity in kinase inhibition profile of the tested drug candidates was compared with the control Met inhibitors (cabozantinib and foretinib) using Spearman rank-order correlation analysis.
4.4 In Vitro Cell-Free Met Kinase Inhibition Assay
A commercially available Kinase-Glo® luminescence-based Met kinase assay (Promega, Madison, WI, USA) was used to examine the activity of a recombinant human Met protein (active catalytic subunit; SignalChem Biotech, Richmond, Canada) in the presence of the putative Met-inhibitory drugs. ATP was consumed by the in vitro kinase reaction. The ATP remaining at the end of the kinase reaction served as a substrate for the Ultra-Glo® luciferase to catalyze the mono-oxygenation of luciferin to produce luminescence signal, which was measured in RLUs on a FLUOstar plate reader. Luminescence is inversely proportional to the kinase activity.
4.5 Cell Proliferation Assay and Drug Combination Analysis
The cell proliferation assay was conducted according to a standard sulforhodamine B (SRB) protocol previously reported [53]. Briefly, cells (2 × 10³ – 5 × 10³ cells/well, in 100 µL complete culture medium) were seeded in a 96-well plate. After 24 h, the cells were incubated with osimertinib alone, cabozantinib alone, the Met-inhibitory drug candidate alone, or a combination of osimertinib+cabozantinib/Met-inhibitory drug (at their equipotent molar ratio) for 72 h. Afterwards, trichloroacetic acid (50% w/v; 50 μL/well) was added to fix the cells at 4°C for 1 h. Then, the cells were stained with SRB solution (0.4% w/v in 1% acetic acid; 50 µL/well) for 1 h at ambient temperature. The plates were subsequently washed with 1% acetic acid. Finally, the bound SRB stain on the cells was dissolved in Tris-HCl buffer solution (10 mM; 150 μL/well), and measured at 570 nm.
When the Met-inhibitory drug candidate alone was significantly cytotoxic, the combination of osimertinib and the Met-inhibitory candidate was analyzed by the median-effect method [54]. The combination index (CI) was computed using the formula: CI = (D)1/(Dx)1 + (D)2/(Dx)2. (D)1 and (D)2 are the concentration of drug 1 and drug 2, respectively, in the combination that inhibit cell proliferation by 50% whereas (Dx)1 and (Dx)2 are the concentration for the two drugs alone that inhibit cell proliferation by 50%. CI < 1, = 1, and > 1 indicates synergistic, additive, and antagonistic combination effects, respectively. On the other hand, if the Met-inhibitory drug alone only slightly inhibited cell proliferation, the enhancement of osimertinib-induced cell growth inhibition by the Met-inhibitory drug was evaluated.
4.6 Quantitative Real-Time Polymerase Chain Reaction (PCR)
Total RNA was extracted from the cells following the drug treatments (24 h) using the TRI Reagent® (Molecular Research Center, Cincinnati, OH, USA). Reverse transcription was carried out using 1 μg total RNA with the PrimeScript First Strand cDNA Synthesis Kit (TaKaRa, Beijing, China) at 37°C for 10 min. The cDNA was then amplified by quantitative real-time PCR to compare the relative expression of FOXO3, ITGA11, ITGB4, and MTOR using the Premix Ex Taq DNA polymerase (TaKaRa) with a LightCycler 480 (Roche Applied Science, Indianapolis, IN, USA). GAPDH was detected for normalization. Specific primer sequences used in the PCR reactions are: FOXO3, forward 5′-TCTACGAGTGGATGGTGCGTTG-3′ and reverse 5′-CTCTTGCCAGTTCCCTCATTCTG-3′; ITGA11, forward 5′-GCCTCCAGTATTTTGGCTGCAG-3′ and reverse 5′-GCTCAAAGTGGAGGCTGGCATT-3′; ITGB4, forward 5′-AGGATGACGACGAGAAGCAGCT-3′ and reverse 5′-ACCGAGAACTCAGGCTGCTCAA-3′; MTOR forward 5′-AGCATCGGATGCTTAGGAGTGG-3′ and reverse 5′-CAGCCAGTCATCTTTGGAGACC-3′, and GAPDH, forward 5′-ACCACAGTCCATGCCATCAC-3′ reverse 5′-TCCACCACCCTGTTGCTGTA-3′. The temperature program for the PCR reactions was: Initial denaturing at 95°C for 5 min, followed by 40 cycles of denaturing at 95°C for 10 s and annealing plus extension at 60°C for 10 s. SYBR Green fluorescent signal was detected at the end of every PCR cycle to monitor the amount of double-stranded DNA amplified. ΔCt was calculated by subtracting the Ct of GAPDH from the Ct of the respective gene of interest. Relative gene expression was calculated by the 2−ΔΔCt method.
4.7 Analysis of MET Amplification
A quantitative real-time PCR-based method was adopted by Onozato et al. to determine the copy number of the MET gene in the NSCLC cell lines and PDX tumor specimens [55]. The copy number of the LINE-1 repetitive element was known to be similar in normal and cancerous cells [56]. A standard curve method was used to determine the MET gene copy number in the NSCLC cell lines or the patient's tumor DNA sample relative to LINE-1. Standard curves were constructed from a serial dilution of genomic DNA sample harvested from Calu6 cells, where the amount of MET gene relative to LINE-1 was equal to 1. Specific primer sequences are: MET, forward 5′-TAGAAGAGCCCAGCCAGTGT-3′ and reverse 5′-CGAATGCAATGGATGATCTG-3′; LINE-1, forward 5′-AAAGCCGCTCAACTACATGG-3′ and reverse 5′-TGCTTTGAATGCGTCCCAGAG-3′. The MET gene was considered amplified when the copy number was found to be greater than 2.
4.8 Western Blot Analysis
Cells were harvested in RIPA lysis buffer supplemented with the Halt protease and phosphatase inhibitor cocktail (Thermo Scientific, Carlsbad, CA, USA). Whole-cell lysates were loaded on SDS-PAGE for Western blot analysis. The separated proteins on the gels were transferred to a PVDF membrane for incubation with specific antibodies (Met, phospho-Met, Akt, phospho-Akt, ERK1/2, phospho-ERK1/2, Bim, E-cadherin, fibronectin, N-cadherin, vimentin, ZO-1 or GAPDH; Cell Signaling Technology, Danvers, MA, USA). The specific protein bands were detected by chemiluminescence using the WesternBright ECL HRP substrate (Advansta, San Jose, CA, USA) on the ChemiDoc MP System (Bio-Rad Laboratories, Hercules, CA, USA).
4.9 Apoptosis Assay
Cultured cells were incubated with osimertinib alone (0.1 μM for H1975 or 5 μM for the other cell lines tested), fexofenadine alone (10 μM), cabozantinib alone (1 μM) or combinations of osimertinib and fexofenadine/cabozantinib for 48 h. Cell apoptosis was detected by the Annexin V-FITC/7-AAD Apoptosis Kit (Elabscience, Houston, TX, USA) on a BD FACSymphony A3 Cell Analyzer. For each sample, 10,000 events were acquired and the data were analyzed using the BD FACSDiva software (BD Biosciences, Franklin Lakes, NJ, USA).
4.10 Transcriptome Profiling Analysis
To evaluate the dynamic changes in gene expression profiles induced by the most promising Met inhibitory drug candidate, RNA sequencing was conducted on total RNA samples obtained from representative osimertinib-resistant cell models (NCI-H820 and H1975 OsiR) before and after treatment with osimertinib alone, fexofenadine alone, or their combination. The total RNA samples were subjected to strand-specific mRNA sequencing on the DNBSEQ platform (BGI Genomics, Shenzhen, China). The reads were aligned to the control human transcriptome (version GRCh37.75) to estimate the transcript-level abundance. Genes that had an FDR < 0.05, fold change > 2, and minimum mean expression across all samples > 1 were considered as DEGs. Transcriptomic data were analyzed and visualized using Dr. Tom's Data Visualization Solution (BGI Genomics). GO analysis was conducted to evaluate the DEGs and to dissect the gene regulatory networks according to biological processes and molecular functions. Pathway analysis was conducted to find out the significant KEGG pathways of the DEGs.
4.11 Scratch Wound Healing Assay
NCI-H820 cells were seeded in a 60-mm tissue culture dish for 24 h. When the cell confluence reached around 70%, a scratch was created on the cell monolayer using a sterile pipette tip. Afterward, the cells were incubated with fexofenadine (5 or 10 μM) or culture medium (control). Cell migration and closure of the wound at 0, 24, and 48 h were monitored under a light microscope. The wound healing rate was measured as the change in the scratch width over time.
4.12 Transwell Cell Invasion Assay
The invasion of NCI-H820 cells was evaluated in transwell insert chambers (8-μm pore size polycarbonate membrane, 24-well companion plate; BD Biosciences, Bedford, MA, USA) coated with Matrigel (Corning, Glendale, AZ, USA). NCI-H820 cells (5 × 10⁵) were seeded into the transwell inserts in RPMI 1640 culture medium (without serum) containing 0, 5, or 10 μM fexofenadine. Culture medium (500 μL) supplemented with 10% fetal bovine serum was added to the lower companion well. After 48 h of incubation, non-invading cells remaining on the upper surface of the transwell membrane were removed with cotton wool. The cells that had invaded across the transwell membrane were located on the lower surface of the inserts. They were fixed with 4% (w/v) paraformaldehyde, stained with 0.4% (w/v) crystal violet, and thoroughly washed with phosphate-buffered saline. The stained cells in random fields were counted and representative images were captured with a light microscope.
4.13 Patient-Derived Tumor Xenograft (PDX)
The antitumor activity of osimertinib-fexofenadine combination was further evaluated in male NOD SCID gamma (NSG; NOD. Cg-PrkdcscidIl2rgtm1Wjl/SzJ strain; 6–8 week-old) mice bearing PDX [57] or athymic nude mice (BALB/c CAnN. Cg-Foxn1nu strain; 6–8 week-old) inoculated with NCI-H820 tumor xenografts. For the PDX model, tumor tissues were obtained from an osimertinib-refractory Asian NSCLC patient (Table S7). The work was approved by the Research Ethics Committee (Kowloon Central/Kowloon East, Hospital Authority, Hong Kong SAR, China) (reference number: KC/KE-17-0229/ER-1) and the CUHK Animal Experimentation Ethics Committee (approval number 21-097-HMF). Briefly, the PDX tumor tissues were subcutaneously injected into the flank of NSG mice (18–24 g). For the NCI-H820 tumor xenograft, 1 × 10⁷ cells (in 100 μL PBS) were inoculated into the flank of athymic nude mice. Drug treatment was commenced approximately 2 weeks after the inoculation of the PDX tumors/cell line when the tumor mass became palpable. The experimental mice were maintained under 12-h light and 12-h dark conditions, with The treatment groups (n = 8 and n = 6 per group for NCI-H820 xenograft and PDX, respectively) were as follows: (i) Control; (ii) osimertinib (25 mg/kg/day); (iii) fexofenadine (40 mg/kg/day); (iv) osimertinib (25 mg/kg/day) + fexofenadine (40 mg/kg/day) combination; (v) cabozantinib (30 mg/kg/day); and (vi) osimertinib (25 mg/kg/day) + cabozantinib (30 mg/kg/day) by oral gavage daily for 35 days. The dose and schedule of osimertinib or cabozantinib used were adapted from previous studies demonstrating potent tumor growth inhibition [58, 59]. Tumor size was measured daily with a Vernier caliper and tumor volumes were calculated using the formula [tumor volume = 0.5 × (longest diameter) × (shortest diamete)2]. Animal body weight, mortality and morbidity were monitored daily. At termination, the mice were killed by cervical dislocation.
4.14 ABCB1 and ABCG2 Transporter Drug Efflux Assay
Drug efflux assay was conducted on a BD FACSymphony A3 Cell Analyzer (BD Biosciences) according to our established protocol to investigate the potential modulation of ABCB1 or ABCG2 transport activity by fexofenadine in HEK293 cells stably transfected with either of the two individual transporters [60]. PSC833 and FTC (specific ABCB1 and ABCG2 inhibitor, respectively) were used as positive control.
4.15 Measurement of Plasma and Tumoral Osimertinib Level by LC-MS/MS Assay
A sensitive LC-MS/MS method (using the Agilent 6430 triple quadrupole mass spectrometer) was employed to measure the plasma and tumoral osimertinib level according to the method described by Zheng et al. [61] with minor modification. Chromatographic separations were performed on a Zorbax Eclipse XDB-C18 column (4.6 × 250 mm, 5 μm, Agilent Technologies). The samples were run by gradient elution with 0.1% (v/v) formic acid and 10 mM ammonium acetate in water and acetonitrile as the mobile phase. The mass spectrometer was run using the positive electrospray ionization mode (spray voltage = +4500 V; vaporizer temperature = 500°C; pressure of the collision gas = 1.0 mTorr). The collision energies for osimertinib and nilotinib (internal standard) were maintained at 34 and 40 eV, respectively. The selected reaction monitoring method was used to quantify osimertinib (m/z 500.4 → 427.4) and nilotinib (internal standard; m/z 530.1 → 289.1). Blood was drawn at 3 h after the last osimertinib dosing (~tmax of osimertinib) and before animal sacrifice to measure plasma osimertinib concentration. Tumor xenografts were also excised to measure the tissue retention of osimertinib by LC-MS/MS.
4.16 Statistical Analysis
All experiments were performed at least three times. Data were presented as mean ± standard deviation. Two-tailed Student's t-test was used to compare two experimental groups statistically. For the comparison of three or more groups, one-way ANOVA followed by Tukey's multiple comparison test was used to determine if there was a statistically significant difference. *p-value < 0.05 was set as the threshold for statistical significance.
Author Contributions
Kenneth K. W. To: conceptualization (lead), data curation (equal), formal analysis (lead), funding acquisition (lead), investigation (lead), methodology (equal), project administration (lead), resources (equal), supervision (lead), validation (equal), visualization (equal), writing – original draft (lead), writing – review and editing (lead). Kwong-Sak Leung: conceptualization (equal), funding acquisition (equal), methodology (equal), software (equal), supervision (equal), writing – review and editing (equal). William C. Cho: conceptualization (equal), formal analysis (equal), funding acquisition (equal), investigation (equal), methodology (equal), resources (equal), supervision (equal), validation (equal), visualization (equal), writing – review and editing (equal). All authors have read and approved the final manuscript.
Acknowledgments
We thank Drs. James Chow and Ka-Man Cheung (Queen Elizabeth Hospital, Hong Kong SAR, China) for providing patient-derived xenograft models. We gratefully acknowledge the support provided by the Food and Health Bureau HKSAR (Health and Medical Research Fund 08190616), Guangdong-Hong Kong-Macao New Drug Screening Joint Laboratory (Project 8326200), and Institute of Chinese Medicine CUHK (SKL Open Fund SKLOF-X).
Ethics Statement
The collection and use of patient-derived tumor specimens for research was approved by the Research Ethics Committee (Kowloon Central/Kowloon East, Hospital Authority, Hong Kong SAR, China) (reference number: KC/KE-17-0229/ER-1). The animal experiment protocol was approved by the Chinese University of Hong Kong Animal Experimentation Ethics Committee (approval number 21-097-HMF).
Conflicts of Interest
The authors declare no conflicts of interest.
Open Research
Data Availability Statement
All data generated in this study are included within the paper and its supplementary files. The raw RNA-seq data reported in this paper have been deposited in the Genome Sequence Archive [62] in the National Genomics Data Center [63], China National Center for Bioinformation/Beijing Institute of Genomics, Chinese Academy of Sciences (GSA-Human: HRA010221) that are publicly accessible at https://ngdc.cncb.ac.cn/gsa-human).


