ImmunoCheckDB: A Comprehensive Platform for Evaluating Cancer Immunotherapy Biomarkers Through Meta-Analyses and Multiomic Profiling
ABSTRACT
Immune checkpoint inhibitors (ICIs) have transformed cancer immunotherapy, but their clinical efficacy varies significantly due to tumor heterogeneity and patient-specific factors. Existing databases lack comprehensive integration of ICI efficacy data and fail to explore biomarkers across pan-cancer contexts, limiting their utility in precision oncology. To address this gap, we developed ImmunoCheckDB, a systematic platform that curates 173 studies on cancer ICI treatment, integrating survival outcomes for traditional and network meta-analyses with multiomic data sets from public repositories, including over 93,000+ individuals across 18 cancer types and 30 ICI regimens to provide a robust resource for pan-cancer biomarker discovery. Equipped with online tools for meta-analysis, network meta-analysis, and multiomic profiling, ImmunoCheckDB enables researchers to investigate correlations between ICI efficacy and molecular biomarkers, featuring key functionalities such as real-time visualization of forest plots, funnel plots, and network diagrams, as well as association analyses linking multiomic data to clinical outcomes. Uniquely combining meta-analytical with multiomic exploration, our platform offers insights into optimal patient populations for ICI therapy, thereby bridging the gap between clinical data and molecular research to empower researchers in advancing precision immunotherapy, with access available at https://smuonco.shinyapps.io/ImmunoCheckDB/ to democratize data-driven insights for personalized cancer treatment.
1 Introduction
Immune checkpoint inhibitors (ICIs) block the interaction between tumor and immune checkpoint proteins on immune cells like NK cells, macrophages, and T cells, preventing tumor-immune escape [1, 2]. Common ICI targets include CTLA-4, PD-1, and PD-L1. Immunotherapy, alone or in combination with chemotherapy, often confers greater clinical benefits than chemotherapy alone [3]. For example, in non-small cell lung cancer (NSCLC), the combination of immunotherapy and chemotherapy is more effective, with patients having a tumor proportion score of 50% or higher deriving greater benefit from immunotherapy [4]. Although ICI therapies have brought significant clinical benefits to patients with solid tumors, the efficacy of ICIs in different regimens (used alone or in combination) varies notably across distinct tumor types [5-12]. Several studies indicate that variations in the therapeutic efficacy of ICIs may stem from differences in biomarker expression levels among patients. For example, studies have demonstrated the correlation between tumor mutational burden and the prognosis of ICI treatment across diverse cancer types [13]. Furthermore, the significance of genes such as PDCD1 and LAG3, which are intricately associated with T-cell function, has also been demonstrated in relation to the efficacy of ICIs among cancers [14]. Therefore, to improve the survival benefit of tumor patients treated with ICIs, it is particularly important to comprehensively explore the optimal dosing regimen for ICI therapy and evaluate biomarkers of ICI efficacy [15-19].
Meta-analyses, including traditional (non-network) and network meta-analyses, are widely used quantitative methods to synthesize and compare results from multiple studies with shared objectives. They are widely applied to assess the efficacy of clinical treatments in oncology. Compared with individual studies, non-network meta-analyses can better unearth the differences and similarities between different interventions, which is important in evidence-based medicine [20]. When direct comparisons between different interventions are impossible, network meta-analysis offers a unique advantage. Network meta-analysis can indirectly compare different interventions for the same clinical problem and explore the effectiveness and safety of different interventions [21]. To address the diverse analytical needs in immunotherapy efficacy research, our platform provides both non-network meta-analysis and network meta-analysis to complement each other in exploring data related to the efficacy of immunotherapy, both directly and indirectly. Non-network meta-analysis and network meta-analysis have been used extensively to assess the clinical value of ICIs [22-27]. For example, Helali et al. [22] used non-network meta-analysis to compare clinical benefits of ICIs versus chemotherapies in advanced gastric cancer trials (e.g., KEYNOTE-061/062). The analysis showed that ICIs significantly prolonged overall survival and reduced mortality risk compared to conventional chemotherapy.
Multiomic studies have been widely used to explore the mechanism of drug therapy with ICIs and treatment-related markers of ICIs. Wang et al. [28] calculated mutation rates in 2518 gastroesophageal adenocarcinoma samples from the Caris Life Sciences database and compared mutation rates and ICI efficacy across three PD-L1 combined positive score (CPS) subgroups. The results showed that genetic alterations in KRAS, TP53, and the RAS-MAPK pathway were associated with a higher PD-L1 CPS. Patients harboring TP53 mutations had shorter overall survival, while those with RAS-MAPK pathway mutations survived longer. This suggests that TP53 mutations and RAS-MAPK pathway alterations may serve as predictive markers for the efficacy of ICIs in patients with gastroesophageal adenocarcinoma. In addition, multiomic studies of ICIs can be used to explore the molecular mechanisms of resistance to immunotherapy. Wang et al. [29] observed a significant association between primary resistance caused by AKT1 and CDH1 mutations and adverse mPFS in gastrointestinal cancer patients with a deficient mismatch repair (dMMR)/microsatellite instability-high (MSI-H) status, despite the typically favorable response of dMMR/MSI-H patients to ICIs [30-32].
Recently, many web-based tools have been developed to help researchers, especially those without bioinformatics and programming skills, conduct meta-analysis and multiomic analysis. For example, MetaInsight [33] enables network meta-analysis with user-provided datasets and offers real-time visualizations. IPDmeta [34] allows meta-analysis and visualization of uploaded patient data. CAMOIP [35], TISMO [36], and other tools focus on tumor immunotherapy-related multiomic studies. However, these tools mainly analyze ICIs within specific cancer types. With the understanding of ICIs' upstream mechanisms and similarities among cancers, pan-cancer biomarker research has become increasingly important [37-39]. Unfortunately, a web-based tool does not yet exist that addresses the comparative analysis of efficacy data of ICIs and their association with different multiomics markers among cancers. Additionally, existing databases either contain limited data (in quantity or type) or only support analysis of user-uploaded data, failing to comprehensively collect and organize clinical trial and multiomic experimental data from published literature. Thus, a web tool enabling joint exploration of ICI efficacy and corresponding biological markers at the pan-cancer level is urgently needed.
Here, we developed a web tool called ImmunoCheckDB to enable the exploration of efficacy data from clinical trials on ICIs and multi-omics targets at the pan-cancer level through online meta-analysis and multiomic analysis. We comprehensively collected data on the efficacy of ICIs against all tumors from published studies along with patients' multiomics data to support diverse aggregation analyses and visualizations. ImmunoCheckDB aims to become an important meta-analysis tool for cancer immunotherapy, which we hope will help biomedical researchers better explore decision-making and molecular markers of immunotherapy. ImmunoCheckDB can be accessed at https://smuonco.shinyapps.io/ImmunoCheckDB/.
2 Results
2.1 Overview
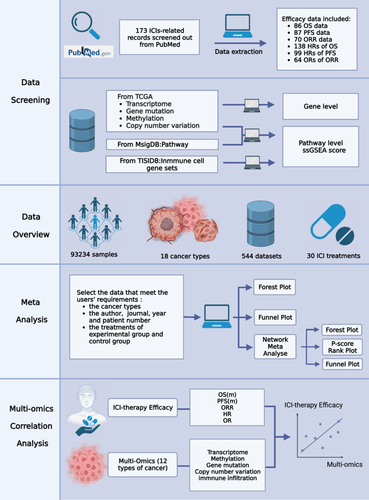
As shown in Figure 1, ImmunoCheckDB included 173 studies on cancer ICI treatment, involving a sample size of 93,234 individuals, 18 cancer types, and 30 ICI treatments. The included data contained 86 sets of median overall survival (mOS) data, 87 sets of mPFS data, 70 sets of objective response rate (ORR) data, 138 sets of HR values for mOS, 99 sets of HR values for mPFS, and 64 sets of ORR values. Notably, ImmunoCheckDB not only facilitates meta-analysis but also provides a broad spectrum of integrated analyses combining multiomics data with immunotherapy clinical data, including transcriptomics, epigenomics, genomics (CNV and mutations), and immune infiltration. Within ImmunoCheckDB, three commonly used meta-analysis types and their corresponding visualization features are readily accessible: the Survival Data page allows for non-network meta-analysis of mOS, mPFS, and ORR across different trials; the Clinical Benefit Ratio page provides non-network meta-analysis of HR values for mOS, HR values for mPFS, and OR values for ORR across different trials; and the Network Meta-analysis page offers network meta-analysis for HR values of mOS, HR values of mPFS, and OR values of ORR from various trials. Furthermore, the Multiomic Association Analysis page facilitates the examination of associations between multiomic data and patient survival data.
2.2 Non-Network Meta-Analysis
In the non-network meta-analysis module, users can freely select the survival information, ICI treatment modalities, and cancer types of interest for meta-analysis to obtain real-time visualization results. The Survival Data page offers meta-analyses for three survival data measures, namely, mOS, mPFS, and ORR, while the Clinical Benefit Ratio page provides meta-analyses for the corresponding HR values of mOS, HR values of mPFS, and OR values of ORR. To select trials to be included in the meta-analysis, users can filter by author, year, and article-specific information or find trials of interest by keyword. All included studies are presented in detail in a summary table and are available for download in CSV format. In addition, ImmunoCheckDB provides a variety of model settings and subgroup analysis functions for setting specific parameters for meta-analysis. Among them, ImmunoCheckDB uses a mixed-effects model by default and provides a fixed-effects model or random-effects model for users to choose according to their needs. The subgroup analysis function includes subgroup differentiation of cancer types and treatment modalities. Finally, in terms of visualization, ImmunoCheckDB supports the visualization of forest plots and funnel plots for meta-analysis and provides a variety of visualization customization functions and download functions, which are convenient for users to obtain high-quality visualization results.
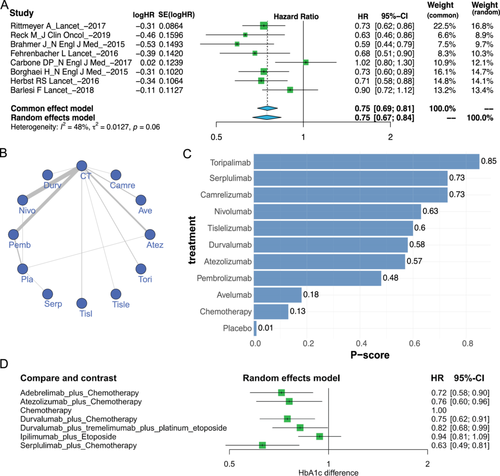
As an example, consider the meta-analysis of ICI-related treatments for NSCLC. Hazard ratios for median overall survival (mOS-HR) were analyzed in patients receiving monotherapy with avelumab, nivolumab, atezolizumab, or pembrolizumab versus those receiving chemotherapy. We included mOS-HR from a total of eight trials and performed a meta-analysis using a fixed-effects model and a random-effects model. The results of the meta-analysis obtained using ImmunoCheckDB are shown in Figure 2A, which is consistent with the findings from Sun et al.'s study [40].
2.3 Network Meta-Analysis
In the network meta-analysis module, users can indirectly compare multiple ICI treatment modalities to explore the potential optimal treatment modalities. The network meta-analysis page allows for network meta-analysis of HR values for mOS, HR values for mPFS, and OR values for ORR. Similarly, when screening studies for inclusion, users can filter carefully by various criteria (e.g., year of publication, publication information, etc.), and download details of the screened studies is also supported. Importantly, unlike non-network meta-analyses, when performing a network meta-analysis, the user must select a treatment as the baseline intervention to be analyzed as the baseline standard against which other treatments will be compared. After completing the customization of the settings for the parameters of the network meta-analysis, ImmunoCheckDB provides three convenient forms of visualization: a network graph, forest plot, and bar graph (Figure 2B–D). The network relationship graph shows the number of patients included and the comparison results of different treatment modalities selected by the user. The forest plots and bar charts, on the other hand, illustrate the comparison of various treatment modalities, along with the ranking of the significance of effects when compared to baseline interventions. We performed a net meta-analysis of the OS of the six trials and obtained the results shown in the plot (Figure 2D), which were highly similar to a study by Wang et al. [41]. All of the above visualizations are available in high-resolution PDF format at the download button in the corresponding plot area.
2.4 Multiomic Association Analysis
In the multiomics analysis module, users can explore the association analysis between ICI efficacy and multiomics, which can better serve further research on the molecular features affecting the clinical benefit of ICIs. The multiomics association analysis page provides the association analysis between the survival data of patients treated with ICIs and the multiomics data of the corresponding cancer types. ImmunoCheckDB provides tumor multiomic data at the single-gene or pathway levels for transcriptome, methylome, genome (CNV and mutation) and tumor-immune infiltration. Users can analyze associations by selecting the ICI survival information of interest and the corresponding specific multiomic data type. A major highlight of ImmunoCheckDB is its ability to cater to users' precise needs for survival data related to ICI drugs. It provides a wealth of screening information for ICI drugs, including PD-1 and PD-L1. Detailed summaries of the association analysis, along with real-time visualizations in the form of scatter plots, are promptly presented on the webpage. Two commonly used statistical algorithms [42], Spearman and Pearson association analysis, are provided simultaneously.
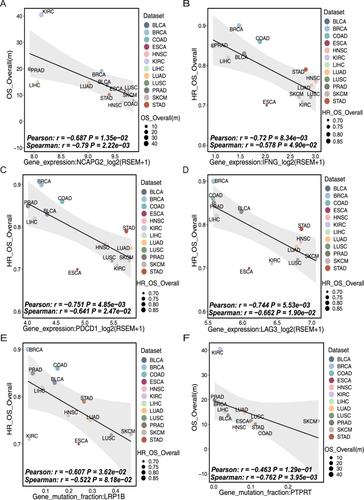
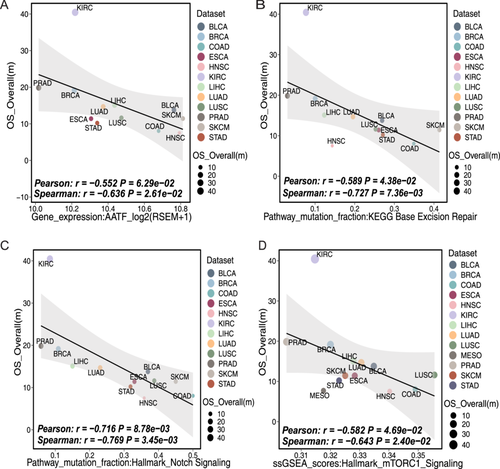
Here is an example of an association analysis run on the NCAPG2 gene at the single-gene level of the transcriptome using ImmunoCheckDB. The full name of NCAPG2 is non-SMC condensin II complex subunit G2, and its corresponding protein is part of the chromosomal condensin II complex, which plays a key role in mitosis, DNA repair and histone regulation [43, 44]. Recently pan-cancer studies have demonstrated its value in terms of immunity and therapeutic prognosis [38, 45]. ImmunoCheckDB showed that the expression of NCAPG2 had a significant negative association with the mOS of various tumors (Figure 3A), especially in LUAD, LUSC, and SKCM. This suggests that high NCAPG2 expression might be regarded as a risk factor for survival prognosis in multiple cancers. These results are consistent with the findings of Wang et al. [45]. To further illustrate the functionality of our tool, we went on to select a number of molecular features associated with survival and ICB response through pan-cancer analyses and validated them using our tool (Figures 3B–F and 4A–D). As expected, pan-cancer analyses revealed a strong association between good prognosis with immunotherapy and the expression of the genes IFNG, PDCD1, and LAG3, as well as the frequency of mutations in the gene LRP1B [37, 46]. In addition, there is evidence that mutations in the gene PTPRT as well as dysregulation of the Notch signaling pathway, the mTORC1 signaling pathway and base excision repair pathway are associated with a poor prognosis in cancers [47-50]. Furthermore, we have discovered some new biological findings through our tools. The transcriptional regulator AATF has been identified as a key molecule in the maintenance of proliferative tissues and tumour progression by inhibiting p53-driven apoptosis in vivo. Previous studies have shown that AATF has the potential to be a prognostic factor in Kras-driven lung adenocarcinoma [51]. Our findings further suggest that AATF may be a valuable predictor of overall cancer prognosis.
3 Discussion
ImmunoCheckDB is the first web-based tool focusing on both comprehensive meta-analysis and multiomic analysis at a pan-cancer level related to ICI therapy. ImmunoCheckDB systematically incorporates 173 ICI treatment-related studies published over the past decades, covering a wide range of efficacy data (OS/PFS/ORR and their related statistics), involving a sample size of nearly 93,000 people, 18 cancer types, and 30 ICI treatment modalities. ImmunoCheckDB not only supports online meta-analysis and network meta-analysis but also innovatively provides multiomic analysis to support ICI treatment. This encompasses various omics data types, including transcriptomics, epigenomics, genomics, tumor-immune infiltration, and tumor-related pathway gene sets, all readily available for exploring the association between the efficacy of ICI treatment and potential tumor biomarkers. Users can run all the aforementioned analyses in a point-and-click way, without the need for any registration, login, or code usage. Download options for high-quality visualizations and comprehensive data tables are provided, facilitating further research and analysis.
In recent years, there has been a proliferation of web-based tools supporting online meta-analysis aimed at facilitating convenient analysis for researchers who may lack a background in bioinformatics or programming. MetaInsight [33] is a Shiny application that allows users to provide their data sets for network meta-analysis. It provides real-time visualization of forest plots and network diagrams to compare the effects of different interventions. MAVIS [52] provides users with basic meta-analysis functionality, visualized as forest plots and funnel plots. IMPACT [53] is a Shiny tool for survival analysis of multiomics data and can likewise be used to search for molecular markers. Compared with these, ImmunoCheckDB has obvious advantages regarding research directions, the amount of included data, the diversity of analytical methods, the specialization of analytical methods, and the ease of website operation (Table 1).
| ImmunoCheckDB | MetaInsight | IPDmada | MAVIS | IMPACT | |
|---|---|---|---|---|---|
| Data source | Public data | User-uploaded data | User-uploaded data | User-uploaded data | Public data and user-uploaded data |
| Data type | Interventions of ICIs | Not restricted | Not restricted | Not restricted | Interventions of ICIs |
| Data summary | 173 studies, 93,234 individuals, 18 cancer types, and 30 ICIs treatments | NA | NA | NA | 24 ICI-related data sets, 6,276 individuals, 10 cancer types |
| Meta-analysis | Yes | No | Yes | Yes | Yes |
| Network meta-analysis | Yes | Yes | No | No | No |
| Multi-omics analysis | Yes | No | No | No | Yes |
| Multi-omics data type | Transcriptomics, epigenomics, genomics, tumor-immune infiltration, and tumor-related pathway gene sets | NA | NA | NA | Transcriptomics and genomics |
| Subgroup analysis | Yes | NA | NA | NA | Yes |
| Visualization customization | Yes | No | No | No | Yes |
| Reference | — | [33] | [34] | [52] | [53] |
First, ImmunoCheckDB is the first online meta-analysis tool developed to study the treatment-related efficacy of ICIs. Existing clinical studies on ICI therapy are quite mature and numerous. However, using these data for in-depth meta-analysis is still difficult for some researchers. ImmunoCheckDB comprehensively searches and incorporates existing clinical studies on ICI therapy and better assists medical staff in exploring and utilizing data related to tumor immunotherapy through simple meta-analysis operations and real-time visualization. Furthermore, many of the currently published meta-analysis articles suffer from limitations such as few included trials or lack of comprehensiveness. They often focus on a single cancer type, resulting in a lack of flexibility in guiding clinical drug choices. Most of the existing online meta-analysis databases either have limited built-in data or only support user-uploaded data, failing to address the need to include diverse data. ImmunoCheckDB, as a comprehensive database for tumor ICI treatment trials, extensively gathers prognostic efficacy data from patients with various cancer types, encompassing a wide array of common immunotherapy treatment regimens.
Another key strength of ImmunoCheckDB lies in its diverse analytical capabilities. Beyond traditional and network meta-analysis, it enables pan-cancer multi-omics association analysis. By exploring the relationship between ICI treatment efficacy data and tumor multiomics online, users can visually compare the association between the efficacy of treatment with ICIs and alterations at the molecular level of the tumor [54, 55] (e.g., alterations in the level of gene transcription, activation status of pathways, methylation status, occurrence of mutations or CNV, and alterations in the immune infiltration level). Many studies have been conducted to support the feasibility and necessity of exploring the efficacy of immunotherapy from a multiomic dimension. For example, Gibney et al. [56] explored the impact of PD-L1 detection, tumor-infiltrating lymphocytes, mutational load, immunogenetic profiling, and multiplexed immunohistochemistry on the efficacy of immunotherapy by analyzing immune infiltration data, mutation data, and transcriptome expression data. Furthermore, considering CAMOIP [35] that offers features and data sets comparable to ImmuneCheckDB in the area of multi-omics correlation, it is imperative to clarify the distinctions between the two in more detail. A fundamental difference between CAMOIP and ImmuneCheckDB lies in their methodologies for investigating the correlation between biological data and tumor prognosis, as well as the relationships among different tumor groups. CAMOIP utilizes box plots, heatmaps, and dot plots to assess variations in gene expression, mutation frequency, immunogenicity, immune infiltration levels, and pathway enrichment within a specific group of cancer patients at the individual level. In contrast, ImmuneCheckDB aims to establish a connection between pan-cancer biometrics and the prognosis of immunotherapy. To achieve this, it correlates multi-omics data from various cancer types with treatment efficacy outcomes. This approach enables a comprehensive assessment of the potential biomarkers and molecular factors that influence the response to immunotherapy across different cancer types, offering valuable guidance for personalized treatment strategies. Regarding ICBatlas [57], which also aims to investigate the histologic information in relation to the prognostic effectiveness of ICIs, the distinctions between ICBatlas and ImmuneCheckDB are similar to those between CAMOIP and ImmuneCheckDB. ICBatlas primarily focuses on investigating the biological targets associated with the prognostic effectiveness of ICIs in specific types of cancer. On the other hand, ImmuneCheckDB primarily focuses on investigating biological targets associated with the prognostic efficacy of ICIs at a pan-cancer level through association analysis. Besides, ImmuneCheckDB encompasses a more extensive range of omics types and a greater variety of cancer types compared to ICBatlas. In terms of analytical proficiency, ImmunoCheckDB not only helps novice users conduct convenient default parameter analyses and visualizations for meta-analysis or multiomic analysis but also offers a range of analytical parameters and customizable visualization options to accommodate advanced analysis scenarios. This versatility allows ImmunoCheckDB to better adapt to the characteristics of various research data and meet the varied needs of researchers.
Admittedly, ImmunoCheckDB has limitations. Its primary focus on drug efficacy, coupled with the absence of comprehensive safety data, may restrict researchers' ability to fully evaluate treatment effectiveness. While treating cancer patients with ICIs, various immune-related adverse reactions commonly occur [58], such as pneumonia [59, 60], myocardial injury [61, 62], and gastrointestinal inflammation. Furthermore, concerning data inclusion, we selected three clinically common endpoint measures, namely, mOS, mPFS, and ORR, for analysis and did not analyze other commonly used outcome measures, such as disease-free survival and disease control rate, which may not meet the needs of all users. In terms of advanced meta-analysis parameter settings, ImmunoCheckDB's subgroup analysis section only offers grouping by drug type and cancer type thus far, without support for grouping based on other patient information included in the trials, such as ethnicity, geographical region, nor does it support grouping according to treatment types like primary treatment, adjuvant treatment, or neoadjuvant treatment. Lastly, we acknowledge that merging clinical data from various tumor types to establish a correlation between drug efficacy and therapy outcomes may introduce batch effects. It is widely recognized that batch effects pose a common challenge in meta-analysis or network meta-analysis. To mitigate this issue, inclusion and exclusion criteria are typically refined to minimize sample variation. We understand that this may potentially impact the analyses performed using the tool.
Another limitation lies in the use of effect values. Notably, in this study, we used the odds ratio (OR) as the effect value for ORR. This is mainly because when dealing with diverse study designs and data from different patient populations, OR offers better consistency and comparability across different studies, and it is more straightforward to calculate and compare [63-65]. Especially in cancer research, where the event rate is often low, OR is a good approximation of the risk ratio (RR) [64-66]. However, RR also has its own advantages. By only using OR, we may not fully capture the characteristics of the data from all aspects. In the choice of analysis methods, we currently adopt the frequentist approach for meta-analysis. This is mainly because clinical researchers and practitioners are more familiar with it, making the research results more understandable and acceptable [67, 68]. Moreover, the frequentist approach requires fewer computational resources, which is suitable for real-time analysis on our web platform [69]. However, the Bayesian approach has advantages in integrating prior information and providing intuitive probability expressions. By only relying on the frequentist approach, we may miss some valuable information that could be obtained from prior knowledge.
We acknowledge these limitations and plan to address them in future versions, continually updating this tool with the latest trial data to better assist clinical practitioners and researchers. We intend to incorporate subgroup analyses considering various clinical characteristics of patients, including age, PD-L1 score, gender, etc. Additionally, we plan to conduct meta-analyses on the safety of ICIs treatment and correlation analyses utilizing multicohort data in our upcoming updates. In future research, we will explore the possibility of providing both OR and RR for a more comprehensive analysis. Also, we plan to add the option of Bayesian meta-analysis in future updates of ImmunoCheckDB to provide users with more choices and meet their deeper research needs. Moreover, we will add the quality ratings of the meta-analyses in the subsequent versions we release. These updates are initially scheduled to be released on an annual basis. Furthermore, we will consistently update the database by including supplemental data from trials published after December 2024, while adhering to the criteria of the current tool.
In summary, we introduce a powerful and highly customizable web tool, ImmunoCheckDB, for meta-analysis and multiomic analysis related to tumor ICI treatment. ImmunoCheckDB offers comprehensive ICI efficacy data with abundant sample sizes and a variety of drug types. Its unique feature of supporting association analysis between tumor ICI efficacy and tumor multiomic data at pan-cancer level is a standout aspect. Through ImmunoCheckDB, oncologists and medical researchers can easily explore existing ICI efficacy data via meta-analysis and delve deeper into the intricate relationship between immunotherapy and multiomic biomarkers.
4 Materials and Methods
4.1 Search Strategy
We used the formula “(immune checkpoint[tiab] OR immunotherapy[tiab]) AND (cancer[ti] OR tumor[tiab] OR carcinoma[tiab] OR lymphoma[tiab]) AND meta-analysis [ti]” to search for ICI therapy meta-analysis articles in the PubMed database before December 2024. We got 745 such articles, and then collected 553 ICI treatment-related trial articles by summarizing the included studies and cited literature.
We manually removed duplicates from the above ICI treatment-related trial articles and manually screened them according to the following criteria. The data inclusion criteria were as follows: (i) the study subjects were cancer patients treated with ICIs or ICIs plus other chemotherapeutic agents; (ii) the study was a prospective cohort study, regression cohort study, randomized controlled study, case‒control study, etc.; and (iii) the results of the study included mOS, mPFS, ORR, and their 95% confidence intervals (CIs). The data exclusion criteria were as follows: (i) the treatment modality did not include ICI or ICI combination therapy; (ii) the study did not report mOS, mPFS, or ORR or lacked CIs; (iii) the type of article was an observational study, a review, a letter, an editorial, or a case report; and (iv) the article was published in a language other than English. We finally included 173 papers and excluded 380 papers based on the above criteria (Supplementary Table S1).
4.2 Data Extraction and Data Preprocessing
From the selected ICI treatment articles, we extracted survival data (mOS, mPFS, ORR) along with associated statistical metrics (HR, OR values, and 95% CIs). For ORR data lacking detailed ORs or 95% CIs, we calculated these values individually using IBM SPSS Statistics (Version 23). Eventually, we got 544 sets of relevant data. Also, we recorded author, journal, year, patient number, cancer type, and treatment details in Supplementary Table S1.
4.3 Non-Network Meta-Aanalysis and Network Meta-Analysis
In the non-network meta-analysis, we used the metagen function from the meta package [70] to perform meta-analysis under both fixed-effects and random-effects models. Before deciding which model to rely on, we assessed heterogeneity among the included studies using the I2 statistic. This statistic measures the proportion of total variation across studies due to heterogeneity rather than chance. A I2 value greater than 50% indicated substantial heterogeneity, in which case the random-effects model was preferred; otherwise, the fixed-effects model was used. We utilized the “forest” function from the meta package to create forest plots for the aforementioned results. To evaluate potential publication bias, we employed the “funnel” function to generate funnel plots. By plotting a scatter plot of the effect size against the standard error, we can observe whether the graph is symmetric. If the graph is asymmetric, it may indicate the presence of publication bias. This visual approach allowed us to intuitively assess whether there were any systematic differences in the reporting of studies that could affect the meta-analysis results. In the network meta-analysis, we used the gemtc package to read and summarize the data of the network meta-analysis and draw a network diagram for data distribution visualization. We used the netmeta package [71] to perform network meta-analysis for fixed-effects models and random-effects models. Additionally, we utilized the relevant functions in the netmeta package to calculate the I2 value, which was used to assess the heterogeneity of the results between direct and indirect comparisons. A lower I2 value (close to 0%) indicates less heterogeneity, suggesting that the direct and indirect comparison results are more consistent. Finally, we used the meta package to draw forest plots. At the same time, we calculated the significance of the difference between each measure after intervention and its baseline value by using the netrank function from the meta package and rank-ordered them according to the significance of the difference. The results were visualized by plotting bar graphs using ggplot2 package [72].
4.4 Multiomics Analysis
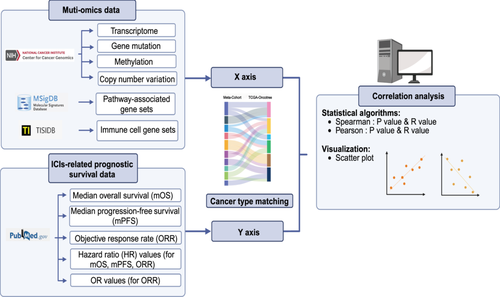
We collected tumor multiomic information, including transcriptomics, methylomics, and genomics data, from three publicly available databases: Molecular Signatures Database (MSigDB) [73], The Cancer Genome Atlas (TCGA) data from UCSC Xena [74] and cBioPortal [75]. Among them, 13,434 detailed tumor pathway-associated gene sets were downloaded from the MSigDB (Supplementary Table S2; https://www.gsea-msigdb.org/gsea/msigdb; access date: June 4, 2023). The expression profiles, methylation, and copy number variation (CNV) data corresponding to cancer types were downloaded from the UCSC Xena (https://xenabrowser.net/datapages/; access date: May 30, 2023) and the mutation data were downloaded from the cBioPortal databases (https://www.cbioportal.org; access date: May 30, 2023). All data were subjected to data cleaning, data normalization, and preprocessing. Nontumor samples, as well as NA values, were uniformly removed.
For transcriptome data, we calculated the median gene expression across all samples and used this median to represent the transcription of the gene in a given cancer species. For methylation data, we took the median value of all samples under the same probe as the methylation value for each probe. Additionally, we utilized the maximum or median value of a gene across different probes to represent the corresponding methylation value of that gene. For the CNV data, we calculated the G-score for each gene region using GISTIC 2.0 [76], reflecting the magnitude of CNV variation and its frequency of occurrence between samples. We calculated the weighted average of the G-score corresponding to different loci within the same gene, thereby obtaining the G-score for single-gene-level CNV data. Finally, we performed discrete standardization on these scores. Positive values represent the gene's range of CNVs in a given tumor. For mutation data, we screened all nonsynonymous mutations [77]. We calculated the ratio of the number of samples with nonsynonymous mutations to the total number of samples for each gene, thus obtaining the gene mutation data at the single-gene level.
To further assess multiomic alterations at the pathway level, we performed Single-sample Gene Set Enrichment Analysis (ssGSEA) [78, 79] of transcriptomic, methylomic, and genomic data using the Gene Set Variation Analysis (GSVA) package [80]. We counted the median ssGSEA scores of gene expression values/methylation values/CNV G-score scores/nonsynonymous mutation ratios for all samples of a particular cancer species under each pathway, representing the pathway activity status in a particular cancer species. In particular, for mutation data, a sample was considered to have a pathway mutation in a sample as long as there was more than one mutation in any genes of this pathway. In addition, for immune infiltration assessment, we downloaded the data of common immune cell-associated gene sets from the TISIDB [81] database (Supplementary Table S3; http://cis.hku.hk/TISIDB; access date: May 28, 2023) and performed ssGSEA on the gene expression matrix of the transcriptome to calculate tumor-immune infiltration. Similarly, the median ssGSEA score of immune cells in all samples of a given carcinoma was used to represent that tumor's immune infiltration level [82].
To explore the association of survival data with multiomic data, we used the Hmisc package [83] for Pearson/Spearman association analysis and the ggplot2 package for visualization. To further complement and clarify our correlation analysis using survival data and multi-omics data, we have developed a flowchart (Figure 5).
All the databases mentioned above are public databases, not subject to U.S. access restrictions, requiring no special permissions, and can be directly accessed and downloaded from their official websites.
4.5 Website Development
The flowchart for the construction of ImmunoCheckDB is shown in Figure 1. We applied the Shiny package [84] to build the web pages and all the interactive functional modules by R (4.1.1). We also used HTML5 [85], CSS, and JavaScript to beautify the database. We built the server and deployed it via shinyapps. io (https://www.shinyapps.io/). ImmunoCheckDB is available at https://smuonco.shinyapps.io/ImmunoCheckDB/.
Author Contributions
Chongxuan Lu and Mingxiao Li were responsible for methodology, formal analysis, investigation, data curation, visualization, and writing the original draft. Hong Yang and Anqi Lin were responsible for methodology, investigation, data curation, review, editing, and project administration. Zaoqu Liu and Jian Zhang were responsible for conceptualization, methodology, validation, review, and supervision. Quan Cheng, Anqi Lin, Shixiang Wang, and Peng Luo were responsible for conceptualization, supervision, project administration, review, and editing. All authors have read and approved the final manuscript.
Acknowledgments
This study was supported by grants from the Natural Science Foundation of Guangdong Province (2021A1515012593), the National Natural Science Foundation of China (82172811, 82172750, 82260546, 82303953, 82372883, and 82373129), the Guangdong Basic and Applied Basic Research Foundation (Guangdong–Guangzhou Joint Funds) (2022A1515111212) and Hunan Provincial Natural Science Foundation of China (Grant No. 2025JJ40079).
Ethics Statement
The authors have nothing to report.
Consent
The authors have nothing to report.
Conflicts of Interest
The authors declare no conflicts of interest.
Open Research
Data Availability Statement
A total of 13,434 detailed tumor pathway-associated gene sets were downloaded from the MsigDB (https://www.gsea-msigdb.org/gsea/msigdb; access date: June 4, 2023). The expression profiles, methylation, and copy number variation (CNV) data corresponding to cancer types were downloaded from the UCSC Xena databases (https://xenabrowser.net/datapages/; access date: May 30, 2023), and the mutation data corresponding to cancer types were downloaded from the cBioPortal databases (https://www.cbioportal.org; access date: May 7, 2023). The data of common immune cell-associated gene sets were obtained from the TISIDB database (http://cis.hku.hk/TISIDB; access date: May 28, 2023). All the databases mentioned above are public databases, not subject to U.S. access restrictions, requiring no special permissions, and can be directly accessed and downloaded from their official websites. All external database linkages (including but not limited to UCSC Xena, cBioPortal, MSigDB, and TISIDB) used in this study operate in full compliance with the respective host platforms' Application Programming Interface (API) usage agreements. Supplemental material can be found in the online version at https://doi.org/10.6084/m9.figshare.24302920. We have made the code supporting this study publicly available on GitHub. You can access the code at the following repository: [https://github.com/Klito012/ImmunoCheckDB].


