Hypoxia-Induced O-GlcNAcylation of GATA3 Leads to Excessive Testosterone Production in Preeclamptic Placentas
Juan Liu, Yun Yang, and Hongyu Wu, These authors contribute equally to this work.
Funding: This work was supported by grants from the National Key Research and Development Program of China (2022YFC2702400, 2022YFC2704700); National Natural Science Foundation in China (82192872, 32171115, 32200934); the Strategic Collaborative Research Program of the Ferring Institute of Reproductive Medicine (FIRMA180304); and Beijing Natural Science Foundation in China (7224356).
ABSTRACT
The maintenance of endocrine homeostasis in the placenta is crucial for ensuring successful pregnancy. An abnormally elevated production of placental testosterone (T0) has been documented in patients with early-onset preeclamptic (E-PE). However, the underlying mechanisms remain unclear. In this study, we found that E-PE placentas exhibited significantly increased expressions of 3β-HSD1 (3β-Hydroxysteroid Dehydrogenase 1) and 17β-HSD3 (17β-Hydroxysteroid Dehydrogenase 3), the rate-limiting enzymes for T0 synthesis. This was strongly correlated with an elevated level of O-linked N-acetylglucosaminylation (O-GlcNAcylation) of GATA3 (GATA binding protein 3). In human trophoblast cells, O-linked-N-acetylglucosamine (O-GlcNAc) modification of GATA3 on Thr322 stabilized the protein and enhanced the transcriptional regulation of 3β-HSD1 and 17β-HSD3, thereby increasing T0 production. Hypoxia, a well-established pathological factor in PE, significantly enhanced the O-GlcNAcylation of GATA3 in human trophoblast cells. Our findings suggest that hypoxia-induced overactive O-GlcNAcylation of GATA3 contributes to the exacerbated T0 production in E-PE placentas. These findings provide a new perspective on the pathogenesis of E-PE from the standpoint of posttranslational regulation and may illuminate novel therapeutic strategies for adverse pregnancy outcomes such as E-PE.
1 Introduction
The placenta is an important endocrine organ that synthesizes a variety of hormones throughout gestation to support fetal development and maternal adaptation to pregnancy [1]. In pregnant women, sex steroids such as progesterone, estrogen, and androgen are primarily produced by the placenta throughout gestation, with their levels increasing from the first trimester until the end of pregnancy [2]. The biosynthesis of these placental sex steroids begins with the conversion of cholesterol into pregnenolone by cytochrome P450 in the placenta, catalyzed by CYP17A1 to yield dehydroepiandrosterone (DHEA) in both maternal and fetal adrenal glands [3]. DHEA is then transported to the placenta for the synthesis of androstenedione (A4) and T0, with 3β-HSD1 and 17β-HSD3 acting as the primary synthases respectively. A4 and T0 are subsequently converted into estrogen by aromatase within the placenta [4].
Preeclampsia (PE), a pregnancy complication characterized by new-onset hypertension, proteinuria, and multisystem disorders, is the leading cause of maternal and perinatal morbidity and mortality worldwide [5-7]. The etiology of preeclampsia remains elusive. However, disturbances in endocrine homeostasis are a significant pathological factor [4, 8, 9]. Our group and others have shown that patients with E-PE (clinical symptoms appear before 34th gestational week) exhibit abnormally elevated levels of T0 while 17β-estradiol (E2) levels are suppressed in the maternal circulation. This imbalance in hormone synthesis within the placenta accounts for these observations [10, 11]. When pregnant mice were administered the T0 analog testosterone propionate from E7.5 onwards, they developed PE-like symptoms, accompanied by an increase in T0 levels and a decrease in E2 production [9]. This suggests that the abnormal surge in T0 synthesis is likely the primary cause of placental endocrine disturbances associated with PE [9]. However, the specific regulatory mechanism responsible for this remains to be elucidated.
Hypoxia at the maternal–fetal interface is a primary cause of PE [12]. This stress can markedly alter the O-GlcNAc modification of proteins, instigating changes via the stimulation of the hexosamine biosynthetic pathway (HBP) flux [13, 14]. O-GlcNAcylation, a reversible and ubiquitous posttranslational modification in eukaryotic cells, impacts a wide range of cellular processes [15-17]. Evidence has suggested the involvement of O-GlcNAcylation in multiple events of pregnancy, including preimplantation embryo development [18], embryonic implantation [19], and placental response to stress [20]. The dysregulation of O-GlcNAcylation resulting from maternal hyperglycemia impairs cell proliferation and blastocyst formation in preimplantation development [18]. Deletion of OGT (O-GlcNAc transferase) in mouse placenta leads to early prenatal stress involving endocrine and immune signals, and dysregulation of the hypothalamic–pituitary–adrenal axis responsivity and function of hypothalamic mitochondrial in adult offsprings [21]. Such prenatal and long-term offspring features strongly indicate the participation of O-GlcNAcylation in maintaining intrauterine homeostasis. However, the relationship between protein O-GlcNAcylation and the regulation of placental endocrine homeostasis remains unknown. We have recently developed a database of O-GlcNAcylated proteins in human placental trophoblasts and demonstrated its role in modulating trophoblast differentiation via protein O-GlcNAc modification [22]. Notably, GATA3 exhibits abundant O-GlcNAc modifications within our database, aligning with existing literature that suggests GATA3 is uniquely enriched in the placenta compared to other tissues [23, 24]. Deletion of Gata3 and Gata2 genes in mouse trophoblasts resulted in compromised placental development and early embryonic mortality [25]. Furthermore, essential GATA-binding sites for the transcriptional regulation of the human HSD3B1 gene (encoding 3β-HSD1) in the placenta have been identified [26]. Based on these findings, we hypothesized that hypoxic stress could intensify the O-GlcNAc modification of GATA3 in placental trophoblasts, potentially promoting the overexpression of specific androgen synthases and consequently leading to excessive T0 production in E-PE placentas.
This study examined the effect of O-GlcNAcylation on GATA3 protein stability and transcriptional regulation of key steroid synthases 3β-HSD1 and 17β-HSD3 by GATA3, as well as T0 production in human trophoblast cells. We assessed the effect of hypoxic stress on GATA3 O-GlcNAcylation and T0 production in trophoblasts, and the association between O-GlcNAcylated GATA3 and 3β-HSD1 and 17β-HSD3 in E-PE placentas. The aim was to elucidate the mechanism by which hypoxia-induced increase in GATA3 O-GlcNAcylation results in excessive androgen production in E-PE placentas, thereby aiding in the identification of early etiological factors of endocrine disruption in E-PE.
2 Results
2.1 A Strong Correlation Exists Between GATA3 and Androgen Synthetases, as Well as T0 Production in E-PE Placentas
To identify the transcription factors that regulate 3β-HSD1 and 17β-HSD3 expression, we first examined the motif composition of the sequence upstream of the transcription start site (TSS) of HSD3B1 and HSD17B3. We found a high frequency of potential transcription factor binding motifs in the proximal promoter region of HSD3B1 (Figure 1A). Among these factors, GATA3 was specifically enriched in placenta compared to other tissues [23, 24]. GATA3 can promote extraembryonic trophoblasts to adopt their definitive fate at the blastocyst stage and stimulate trophoblast stem cells differentiation [27]. A GATA3 binding motif was also identified within the gene region for HSD17B3 (encoding 17β-HSD3) by ChIP-seq analysis conducted on MCF7 cells and human embryonic stem cell derived trophoblast progenitors (GSE51274, GSE122847, GSE40129, and GSE105081; Figure S1). According to the single-cell transcriptome sequencing [28] and RT-qPCR results, we found that GATA3 was expressed at relatively high level in the human placenta and trophoblasts (Figures S2 and S3). Surprisingly, GATA3 transcriptional expression was similar between E-PE and the CTRL (Figure 1B, C). In contrast, mRNA levels of HSD3B1 and HSD17B3 were significantly higher in E-PE placentas (Figure 1D, E). Considering the heterogeneous composition of the placenta, we next investigated GATA3 expression by trophoblast cell type in human placenta. We confirmed that GATA3 expression is similar between E-PE and CTRL regardless of cell type (Figure 1F).
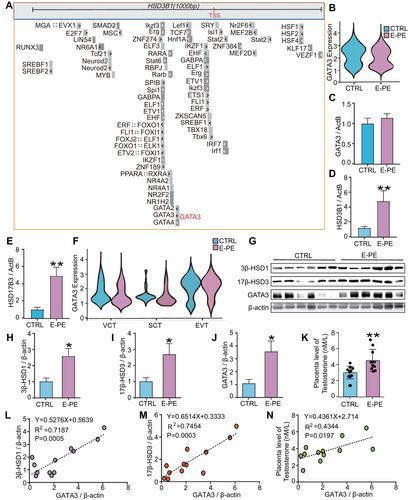
Interestingly, although the mRNA level of GATA3 was not altered, its protein level was markedly upregulated in E-PE placentas, accompanied by increased 3β-HSD1, 17β-HSD3 and T0 levels (Figures 1G–K and S4). The nonparametric Spearman's correlation test showed a strong positive correlation between the level of GATA3 and 3β-HSD1, 17β-HSD3 or T0 (Figure 1L–N). These results indicate that the GATA3 protein may be regulated by posttranslational modifications, which may further contribute to the excessive production of T0 in E-PE placentas.
2.2 O-GlcNAcylation Dynamically Modified and Stabilized GATA3 Protein in Human Trophoblast Cells
Among the proteins in our human placental trophoblasts O-GlcNAcylated protein database [22], GATA3 was identified as one of the most heavily O-GlcNAc modified proteins (Figure 2A). To investigate whether GATA3 can be O-GlcNAcylated, we quantified the changes in O-GlcNAcylated GATA3 levels in JEG3 cells treated with Thiamet G (TMG, an inhibitor of O-GlcNAcase) or Ac45SGlcNAc (Ac45S, an inhibitor of O-GlcNAc transferase). As expected, TMG treatment significantly increased global O-GlcNAcylation levels (Figure 2B, C) and the relative O-GlcNAc stoichiometry of GATA3 (Figure 2D, E). Conversely, Ac45S led to a significant decrease in global O-GlcNAcylation (Figure 2F, G) and O-GlcNAcylated GATA3 levels (Figure 2H, I). These results clearly demonstrate that GATA3 can be dynamically O-GlcNAcylated in human trophoblast cells.
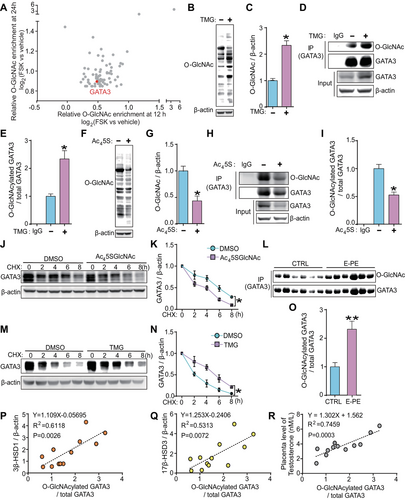
Since TMG or Ac45S exposure in JEG3 cells resulted in alterations in GATA3 protein but not mRNA expression (Figures 2D, E, H, I and S5), we hypothesized that O-GlcNAc modification could stabilize GATA3 protein. Accordingly, JEG3 cells were treated with Ac45S or TMG for 24 h, followed by treatment with the protein synthesis inhibitor cycloheximide (CHX) for 0–8 h. The time-dependent decrease of GATA3 protein levels after CHX treatment was significantly accelerated upon O-GlcNAc deprivation with Ac45S (Figure 2J, K), whereas it was considerably retarded upon O-GlcNAc augmentation by TMG, compared to the respective controls at different time points (Figure 2L, M). Furthermore, IP experiments revealed a higher O-GlcNAc stoichiometry of GATA3 (O-GlcNAcylated GATA3 / total GATA3) in E-PE placentas, which was 2.2-fold higher than that in CTRL placentas (Figure 2N, O). A nonparametric Spearman's correlation test showed a strong positive correlation between the levels of O-GlcNAcylated GATA3 and 3β-HSD1, 17β-HSD3, or T0 (Figure 2P–R). These results clearly demonstrate that O-GlcNAcylation regulates GATA3 protein stability and suggest that the increased T0 levels in E-PE placentas might be regulated by O-GlcNAcylated GATA3.
2.3 Thr322 Is the Primary O-GlcNAcylation Site for GATA3 in Human Trophoblast Cells
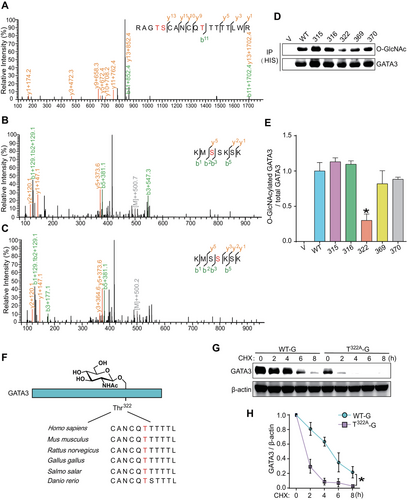
To identify the O-GlcNAcylation site(s) of GATA3 in trophoblasts, we conducted an IP using an anti-GATA3 antibody and subjected the in-gel trypsin digested peptides to LC–MS/MS analysis as previously described [29]. This process revealed five putative O-GlcNAcylation sites (Thr315, Ser316, Thr322, Ser369, and Ser370) within GATA3 (Figure 3A–C). We generated five distinct plasmids that separately carried GATA3 with one of these putative O-GlcNAcylation residues mutated to valine (T315A-G, S316A-G, T322A-G, S369A-G, and S370A-G), and transfected them into JEG3 cells. The O-GlcNAcylation levels of GATA3 in these cells were then measured following TMG exposure. Notably, T322A-G significantly reduced the relative O-GlcNAc stoichiometry of GATA3 compared to other plasmids (Figure 3D, E). A sequence comparison between Homo sapiens and other vertebrate orthologs revealed a high degree of conservation of the GATA3-Thr322 residue among mammals (Figure 3F). These findings collectively demonstrate that Thr322 is the primary O-GlcNAcylation site for GATA3 in human trophoblast cells. Consequently, JEG3 cells transfected with the T322A-G plasmid exhibited a significantly faster degradation of GATA3 than cells transfected with the WT-G plasmid (Figure 3G, H). Therefore, the stability of GATA3 can be directly modulated by O-GlcNAcylation at Thr322.
2.4 GATA3 Transcriptionally Regulated the Expression of 3β-HSD1 and 17β-HSD3 in Human Trophoblast Cells
To determine the interaction between GATA3 and HSD3B1 in human placental trophoblasts, ChIP experiments were performed using JEG3 cells. We found that GATA3 bound significantly to the promoter region of HSD3B1 (Figure 4A, B). A luciferase reporter plasmid containing the HSD3B1 promoter region (3B1-P) was constructed and co-transfected with a GATA3-expressing plasmid (WT-G) into JEG3 cells. The dual-luciferase assay showed that GATA3 markedly enhanced the activity of the HSD3B1 promoter (Figure 4C), indicating strong transcriptional regulation of HSD3B1 by GATA3 in human trophoblast cells.
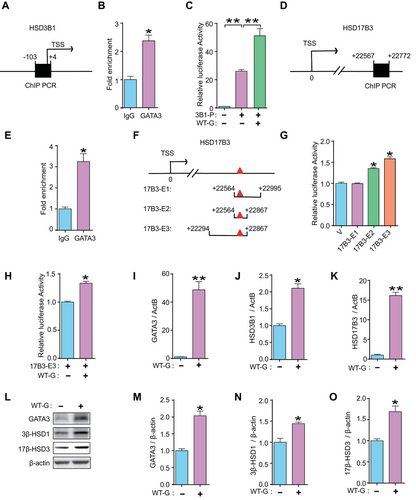
Data mining of the ChIP-seq database (GSE105081) revealed a putative GATA-binding motif approximately 22 kb downstream of the TSS in HSD17B3 (Figure S1). Further ChIP analyses confirmed significant binding of GATA3 to this motif in HSD17B3 (Figure 4D, E). Three plasmids (17B3-E1, -E2, and -E3) containing different regions of the predicted GATA-binding motif in HSD17B3 were constructed (Figure 4F) and transfected separately into JEG3 cells with or without the WT-G plasmid. The highest luciferase activity was observed upon transfection with the 17B3-E3 plasmid (Figure 4G, H), suggesting enhancer activity of GATA3 on HSD17B3 expression.
Moreover, GATA3-overexpressed JEG3 cells showed a marked upregulation of HSD3B1 and HSD17B3 mRNA levels and increased protein levels of 3β-HSD1 and 17β-HSD3 (Figure 4I–O). Single-cell ATAC-seq (assay for transposase-accessible chromatin using sequencing) analysis demonstrated that the HSD3B1 and HSD17B3 gene loci are accessible in trophoblast linages, such as VCT (villous cytotrophoblast), SCT (syncytiotrophoblast), and EVT (extravillous trophoblast), which is accompanied by an elevated expression of GATA3 in these cell types, compared to dNK (decidual natural killer cell), a major population of non-trophoblast cells at the maternal–fetal interface [30] (Figure S6). Moreover, there was no effect on the proliferation of JEG3 cells after GATA3 overexpression (Figure S7).
Collectively, these results show that GATA3 can transcriptionally upregulate 3β-HSD1 and 17β-HSD3 expression in human trophoblasts.
2.5 O-GlcNAcylation of GATA3 Markedly Enhanced T0 Synthesis in Human Trophoblast Cells
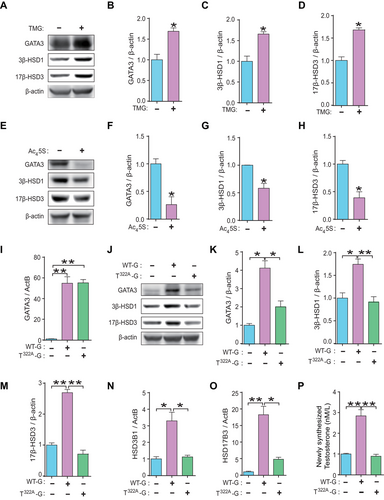
To examine the role of GATA3 O-GlcNAcylation in T0 synthesis within human trophoblasts, JEG3 cells were subjected to treatment with TMG or Ac45S, or transfected with either T322A-G or WT-G plasmids. As anticipated, levels of GATA3, 3β-HSD1 and 17β-HSD3 were significantly elevated in cells treated with TMG (Figure 5A–D). Conversely, these protein levels were notably reduced in cells treated with Ac45S (Figure 5E–H). The mRNA level of GATA3 was significantly upregulated upon transfection with either the T322A-G or the WT-G plasmid, with no significant differences observed between these groups (Figure 5I). However, while transfection with the WT-G plasmid resulted in a threefold increase in GATA3 protein expression, transfection with the T322A-G plasmid led to a slight but non-significant increase in GATA3 protein expression compared to control cells (Figure 5J, K). Furthermore, overexpression of GATA3 by the WT-G plasmid significantly enhanced the expressions of 3β-HSD1 and 17β-HSD3 as well as T0 production, whereas these effects were completely abolished in cells transfected with T322A-G (Figure 5J, L–P). Taken together, these findings demonstrate that O-GlcNAc modification of GATA3 effectively enhances T0 synthesis by stimulating the expression of key androgen synthases in human trophoblast cells.
2.6 Hypoxic Stress Induced the O-GlcNAcylation of GATA3 and Led to an Overproduction of T0 Production in Human Trophoblast Cells
To elucidate the pathological mechanism underlying T0 overproduction in E-PE placentas, we investigated whether hypoxic stress induces GATA3 O-GlcNAcylation in trophoblasts. JEG3 cells were exposed to 2% O2 for different time periods (0–24 h) to mimic the hypoxic environment in PE placentas [31]. The global O-GlcNAcylation level was increased after exposure to hypoxia for 6–24 h (Figure 6A). From the RNA-seq data (GSE159480) [32] of hypoxia-exposed placental iPSCs differentiated into syncytiotrophoblast, we analyzed the enzymes directly related to HBP and O-GlcNAc cycling. We found that expression levels of almost all enzymes were higher than those in the control group, indicating that HBP was activated following hypoxia stimulation (Figure 6B). This result is consistent with previous reports showing that cellular stress, such as hypoxia, significantly alters the O-GlcNAc modification of proteins by stimulating HBP flux [13, 14]. Hypoxia exposure dramatically increased the levels of HIF-1α, GATA3, 3β-HSD1, and 17β-HSD3 compared to their corresponding normoxia group (21% O2) (Figure 6C–G). IP experiments showed that the relative O-GlcNAcylation level of GATA3 in WT-G-transfected JEG3 cells was significantly increased by hypoxia, whereas mutations in Thr322 reduced this effect (Figure 6H, I). Moreover, the time-dependent degradation of GATA3 was slower in hypoxia-exposed JEG3 cells than in normoxic cultures (Figure 6J, K). However, the hypoxia-induced degradation of GATA3 was significantly weakened by the mutation in Thr322A, as shown by a comparison between WT-G- and Thr322A-G-transfected cells under hypoxic stimulation (Figure 6L, M). These results confirm that hypoxic stress in human trophoblast cells promotes GATA3 O-GlcNAcylation, resulting in enhanced protein stability.
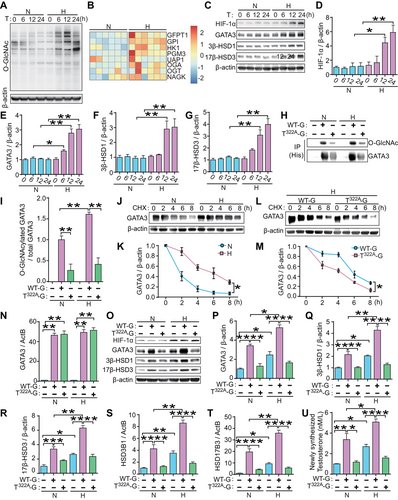
To further confirm whether hypoxia-induced GATA3 O-GlcNAcylation contributes to T0 overproduction, we analyzed WT-G- or T322-G-transfected JEG3 cells under 2% or 21% O2. The mRNA level of GATA3 was similar between the WT-G and T322-G groups and was not altered by hypoxic stimulation (Figure 6N). However, hypoxia exposure significantly increased the protein levels of GATA3, 3β-HSD1, and 17β-HSD3 (Figure 6O–R), the mRNA expression of HSD3B1 and HSD17B3 (Figure 6S, T), and T0 production (Figure 6U) in either basal or WT-G-overexpressing JEG3 cells when compared with their respective normoxic controls. In contrast, the stimulatory effects of hypoxia on these molecules and T0 production were abrogated in T322A-G-transfected cells (Figure 6O–U). These results clearly demonstrate that hypoxia induces an overproduction of T0 in trophoblasts via the induction of persistent GATA3 O-GlcNAcylation, which strongly enhances the transcription of T0 synthase genes.
2.7 O-GlcNAcylation of GATA3 Markedly Enhanced T0 Synthesis in Primary Human Trophoblast (PHT) Cells
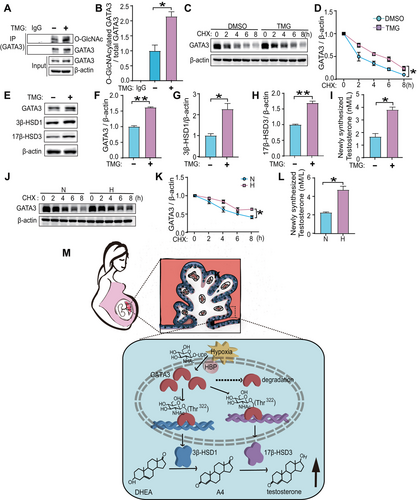
To further validate our findings, we next performed a series of validation experiments using PHT cells. As expected, TMG treatment markedly increased the relative O-GlcNAc stoichiometry of GATA3 (Figure 7A, B). Furthermore, the time-dependent decrease of GATA3 protein levels after CHX treatment was significantly retarded upon O-GlcNAc augmentation by TMG compared to their respective controls at different time points in PHT cells (Figure 7C, D). In addition, PHT cells were treated with TMG or DMSO and as expected, GATA3, 3β-HSD1 and 17β-HSD3 levels and newly synthesized T0 were significantly elevated in TMG-treated cells (Figure 7E–I). Furthermore, the time-dependent degradation of GATA3 was markedly slower in hypoxia-exposed PHT cells than in normoxic cultures (Figure 7J, K). Notably, exposure to hypoxia significantly enhanced T0 production compared to normoxia group (Figure 7L). Taken together, these results in PHT cells provide additional evidence for our hypothesis that hypoxia and O-GlcNAcylation induced stabilization of GATA3 contributes to excessive T0 production.
3 Discussion
Our study, along with others, has identified a significant endocrine disruption in estrogen and androgen synthesis, particularly evident in E-PE [10, 33]. Steroid hormones, mainly produced by the placenta during gestation, are pivotal for normal pregnancy [33]. Preeclampsia, a multisystem complication defined as newly onset hypertension and proteinuria in pregnancy that cause maternal and perinatal morbidity and mortality, commonly manifests with significantly high plasma testosterone (T0) level [4, 8, 9]. However, the underlying mechanism remains unclear. Here, we discovered that the expression of 3β-HSD1 and 17β-HSD3, key enzymes responsible for T0 synthesis, were significantly increased in E-PE placentas, together with elevated level of O-GlcNAcylated GATA3. A positive correlation existed between the expression of O-GlcNAcylated GATA3 and placental T0 concentration. In human trophoblast cells, dynamic O-GlcNAcylation modification of Thr322 stabilized GATA3, which empowered GATA3 to transcriptionally upregulate the expression of 3β-HSD1 and 17β-HSD3, and thus elevated the production of T0. As a well-recognized pathological factor in PE, hypoxia can significantly enhance the O-GlcNAcylation of GATA3 in human trophoblast cells (Figure 7M). The findings reveal the underlying mechanism that exacerbated high T0 production modulated by O-GlcNAcylated GATA3 in E-PE placentas and provide new insights into the pathogenesis of E-PE from the perspective of endocrine homeostasis regulation.
Our previous study showed that androgen overproduction could inhibit estrogen production through the miR-22/ERα/aromatase pathway in PE placentas [10]. In addition, testosterone propionate administration to pregnant mice induced hypertension and proteinuria, fetal and placental growth retardation, and E2 production impairment—phenotypes similar to those of E-PE [9]. These findings suggest that abnormally high levels of T0 synthesis are a major cause of placental endocrine disorders in E-PE, but the underlying mechanisms remain unclear. The present study provides a new insight into the pathogenesis of E-PE by suggesting that persistent O-GlcNAcylation induced by hypoxia regulates GATA3 stability, thereby increasing 3β-HSD1 and 17β-HSD3 levels transcriptionally and promoting excessive T0 synthesis in human trophoblast cells. It is well known that persistent hypoxic stress at the maternal–fetal interface contributes to suboptimal remodeling of the uterine spiral arteries in PE [12, 31]. During the normal course of pregnancy, uterine spiral artery remodeling begins around 7th to 8th week [34] and is completed by 20–22 weeks [35]. Our previous study showed that imbalanced estrogen and androgen synthesis was first observed in patients at 11–14 weeks of gestation [11]. Taken together with our findings that hypoxia promotes T0 synthesis, it can be speculated that the dysfunction of spiral artery remodeling at the maternal–fetal interface in E-PE occurs early in pregnancy. Thus, this study not only reveals the pathogenesis of endocrine disorder in E-PE but also provides a rationale for determining the developmental period of disturbance in E-PE placentas. However, further studies are required to confirm this hypothesis.
GATA is a pioneer transcription factor that plays an important role in embryonic development [36]. Among the GATA family members, GATA3 has the highest expression in the placenta [23]. Deletion of GATA3 in the placenta leads to impaired placental development and fetal death [25]. Several studies have shown that GATA3 plays an essential role in trophoblast cell differentiation. It can transcriptionally regulate the expression of placental lactogen I and proliferin in mouse placental trophoblast giant cells [37, 38]. Moreover, GATA3 can interact with the placental transcription factor GCM1 to inhibit its activity and suppress trophoblast invasion [39]. In addition, GATA3 can promote extraembryonic trophoblast fate at the blastocyst stage and drive trophoblast differentiation in trophoblast stem cells [32]. Our study indicates that hypoxia-induced O-GlcNAcylation stabilizes GATA3. Therefore, it is possible that hypoxia induces abnormal differentiation and function of human trophoblast cells by inducing O-GlcNAcylation and stabilizing GATA3 at the maternal–fetal interface during early pregnancy. The dysregulation of various GATA3 functions and their effects on multiple gestational processes may explain the molecular basis of multiple dysfunctions in E-PE placentas.
O-GlcNAcylation is a multifunctional posttranslational modification that regulates protein function [40]. However, its role in placental development has not been well studied. We previously identified O-GlcNAcylated proteins from human placenta and found that GATA3 was significantly upregulated for O-GlcNAcylation during trophoblast syncytialization [22]. Hypoxia induces the O-GlcNAcylation of GATA3 and increases its stability. However, the mechanism underlying this process remains unknown. It has been reported that GATA3 binds to the E3 ligase Fbw7, which mediates the ubiquitination degradation of GATA3 [41]. The binding of Fbw7 to GATA3 is enhanced by phosphorylation at Thr156 of GATA3, which promotes ubiquitination degradation [41]. We speculated that Thr322 O-GlcNAcylation of GATA3 may induce structural changes that prevent the binding of GATA3 to Fbw7, thereby inhibiting the degradation of GATA3. Further studies are needed to elucidate the mechanism by which O-GlcNAc modification affects the stability of GATA3.
The syncytiotrophoblast, the primary site of steroid hormone synthesis in the placenta, is formed through cell fusion of the mononucleated cytotrophoblasts. This process is primarily triggered by the activation of protein kinase A (PKA) signal pathway [42]. Protein O-GlcNAcylation is facilitated by the HBP [40]. It is well established that glutamine fructose-6-phosphate amidotransferase (GFAT), the rate-limiting enzyme of HBP that catalyzes the conversion of fructose-6-phosphate to glucosamine-6-phosphate, relies on the cAMP/PKA pathway [43]. Hypoxia has been recognized as a significant contributor to PE [12]. Hypoxia can markedly modify the O-GlcNAc modification of proteins by inducing changes via the stimulation of the HBP flux [13, 14]. In our previous study, using quantitative O-GlcNAc proteomics, we established a database of O-GlcNAcylated proteins in human placental trophoblasts [22]. We identified hundreds of proteins that were dynamically O-GlcNAcylated during trophoblast differentiation, with GATA3 being one of the most significantly changed. Based on these findings, we propose that hypoxia plays a crucial role in regulating T0 synthesis by GATA3. Additionally, alterations in glucose and lipid levels can affect the level of O-GlcNAc modification [44, 45], and may also affect GATA3 stability and thus T0 synthesis. Indeed, glucose and lipid metabolism have been reported to be dysregulated in adverse pregnancy outcomes such as PE [46-51]. However, due to limited investigation into the mechanism responsible for aberrant T0 production in PE placentas, no additional evidence has been found so far. A comprehensive study is necessary to fully elucidate the regulatory mechanism that governs GATA3 stability and T0 synthesis.
The present study had some limitations. Firstly, it solely involved in vitro experiments, no in vivo studies were conducted to validate the findings of these in vitro tests. This is due to the fact that sex hormone synthesis in pregnant mice predominantly occurs in the ovarian corpus luteum rather than the placenta [52]. Therefore, despite the extensive use of the murine model for investigating reproductive pathophysiology owing to its irreplaceable advantages, it may not be appropriate for studying placental endocrine function [53]. Secondly, the sample size was relatively small. Future studies should aim to increase participant numbers and establish non-human primate models of preeclampsia placental endocrine disorders to fully elucidate the regulatory mechanisms that maintain placental hormone homeostasis.
4 Conclusions
In conclusion, this study provides a novel insight into the regulation of endocrine homeostasis by revealing that hypoxia-induced O-GlcNAcylation of GATA3 in placental trophoblasts not only stabilized GATA3 protein but also enhanced T0 production. These results suggest a potential mechanism for excessive androgen production that contributes to placental endocrine dysregulation observed in E-PE. Further investigation is required to fully elucidate the cause of excessive androgen production in E-PE placentas, which may lead to the development of novel therapeutic strategies for adverse pregnancy outcomes such as E-PE.
5 Materials and Methods
5.1 Study Participants and Samples
The experiments were conducted in accordance with the 1964 Declaration of Helsinki and its later amendments [54]. The enrolled participants were pregnant Chinese Han women who underwent regular prenatal care at the Peking University Third Hospital. Pregnancy outcomes were determined according to the definitions in Williams Obstetrics (25th edition) and the American College of Obstetricians and Gynecologists (ACOG) guidelines [55]. In brief, PE was identified in pregnant women who had no history of preexisting or chronic hypertension but demonstrated a systolic blood pressure ≥140 mmHg or diastolic blood pressure ≥90 mmHg on at least two occasions, accompanied by proteinuria (≥ 0.3 g/24 h or ≥(+) in random urine sample); or no proteinuria, but with multiple organ damage after the 20th week of gestation. Based on whether the onset of clinical signs was earlier than the 34th week, PE was further classified as E-PE or late-onset PE (L-PE). Given that the gestational duration in E-PE is often earlier than term, placentas from unexplained preterm labor were collected as gestational age-matched controls (CTRL) for E-PE [56]. Unexplained preterm labor was defined as the onset of labor earlier than 37 weeks with an unknown etiology and no other complications. Pregnancies complicated by gestational diabetes, renal or cardiovascular disease, intrauterine fetal death, fetal chromosomal or congenital abnormalities, or those conceived using assisted reproductive technologies were excluded from the study. 6 E-PE placentas and 6 CTRL placentas were collected within 1 h of caesarean section and biopsies of the basal plate were collected from the placental disc at sites 5 cm from the umbilical cord insertion site. The samples were either snap-frozen in liquid nitrogen or fixed in paraformaldehyde before being embedded in paraffin. The clinical characteristics of the pregnant women are summarized in Table S1.
5.2 Single-Cell RNA-Seq Data Analysis
Violin-based single-cell transcriptome sequencing data, from Tsang et al. [28], were aligned and quantified using the Cell Ranger Single-Cell Software Suite (version 3.0, 10× Genomics, Pleasanton, CA, USA) [57] against the GRCh38 human reference genome. Cells with fewer than 500 detected genes, mitochondrial genes, genes that were expressed in fewer than three cells, and for which the total mitochondrial gene expression exceeded 20% were removed. The R package Seurat (version 2.3.3) [58] was used for normalization, shared nearest-neighbor graph-based clustering, differential expression analysis, and visualization.
5.3 Immunoprecipitation (IP)
Placental tissues or cultured cells were homogenized with lysis buffer to extract total proteins, and protein concentrations were measured using a BCA Protein Assay Kit (Beyotime Biotechnology). Specific antibodies (anti-GATA3, anti-immunoglobulin G [IgG], or anti-His) and 20 µL agarose beads (Sigma-Aldrich) were added to 500 µg total proteins and agitated overnight at 4°C. The beads were washed with PBS (phosphate buffer saline, pH = 7.2) by centrifugation at 3000 × g and 4°C, and the bound proteins were separated using SDS-PAGE (sodium dodecyl sulfate polyacrylamide gel electrophoresis) with subsequent immunoblotting analysis. Primary antibodies are listed in Table S2.
5.4 Chromatin Immunoprecipitation (ChIP)
A ChIP assay was performed using an EZ-ChIPTM Kit (Millipore) according to the manufacturer's instructions, as previously described [59, 60]. Briefly, cultured cells were fixed with 1% formaldehyde and glycine was added to terminate the reaction. The cells were harvested in PBS buffer containing a protease inhibitor cocktail (Millipore), and the extracted DNA was degraded to ∼300 bp fragments in an ultrasonic cell disruptor. The DNA fragments were immunoprecipitated with anti-GATA3 antibody or mouse IgG (negative control) to obtain GATA3 protein–DNA complexes, which were subsequently reverse cross-linked. Following DNA purification and elution, qPCR was performed to measure the level of HSD3B1 and HSD17B3. Specific primers for HSD3B1 and HSD17B3 are listed in Table S3.
5.5 Plasmid Construction and Transfection
Full-length GATA3 cDNA (sequence obtained from the Human ORFeome Database, http://horfdb.dfci.harvard.edu/) was amplified using PCR and subcloned into the pcDNA4/myc-His vector (WT-G). PCR-based site-directed mutagenesis plasmids were constructed using TransStart FastPFU DNA polymerase (TransGen Biotech, Beijing, China), with the WT-G plasmid as the template. Serine (S316, S369, S370) or threonine (T315, T322) of GATA3 was mutated to alanine and named S316A-G, S369A-G, S370A-G, T315A-G, and T322A-G, respectively. The construct sequences were validated by DNA sequencing. The primers used for PCR amplification are listed in Table S4.
Plasmid transfection experiments were performed as previously described [61]. Briefly, the trophoblast cell line JEG3 was cultured in 6-well plates in DMEM (Dulbecco's modified Eagle's medium) supplemented with 10% fetal bovine serum and antibiotics. At 60–70% confluency, 1 µg specific plasmid mixed with lipofectamine 2000 (Invitrogen, Shanghai, China) were added. The cells were maintained in an incubator at 37°C before harvesting.
5.6 Dual-Luciferase Reporter Assay
The PCR amplicon containing the GATA3-binding sequence at the human HSD3B1 promoter was cloned into the pGL3-promoter luciferase vector to generate the pGL3-HSD3B1-promoter plasmid (3B1-P), as previously described [26]. Different lengths of sequences containing the predicted GATA-binding sequence (22 kb downstream of the transcription start site of the HSD17B3 gene) were PCR amplified (primers shown in Table S4) and subcloned into the pGL3-promoter–enhancer plasmid to generate the plasmids pGL3-HSD17B3-enhancer 1 (17B3-E1), pGL3-HSD17B3-enhancer 2 (17B3-E2), and pGL3-HSD17B3-enhancer 3 (17B3-E3).
The dual-luciferase reporter assay was performed as previously described [26]. Briefly, JEG3 cells were grown to 80% confluence in 24-well plates (approximately 1 × 10⁵ cells/well) and transfected with plasmid 3B1-P, 17B3-E1, 17B3-E2, or 17B3-E3 with or without plasmid WT-G. After 48 h of transfection, the cells were harvested using a passive lysis buffer and luciferase activity was measured using a Dual-Luciferase Reporter Assay Kit (Promega, Madison, WI, USA) and a luminometer (GloMax, Promega), according to the manufacturer's instructions. Renilla luciferase activity was used to normalize the firefly luciferase activity.
5.7 Measurement of T0
The placental tissues were homogenized in PBS with a Bead Ruptor 24 Elite (OMNI International, Beijing, China), and the supernatants were collected after centrifugation (10,000 × g for 10 min) at 4°C. The total T0 level in the placental tissue or cultured cells was measured using a Siemens IMMULITE 2000 immunoassay system (Siemens, Munich, Germany) according to the manufacturer's instructions.
5.8 Heatmap Analysis
Published datasets (GSE159480) from hypoxia-exposed induced pluripotent stem cells (iPSCs) [32] were applied in an HBP-related gene heatmap analysis based on gene FPKM (Fragments Per Kilobase Million). The heatmap display was based on the Z-score value of gene expression.
5.9 Statistical Analysis
All statistical analyses were performed using GraphPad Prism software (version 9.0; GraphPad Software, San Diego, CA, USA). Statistical comparisons between groups were performed using an independent sample nonparametric t-test or unpaired one-way analysis of variance (ANOVA) for normally distributed data, followed by a post hoc Tukey–Kramer multiple comparison analysis. A nonparametric Spearman's correlation test was used to analyze the correlations between 3β-HSD1, 17β-HSD3, GATA3, and T0 levels. Results are shown as the mean ± SEM of at least three independent experiments. Statistical significance was set at p < 0.05.
Expanded Methods are described in the Supporting Information.
Author Contributions
J.L. performed the experiments, analyzed the data, prepared figures, and drafted the manuscript. Y.Y. and H.W. participated in IP experiments, data analysis, and figure preparation. Y.X. and W.F. analyzed single-cell RNA-seq and ATAC-seq data. F.D., Y.W., Y.Z., and X.S. collected clinical samples and participated in data analysis. W.Q., Y.Z., and C.W. performed LC-MS/MS experiment and analyzed the corresponding data. Y-X.L. assisted with cell culture and Western blotting. Y-L.W. and X.S. designed and supervised the study, coordinated the research team, and revised the draft. All authors have read and approved the final manuscript.
Acknowledgments
The authors wish to express their profound gratitude to Dr. Wen Zhou of the Analytical Instrumentation Center at Peking University for his substantial contribution to the analysis of the O-GlcNAcylation site on GATA3, and to Wiley Editing Services for their language editing expertise applied to this manuscript. This work was supported by grants from the National Key Research and Development Program of China (2022YFC2702400, 2022YFC2704700); National Natural Science Foundation in China (82192872, 32171115, 32200934); the Strategic Collaborative Research Program of the Ferring Institute of Reproductive Medicine (FIRMA180304); and Beijing Natural Science Foundation in China (7224356).
Ethics Statement
The protocol for collection of human placental tissue and plasma samples, as well as the animal experiments were approved by the Ethics Committee of the Institute of Zoology, Chinese Academy of Sciences, and Peking University Third Hospital (Beijing, China) with approval numbers IOZ-YSB-2022-02 and IOZ-YSB-2021-14 for clinical and animal experiments, respectively. All pregnant women enrolled in this study signed written informed consent.
Conflicts of Interest
The authors declare no conflicts of interest.
Open Research
Data Availability Statement
The datasets used and/or analyzed during the current study are available from the corresponding author on reasonable request.


