Comparison of genetic and epigenetic profiles of periodontitis according to the presence of type 2 diabetes
Abstract
Type 2 diabetes mellitus (T2DM) and periodontitis (PD) have intricated connections as chronic inflammatory diseases. While the immune response is a key factor that accounts for their association, the underlying mechanisms remain unclear. To gain a deeper understanding of the connection, we conducted research using a multiomics approach. We generated whole genome and methylation profiling array data from the periodontium of PD patients with DM (PDDM) and without DM to confirm genetic and epigenetic changes. Independent bulk and single-cell RNA sequencing data were employed to verify the expression levels of hypo-methylated genes. We observed a gradual rise in C>T base substitutions and hypomethylation in PD and PDDM patients compared with healthy participants. Furthermore, specific genetic and epigenetic alterations were prominently associated with the Fc-gamma receptor-mediated phagocytosis pathway. The upregulation of these genes was confirmed in both the periodontal tissues of PD patients and the pancreatic tissues of T2DM patients. Through single-cell RNA analysis of peripheral blood mononuclear cells, substantial upregulation of Fc-gamma receptors and related genes was particularly identified in monocytes. Our findings suggest that targeting the Fc-gamma signaling pathway in monocytes holds promise as a potential treatment strategy for managing systemic complications associated with diabetes.
1 INTRODUCTION
Type 2 diabetes mellitus (T2DM) is a metabolic disorder distinguished by impairments in either insulin secretion, insulin action, or both.1 T2DM represents the predominant form, encompassing 90% of all cases of diabetes mellitus (DM) and it results from inefficient utilization use of insulin.2 The global incidence of DM has significantly increased in the recent decades. The number of cases have risen from 108 million in 1980 to 422 million in 2014, and the projections indicate that the number of cases will more than double in the next 20 years.3 The World Health Organization has predicted that by 2030, diabetes will become the seventh leading cause of death. As one of T2DM complications, periodontitis (PD) is a widely recognized disease. PD affects the tissues surrounding the teeth and is characterized by gingivitis, periodontal attachment loss, alveolar bone resorption, and eventual tooth loss.4 PD, ranked the sixth most common chronic disease, affects approximately 750 million people worldwide and significantly impacts chewing ability, nutritional status, and quality of life.5
Numerous studies have established a bidirectional relationship between T2DM and PD.6, 7 PD can be worsened by T2DM, and conversely, PD can exacerbate glycemic control and elevate the risk of diabetic complications.8 T2DM contributes to the initiation and progression of PD through mechanisms such as hyperinflammatory response, impaired bone healing processes, and increased production of advanced glycation end products.9 In addition, PD can persistently elevate systemic levels of certain substances like interleukin (IL)-6, tumor necrosis factor (TNF)-α, and C-reactive protein (CRP), leading to systemic inflammation.10-12 Consecutive systemic inflammation can exert detrimental effect on hematopoietic stem progenitor cells and eventually trigger DNA damage, hyperactivity of myeloid cells, and organ dysfunctions.13-17 As another bridge between T2DM and PD, recent insights into epigenetic regulation suggest a significant role in the diabetic pathways. Epigenetic changes, including DNA methylation, histone modifications, and noncoding RNA interactions, have been linked to both the onset and progression of T2DM and PD.18 These modifications can result in unresolved inflammation and have lasting impact on cellular responses independent of the environmental stimulus.19 Thus, the epigenetic changes exacerbates the inflammatory response and leads to pathological gene expression, which can influence insulin signaling pathways, contributing to the complex interplay between T2DM and PD.20, 21
Although there are possible mechanisms playing crucial role in connecting PD and T2DM, there is few research conducted through a multiomics approach that can provide a more holistic perspective of the complex interactions among genes, transcriptomes, and proteins. Therefore, to achieve a more comprehensive understanding of linkage between T2DM and DM, in the present study, we generated and applied multiomics data to look into the genetic and epigenetic link between PD and T2DM and develop the novel therapeutic targets.
2 RESULTS
2.1 Clinical characteristics and cohort descriptions
Our study comprised a total of 36 patients, divided into three groups: 10 healthy individuals, who served as the reference group in all analyses, 15 patients with PD, and 11 patients with PD and type 2 diabetes mellitus (PDDM). While there were no notable differences observed in acute inflammatory indicators such as CRP and erythrocyte sedimentation rate (ESR) among PD and PDDM, both PD and PDDM patients exhibited higher age on average than that of healthy individuals (Table 1). The hemoglobin A1c (HbA1c) levels were elevated exclusively in PDDM patients, while the body mass index (BMI) ranges remained within the normal scale for both PD and PDDM. These findings suggest that individuals in the PDDM group manifested DM independent of obesity.
| Group | Healthy | PD | PDDM |
|---|---|---|---|
| Patients, n | 10 | 15 | 11 |
| Age (mean, SD), years | 37.30 (16.91) | 54.47 (11.11)a | 65.82 (13.43)a |
| Men:women | 10:0 | 6:9 | 7:4 |
| BMI (mean) | NA | 24.95 | 23.29 |
| BMI, n | |||
| <20.5 (low weight) | 0 | 1 | |
| 20.5–25.5 (normal weight) | 7 | 7 | |
| 25.5–30 (overweight) | 4 | 1 | |
| 30 (obese) | 1 | 0 | |
| NA | 10 | 3 | 2 |
| HbA1c (mean) | 5.18 | 5.51 | 7.30a |
| HbA1c, n | |||
| <5.7% | 9 | 9 | 1 |
| 5.7–6.5% | 1 | 5 | 3 |
| 6.5% | 0 | 7 | |
| NA | 0 | 1 | 0 |
| ESR, mean (mm/h) | 4.20 | 8.35 | 4.80 |
| ESR, n (%) | |||
| <15 mm/h | 10 | 11 | 10 |
| 15−20 mm/h | 0 | 1 | 0 |
| >20 mm/h | 0 | 2 | 0 |
| NA (n) | 0 | 1 | 1 |
| CRP, mean (mg/L) | 0.99 | 0.79 | 1.31 |
| CRP, n (%) | |||
| <0.5 mg/L | 7 | 6 | 5 |
| 0.5–3.0 mg/L | 2 | 9 | 5 |
| ≥3.0 mg/L | 1 | 0 | 1 |
| NA (n) | 0 | 0 | 0 |
- a Wilcoxon rank sum test result indicating statistical significance compared with healthy group (p value < 0.05). The comparisons were conducted on age, BMI, HbA1c, ESR, and CRP measurements.
2.2 Differences in somatic mutation patterns between patients with PD and PDDM
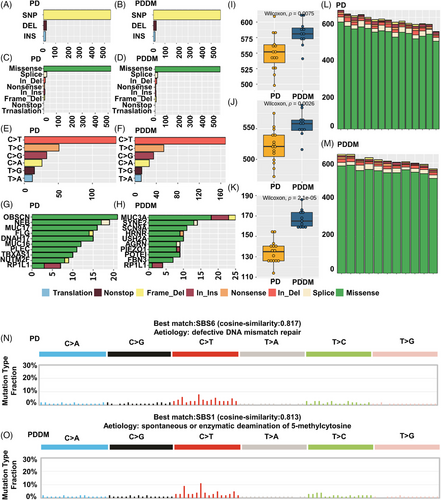
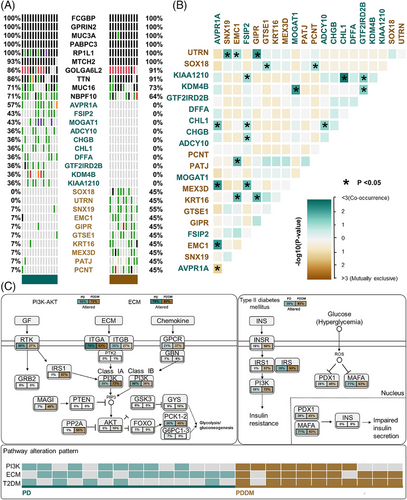
Patients with PD and PDDM exhibit notable differences that contribute to the exacerbation of PD and increase inflammatory responses.22, 23 To compare the mutation patterns, we performed a somatic mutation analysis between patients with PD and PDDM. The mean number of mutations was 564 (534–617) in patients with PD, while it was 589 (545–647) in patients with PDDM, indicating a higher average number of mutations in patients with PDDM (Figure 1A,B). In patients with PD, the highly mutated genes included OBSCN, NEB, MUC17, and FLG, whereas in patients with PDDM, these were MUC3A, SYNE2, SCN9A, and HRNR (Figure 1C,D). These genes were characterized by their considerable length, potentially contributing to the occurrence of common polymorphisms within them. A comprehensive list of mutations found in patients with PD and PDDM is included in Tables S1 and S2. We analyzed the differences between various mutation types, including single nucleotide polymorphisms (SNPs), insertion and deletion (INDEL), and base substitutions, between the two groups. The results revealed no difference in INDEL between the groups (Figure 1E,F); however, patients with PDDM exhibited a significantly higher number of SNPs compared with those with PD (p = 0.0075) (Figure 1G). Additionally, missense mutations were significantly common in patients with PDDM, while no differences were observed in terms of other mutation types (p = 0.0026) (Figure 1H–J). The most common based substitution event observed was C>T. Notably, patients with PDDM exhibited a significantly higher number of C>T substitutions compared with that of patients with PD (p = 2.1e−07) (Figure 1K–M). In summary, patients with PDDM exhibited significantly higher number of mutations compared with those with PD, with a notable increase in the number of C>T substitutions at single nucleotide level. Additionally, we performed mutational signature analysis based on single nucleotide substitution patterns. Patients with PD exhibited the highest similarity to single base substitution signature (SBS) 6 (cosine similarity: 0.817) (Figure 1N), while those with PDDM exhibited the highest similarity to SBS1 (cosine similarity: 0.813) (Figure 1O). Interestingly, patients with PDDM exhibited more C>T single nucleotide substitutions than patients without PDDM, which were most similar to the SBS1 signature. SBS1 is linked to the natural mutation process triggered when 5-methylcytosine undergoes spontaneous or enzymatic deamination, resulting in its conversion to thymine.24 These results suggest that the increased number of C>T base substitutions in patients with PDDM could be due to spontaneous mutations of 5-methylcytosine. We examined mutation patterns not only at the mutation type level but also at the gene level. Common mutated genes between the two groups included FCGBP, GPRIN2, MUC3A, and PABPC3. PD-specific gene mutations included AVPR1A (PD:57% vs. PDDM:0%), FSIP2 (PD:43% vs. PDDM:0%), MOGAT1 (PD:43% vs. PDDM:0%), and ADCY10 (PD:36% vs. PDDM:0%), whereas PDDM-specific gene mutations included SNX19 (PDDM:55% vs. PD:7%), SOX18 (PDDM:45% vs. PD:0%), and UTRN (PDDM:45% vs. PD:0%) (Figure 2A). The gene with the highest co-occurrence in PD-specific gene mutations was FSIP2, which co-occurred with five out of 10 genes. In PDDM-specific gene mutations, GIPR significantly co-occurred with two out of ten genes, and SNX19 and AVPR1A mutations were mutually exclusive (Figure 2B). Though the role of FSIP2 in PD remains unclear, FSIP2 exhibits immunomodulatory functions in skin cutaneous melanoma.25 Additionally, SNPs in the GIPR gene have been associated with alterations in hormone and adipokine secretion in obese type 2 diabetic patients.26, 27 We evaluated pathways with a high mutation burden in both the groups, focusing on frequently mutated genes involved in signaling. The top three pathways included PI3K–AKT, extracellular matrix, and T2DM (Table S3). Patients with PDDM exhibited a higher mutation burden than that of the patients with PD (Figure 2C). Previous studies on diabetes have suggested that functional impairments in certain pathways, particularly the PI3K–AKT pathway, play a role in hyperglycemia and insulin resistance.28
2.3 Genome-wide methylation patterns analysis
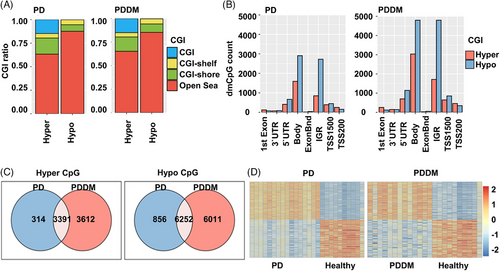
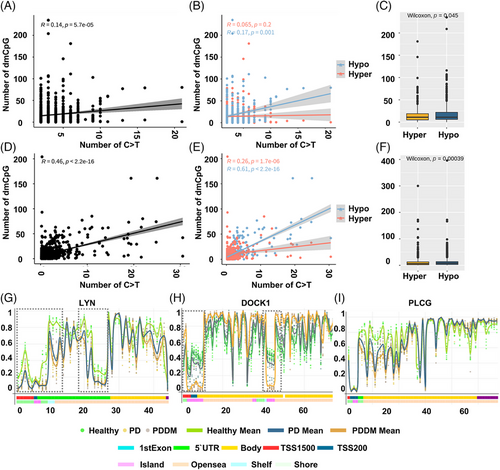
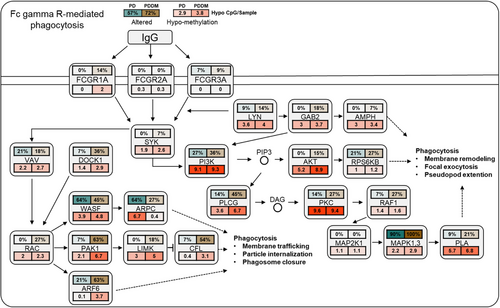
According to previous studies, there exists a strong correlation between C>T mutations and methylation at CpG dinucleotides.29, 30 To inspect the relationship between the mutation and methylation patterns, thus, we conducted a genome-wide methylation analysis for both the groups. The distribution of differentially methylated CpGs (dmCpGs) in both the groups revealed a higher proportion of hyper dmCpG in the order of open sea, shore, island, and shelf. Similarly, hypo dmCpG followed the same order but showed minimal distribution on the island (Figure 3A). Upon further refinement, the gene body and integrin regions exhibited the highest number of dmCpGs (Figure 3B). We identified 10,813 dmCpGs in the PD group (hyper dmCpG: 3705, hypo dmCpG: 7108) and 19,266 (hyper dmCpG: 7003, hypo dmCpG: 12,263) in the PDDM group, approximately double the number (Figure 3C). A heatmap of dmCpG identified in each group is shown in Figure 3D. Notably, the PDDM group exhibited a higher number of C>T mutations and hypo dmCpG than those of the PD group. Spontaneous deamination of methylated cytosine is a well-known mutation hotspot, particularly associated with hypo methylation.31 Based on these findings, we conducted a correlation analysis at the gene level for C>T base substitutions and dmCpGs to ascertain their correlation. As a result, we identified a significant correlation between C>T base substitutions and dmCpG in the PD group (p = 5.7e−05) (Figure 4A; 4 = 0.14). We observed no significant linearity with hyper dmCpG (Figure 4B; 4 = 0.065, p = 0.2); however, a significant linearity was observed with hypo dmCpG (Figure 4B; 4 = 0.17, p = 0.001). Moreover, we observed a significantly higher presence of hypo dmCpG than hyper dmCpGs in genes containing C>T base substitutions (p = 0.045) (Figure 4C). In the PDDM group, a significantly higher association was observed between C>T base substitutions and dmCpG compared with those of the PD group (R = 0.46, p = 2.2e−16) (Figure 4D). Although both hyper and hypo dmCpGs demonstrated significant linearity, hypo dmCpG (R = 0.61, p = 2.2e−16) (Figure 4E) displayed a stronger linearity than hyper dmCpG in the PDDM group (R = 0.26, p = 1.7e−06) (Figure 4E). Based on these findings, we established a strong correlation between hypo dmCpG and C>T base substitutions, and we further conducted a functional enrichment analysis focusing on genes exhibiting both C>T base substitutions and hypo dmCpG. The functional enrichment analysis confirmed that these genes were the most highly concentrated in the Fc-gamma R-mediated phagocytosis signaling pathway. Detailed results of the functional enrichment analysis are presented in Table S4. The Fc-gamma receptors are membrane receptors of various immune cells. In genes exhibiting C>T base substitutions, a significantly higher proportion of hypo dmCpGs were observed compared with hyper dmCpGs (p = 0.00039) (Figure 4F). Interestingly, genes such as LYN, DOCK1, PLCG, MYO10, AMPH, INPP5D, and PRKCA exhibited C>T base substitutions and hypo methylation from the transcription start site 1500 (TSS1500) to the 1st exon region (Figures 4G–I and S1). The burden of C>T base substitutions in this pathway was 57% in the PD group and 72% in the PDDM group, with a mean hypo methylation intensity of 2.9 and 3.8 in PD and PDDM groups, respectively (Figure 5). This finding suggests the infiltration of immune cells with genetic alterations in Fc-gamma receptor-related genes in the periodontal tissues of PD and PDDM patients.
2.4 Validation of the results in independent bulk RNA sequencing datasets
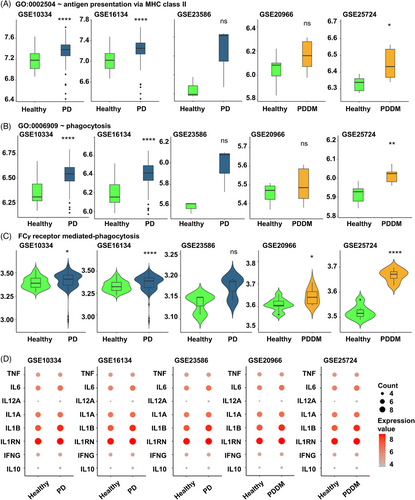
Hypo methylation in the TSS200–TSS1500 region of Fc-gamma receptor-mediated phagocytosis signaling pathway could potentially influence the expression of the corresponding genes. We analyzed the gingival tissues of patients with PD (GSE10334, GSE16134, and GSE23586) and pancreatic tissues of patients with DM (GSE20966 and GSE25724) to verify our findings. Antigen presentation via major histocompatibility complex (MHC) class 2 and phagocytosis related genes of all datasets were found to increase in diseased lesions compared with healthy controls (Figure 6A–C). Furthermore, both pro- and anti-inflammatory cytokines exhibited a tendency to be increased in diseased lesion compared with the healthy controls (Figure 6D). These findings indicated that increased expression of Fc-gamma receptor-related genes, resulting from genomic changes contributes to increased inflammation in the affected site.
2.5 Validation of the results in single cell RNA sequencing data
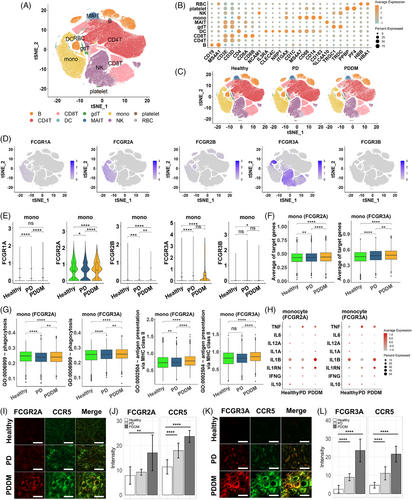
Upon integrating the previous results, we not only observed an increase in phagocytosis mediated by Fc-gamma receptors in periodontal tissues but also indirectly suggested potential activity in pancreatic tissues. This led us to suspect systemic stimulation of phagocytic activity, subsequently prompting questions about which immune cells make contributions. Hence, we examined changes in the Fc-gamma receptor-mediated phagocytosis in the immune cells at single-cell resolution. We analyzed 243,038 peripheral blood mononuclear cells (PBMCs) from healthy individuals, PD, and PDDM patients. The cell types of PBMCs such as B, CD4T, CD8T, gamma delta T (gdT), dendritic cell (DC), monocyte, and natural killer (NK) cell were identified by the representative cell markers (Figure 7A,B). No batch effect was observed depending on the patient group, as all types of cells were evenly distributed (Figure 7C). The Fc-gamma receptors were expressed on various immune cells, especially monocytes, DCs, and NK cells in PBMCs (Figure 7D). Since Fc-gamma receptors can be classified based on their structure and function, we explored the expression level for three subtypes of Fc-gamma receptors: type I Fc-gamma receptor (FCGR1A), type II Fc-gamma receptor (FCGR2A, FCGR2B), and type III Fc-gamma receptor (FCGR3A, FCGR3B). The expression analysis revealed that monocytes predominantly expressed FCGR2A and FCGR3A, while the expression of other receptors were relatively low (Figure 7E). FCGR3A was predominantly expressed in NK cells across all three conditions and in DCs, the expression of FCGR1A, FCGR2A, and FCGR3A were significantly increased in patients with PDDM compared with that in the healthy individuals and those with PD (Figure S2A,B). This is consistent with previous studies reporting that the expression of these receptors can be induced under inflammatory stimulation.32, 33 Intriguingly, in both the PD and PDDM groups, FCGR2A+ and FCGR3A+ monocytes specifically expressed higher level of the targeted genes, than that of the healthy controls. Moreover, the gene expression levels in the PDDM group were higher than that of the PD group (Figure 7F). To investigate the role of intracellular signaling cascades in Fc-gamma receptor-expressing cells, we quantified the activity for antigen processing and presentation of peptide or polysaccharide antigen via MHC class II as well as phagocytosis. In FCGR2A/FCGR3A-expressing monocytes, the antigen-presenting process was more activated in both disease groups compared with that of the healthy controls, with the highest activation observed in patients with PDDM (Figure 7G). Consistent with this observation, Fc-gamma receptor-expressing monocytes expressed higher amounts of pro-inflammatory cytokines, such as TNF, IL1RN, and IFNG, in PD and PDDM patients compared with those in the healthy individuals. Conversely, IL10 and anti-inflammatory cytokine expressions were reduced in patients with PD and PDDM (Figure 7H). In other immune cells, such as NK cells and DCs, phagocytosis and antigen presentation were upregulated in the PD group and compromised in the PDDM group (Figure S2C,D). Most of the cytokines exhibited substantial expression in patients with PD, whereas inconsistent expression was observed in patients with PDDM (Figure S2E,F). To verify the key genes at protein level, we conducted immunohistochemistry staining on periodontal tissue, obtained from healthy, PD and PDDM group. The analysis revealed a progressive augmentation in FCGR2A intensities within monocytes expressing CCR5, in contrast to healthy donors (Figure 7I,J). Consistent patterns were also observed for FCGR3A (Figure 7K,L). These consistencies indicate that monocytes play a crucial role in increasing systemic inflammation through the activation of Fc-gamma receptors. This finding highlights the importance of targeting the signaling pathway in monocytes to reduce the systemic inflammation in both PD and PDDM, especially in terms of diabetic complications.
3 DISCUSSION
In the present study, we compared the genetic and epigenetic disparities between patients with PD and PDDM. These findings were validated by comprehensively analyzing transcriptome data. This is the first study to characterize the genomic landscape of these two chronic diseases through the application of multiomics profiling.
Understanding the interplay between genetic and epigenetic factors related to diabetic complications is fundamental to unraveling the disease's pathological mechanisms. Recent studies have highlighted that changes in methylation, an epigenetic mechanism, often intersects with candidate genes identified in genome-wide association studies, suggesting that genetic variations could increase the risk of T2DM by influencing DNA methylation, thereby impacting pancreatic function.34 Notably, these observations were made in pancreatic tissue and blood. In our study, we observed that PDDM was associated with more hypomethylated CpG sites and C>T base substitutions than PD, reinforcing a significant link between these two events. Consequently, we proposed that the synergic effect of both genetic and epigenetic changes may predispose to or worsen diabetic complications, even in susceptible tissues. In addition, there is a higher burden of genetic mutations associated with PI3K–AKT, extracellular matrix (ECM), and T2DM signaling pathway in PDDM. These signaling pathways have been consistently reported to be associated with T2DM in previous studies.35-37 For instance, the mutations in genes such as PIK3CA (phosphatidylinositol-4,5-bisphosphate 3-kinase catalytic subunit alpha) and AKT1 (AKT serine/threonine kinase 1) can lead to dysregulation of the pathway or alteration of signaling capacity, resulting in the development of insulin resistance and its association with T2DM.37, 38 In addition, it is noteworthy that PI3K–AKT pathway along with the Fc-gamma receptors-mediated pathway identified in hypomethylated gene sets. Both pathways play significant roles not only in cell survival, growth, and differentiation but also in the activation of macrophages.39-41 Moreover, the PI3K/Akt pathway is recognized to be triggered by Fc receptors, modulating cytokine production.42, 43 Consistent with these findings, monocytes exhibited elevated phagocytosis through Fc-gamma receptors in the PD and PDDM as evidenced by single-cell analysis. The composition of ECM, regulated by various genes, can also impact the onset and progression of T2DM. For example, genetic mutations in the ECM component protein COL4A3, MMP-9, and TIMP-1 have been reported to be associated with T2DM.44 It indirectly supports the hypothesis that the development and exacerbation of diabetic complications may result from the invasion of tissues by cells with specific functional impairments. Hence, our results offer new insights and opportunities for further exploration of the mechanisms underlying diabetic complications.
We also identified changes at the individual gene level through the presence of more hypomethylated CpG sites and C>T nucleotide substitutions in PDDM than PD in genome-wide regions. Interestingly, the genes exhibiting these features were associated with the Fc-gamma receptor-mediated phagocytosis signaling pathway. Fc-gamma receptors, primarily found on immune cells, play a dual role in transmitting both inflammatory and noninflammatory signals.45, 46 Due to their involvement in various inflammatory diseases, they have been extensively suggested as potential therapeutic targets in immune-mediated diseases.47, 48 Though the role of Fc-gamma receptors in PD is not well understood, polymorphisms in Fc-gamma-receptor genes, specifically FCGR2A, FCGR3A, and FCGR3B, are associated with pathogenesis of chronic PD.49-51 In addition, Fc-gamma receptor has been implicated as a shared characteristic with PD complications.52 On the other hand, the role of Fc-gamma receptors in T2DM is controversial. Phagocytosis via Fc-gamma receptors has been reported to be impaired in patients with T2DM.53 However, some article have suggested their deficiency attenuates diabetic nephropathy and their activation contribute to the development of autoimmune diabetes.54, 55 Additionally, our previous analysis of PD and T2DM differential expression revealed a significant upregulation of genes related to the Fc-gamma receptor-mediated phagocytosis pathway.56 Therefore, our results emphasize once again the importance of the Fc-gamma receptor-mediated phagocytosis signaling pathway in T2DM and accumulated C>T mutation and hypo methylation. Although future experiments involving Fc-gamma receptor inhibition, such as through miRNAs or antibodies, would be needed to determine whether alleviation of PD and DM complications development can be achieved via the Fc-gamma receptor pathway,57, 58 these results underscore the importance of genes related to Fc-gamma receptor-mediated phagocytosis as potential therapeutic targets. We performed additional validation in this study through expression profiling datasets conducted in periodontal and pancreatic tissues and confirmed upregulated expression values. We further performed single-cell analysis of PBMCs to identify circulating cells invading the periodontium. As a result, we identified genes related to Fc-gamma receptor-mediated phagocytosis that were significantly upregulated in monocytes of PDDM compared with PD and observed prominently elevated protein of the Fc-gamma receptor in periodontal tissue as well.
Nonetheless, our study has several limitations. While we utilized various omics datasets to validate Fc-gamma receptor-mediated phagocytosis-related genes, including publicly available data from repositories like Gene Expression Omnibus (GEO), inherent differences among datasets may arise due to variations in experimental design, sample populations, and technical platforms. Therefore, while analysis of GEO data provide valuable insights, cautious interpretation needs to be warranted due to limitations in observational data and the potential presence of uncontrolled variables. Additionally, we conducted correlation analysis hypothesizing that cumulative C>T base substitutions would lead to an increase in hypo dmCpG. As anticipated, we observed significant linearity between C>T base substitutions and hypo dmCpG in all PD and PDDM groups. However, as these results are based on correlation analysis, further experimental validation is essential.
4 CONCLUSION
In our study, periodontal tissue had significantly more somatic mutations in PDDM. These results and single-cell analysis indicate the possibility that T2DM-induced monocytes with C>T base substitutions and hypo-methylation events invaded the periodontal tissue. Therefore, we believe that targeting the monocyte Fc-gamma receptor-mediated phagocytosis signaling pathway as a potential therapeutic target could be a promising treatment method to inhibit T2DM and its related complications.
5 MATERIALS AND METHODS
5.1 Human sample acquisition and criteria
This research was carried out following the principles outlined in the Declaration of Helsinki, with approval obtained from the Institutional Review Board of Pusan National University Dental Hospital (IRB No. PNUDH-2020-032). Verbal and written consent was obtained from all the study patients prior to the commencement of the study regarding the use of their blood and tissue samples. Individuals were selected and classified into healthy group, PD group, and PDDM group on the basis of their medical history, which was obtained through interview and questionnaire. Patients with <3 mm of pocket depth and no clinical manifestation of inflammation, including swelling, redness, or bleeding upon probing, were regarded as healthy individuals. Hb1AC levels were measured and periodontal status was assessed to verify the presence of PD and PDDM. Individuals with systemic illnesses apart from DM and those who received periodontal treatment or antibiotics in the past 6 months were not included in the study. Venous blood was collected through regular venipuncture and stored in plastic tubes containing ethylenediaminetetraacetic acid. A gingival tissue, comprising the pocket epithelium and connective tissue, was collected from each patient. These tissues were gathered during periodontal flap surgery from individuals diagnosed with PD and PDDM. For subjects who are included in healthy group, tissue collection took place during procedures such as crown lengthening or extractions unrelated to periodontal issues. Follwing extraction, the gingival tissue underwent washing with sterile normal saline solution to eliminate any blood clots or detached plaque adhering to the tissue surface.
5.2 PBMC Isolation
PBMCs were separated within 30 min of collection using SepMate (Stemcell Technologies, Seattle, WA, USA) according to the manufacturer's instructions. The procedure involved adding the insert with density gradient medium, filling the SepMate tube with diluted blood sample mixed with phosphate-buffered saline (PBS) and 2% fetal bovine serum (FBS) and then centrifuging at room temperature at 1200×g for 10 min. The upper layer was transferred to new tubes, and subjected to two washes with PBS and 2% FBS, followed by another centrifugation at 120×g for 10 min at room temperature. The obtained PBMCs were then frozen and stored at −80°C before use.
5.3 MGI PE library construction and sequencing
The genomic DNA underwent fragmentation, resulting in DNA fragments ranging from 100 to 1000 base pairs, ideal for PE150 sequencing. This fragmentation process was carried out using the Frag enzyme from MGI in Shenzhen, China, following the guidelines provided by the manufacturer's MGI FS DNA library prep set (cat No. 1,000,005,256). The fragmented DNA was further selected using DNA clean beads (MGI, Shenzhen, China) so that it ranged between 300 and 500 bp. Following fragment selection, the DNA fragments underwent repair to achieve a blunt end and were altered at the 3′ end to produce a dATP sticky end. Subsequently, both ends of the DNA fragments were attached with a dTTP-tailed adapter sequence through ligation. The resultant ligation product underwent seven cycles of amplification and was then subjected to a single-strand circularization procedure. This involved heat-denaturing the polymerase chain reaction (PCR) product alongside a complementary molecule reverse-complemented to a specific strand of the PCR product, followed by ligating the single-strand molecule using DNA ligase. The residual linear molecule was digested with exonuclease, resulting in the formation of a single-strand circular DNA library. The sequencing of this DNA library was carried out using DNBSEQ-T7 with a paired-end read length of 150 base pairs.
5.4 Whole-genome sequencing analysis
The whole-genome sequences were analyzed based on the Genome Analysis Toolkit (GATK) Best Practices for short somatic variant discovery.59 The procedure included mapping sequence reads to the human reference genome (GRCh38) using the Burrows-Wheeler Aligner MEM algorithm, identification and handling of duplicates using Picard, and recalibration of base quality scores using GATK.60 We achieved a 15-fold and 50-fold coverage for 79−99 and 42−92% of the target bases, respectively, with a minimum base quality score of 20. We applied Mutect2 in GATK4 to identify somatic variants, using a “panel of normals” created from 1000 Genomes patients and the gnomAD database as a “germline-resource.” We included in our analysis all somatic variant calls that met the standard Mutect2 filters criteria. We ran Mutect2 in “tumor-only” mode, disregarding the “germline_risk” filter. Any variant calls that solely relied on the “germline_risk” filter were not included in our analysis. The resulting somatic variant calls were then annotated using FUNCOTATOR of GATK4.
5.5 EPIC array bioinformatics analysis
The genomic DNA underwent bisulfite conversion utilizing the EZ DNA methylation kit from Zymo Research. Subsequently, it was examined using the Illumina Infinium MethylationEPIC BeadChip, following the manufacturer's instructions. The analysis was conducted on the iScan system by Illumina at Queensland University of Technology. The raw data, comprising IDAT files from 37 samples, underwent importation, filtering, and normalization utilizing the ChAMP package within R software (version 3.5.1).61 Initially, probes were excluded if their detection p value was ≥0.01, or if they showed fewer than three beads in 5% or more of the samples. To address biases inherent in probe types 1 and 2, β-mixture quantile normalization was conducted, followed by standard quantile normalization. As a result of this filtering process, 128,687 probes were eliminated, leaving 684,246 probes for subsequent analyses. A singular value decomposition analysis revealed the absence of substantial batch effects across methylation arrays and slides. To pinpoint individual CpG sites displaying distinct DNA methylation patterns specific to PD and PDDM, we conducted a comparative methylation analysis between the two conditions. This involved employing t-tests for 684,246 probes, with adjustments made for multiple testing using the Benjamini–Hochberg method within the R function p.adjust. Significance was determined if the adjusted p value was ≤0.05, and if the disparity in average beta values between the two groups was at least 0.2.
5.6 Library construction and processing of single cell RNA-seq
scRNA-seq libraries were generated using the chromium controller, following the 10× chromium Next GEM Single Cell 3′ v3.1 protocol. The cell suspension was combined and applied onto Single Cell 3′ v 3.1 Gel Beads to generate the cDNA library. Subsequently, the library was amplified and subjected to sequencing using the Illumina HiSeq platform. The scRNA-seq data were generated using 10× Genomics Cell Ranger v5.0.1, and FASTQ files were processed using the “cellranger mkfastq” command.62 The raw FASTQ files were aligned in accordance with the human reference genome (GRCh38, v3.0.0) and a gene expression matrix was generated with a unique molecular identifier (UMI) and cell barcode, using “cellranger count” command. The produced count data were loaded, combined, and preprocessed using Seurat v4.1.1 22. To avoid doublet, we used DoubletFinder for each sample and removed the estimated cells 23. Further, cells with less than 500 UMIs or more than 15,000 UMIs and more than 15% mitochondrial reads were discarded. Cells were retained if they had at least 250 genes and no more than 5000 genes. The filtered dataset was normalized using sctransform and integrated by specifying one reference data in healthy individuals, on the basis of number of cells. To visualize the integrated data, dimension reduction was conducted using principal component analysis and t-distributed Stochastic Neighbor Embedding (tSNE). The first 20 principal components were used to construct shared nearest neighbor modularity optimization and Louvain algorithm for community detection was applied to identify cell clusters.
5.7 Identification of PBMCs
Canonical markers of PBMCs were inspected to reveal the identity of clusters. These included CD19, MS4A1 (B cell), CD3E, CD3D (T cell), CD4 (CD4T cell), CD8A, CD8B (CD8T cell), NCAM1 (NK cell), IL3RA, CLEC4C, NRP1, ITGAX, CD1C (DC), MS4A7, CD68, CD14, CD163 (monocyte), SLC4A10 (Mucosal-associated invariant T cell; MAIT), TRGC1, TRDC (gamma-delta T cell; gdT), PPBP, PF4 (platelet), and HBB, HBA1 (red blood cell).63, 64
5.8 Gene list from Gene Ontology and statistical analysis
To explore the functionality of phagocytosis and antigen presentation in each cell type, the average of gene expression for corresponding gene set was calculated per cell. Gene lists for phagocytosis (GO:0006909) and antigen processing and presentation of peptide or polysaccharide antigen via MHC class II (GO:0002504) were obtained from the Molecular Signatures Database (MSigDB).65 The significance of difference between two groups was determined using nonparametric two-sided Wilcoxon rank sum test. p Value < 0.05 was considered statistically significant.
5.9 Immunohistological analysis
For immunohistochemistry, paraffine-embedded tissue sections were deparaffinized, followed by incubation with 3% hydrogen peroxide for 15 min to block the endogenous peroxidases. Next, the sections were blocked with 1% bovine serum albumin for 30 min and then incubated with antibodies against FCGR2A (Abcam), FCGR3A (Abcam), and CCR5 (Santacruz) for overnight at 4°C. The sections were then stained with goat anti-rabbit IgG H&L (Alexa Fluor® 594; Abcam) and goat anti-mouse IgG H&L (Alexa Fluor® 488; Abcam) for 3 h. Confocal images were analyzed using a Carl Zeiss LSM 800 laser scanning microscope, the Zen Blue program (magnification: ×200) and Image J software.
5.10 Statistics analysis
The statistical analyses were performed under R Environment v4.1.2. The Wilcoxon rank-sum test (for two groups) or Kruskal–Wallis test (for more than two groups) was examined to explore differences between groups. We utilized the Fisher's exact test to evaluate the overrepresentation of mutations within a specific gene compared with the baseline mutation frequency. All analyses were conducted with two-sided tests, and statistical significance was determined at p values ≤0.05. Multiple testing adjustments was done using the Benjamini–Hochberg False Discovery Rate method and was employed to differential gene-methylation and GO enrichment analyses.
AUTHOR CONTRIBUTIONS
Yun Hak Kim, and Hae Ryoun Park designed and supervised the study. Junho Kang, Hansong Lee, and Yun Hak Kim performed computational analysis and drafted and revised the manuscript. Ji-Young Joo, Jae-Min Song, Hyun-Joo Kim, and Hae Ryoun Park collected patient consent for the study and conducted experiments. Junho Kang, Hansong Lee, Ji-Young Joo, Jae-Min Song, Hyun-Joo Kim, Yun Hak Kim, and Hae Ryoun Park discussed the results. All authors have read and approved the final manuscript.
ACKNOWLEDGMENTS
This work was supported by the National Research Foundation of Korea (NRF-2018R1A5A2023879, RS-2023-00207946), Korea Health Industry Development Institute, Korea Health Technology R&D Project; Korea Health Industry Development Institute, (HI22C1377), KREONET.
CONFLICT OF INTEREST STATEMENT
The authors declare no conflict of interest.
ETHICS STATEMENT
This study was conducted in accordance with the tenets of Declaration of Helsinki after obtaining approval from the Institutional Review Board of Pusan National University Dental Hospital (IRB No. PNUDH-2020-032). Informed consent was obtained from all patients for being included in the study.
Open Research
DATA AVAILABILITY STATEMENTS
The WGS, EPIC array, and scRNA-seq datasets supporting the conclusions of this study are available from the SRA and GEO repositories with accession numbers PRJNA1116808, GSE267170, and GSE244515, respectively.


