Utilizing novel Escherichia coli-specific conserved signature proteins for enhanced monitoring of recreational water quality
Graphical Abstract
This paper explores the application of a novel DNA sequence type, specifically conserved signature genes encoding conserved signature proteins (CSPs), for bacterial identification. Although our focus is on the identification of Escherichia coli, the same principle can be extended to identify other taxa using their respective CSPs.
Abstract
Escherichia coli serves as a proxy indicator of fecal contamination in aquatic ecosystems. However, its identification using traditional culturing methods can take up to 24 h. The application of DNA markers, such as conserved signature proteins (CSPs) genes (unique to all species/strains of a specific taxon), can form the foundation for novel polymerase chain reaction (PCR) tests that unambiguously identify and detect targeted bacterial taxa of interest. This paper reports the identification of three new highly-conserved CSPs (genes), namely YahL, YdjO, and YjfZ, which are exclusive to E. coli/Shigella. Using PCR primers based on highly conserved regions within these CSPs, we have developed quantitative PCR (qPCR) assays for the evaluation of E. coli/Shigella species in water ecosystems. Both in-silico and experimental PCR testing confirmed the absence of sequence match when tested against other bacteria, thereby confirming 100% specificity of the tested CSPs for E. coli/Shigella. The qPCR assays for each of the three CSPs provided reliable quantification for all tested enterohaemorrhagic and environmental E. coli strains, a requirement for water testing. For recreational water samples, CSP-based quantification showed a high correlation (r > 7, p < 0.01) with conventional viable E. coli enumeration. This indicates that novel CSP-based qPCR assays for E. coli can serve as robust tools for monitoring water ecosystems and other critical areas, including food monitoring.
1 INTRODUCTION
Escherichia coli is a common intestinal inhabitant of homeotherms, including humans, and may be found in environmental waters due to fecal contamination (Kostyla et al., 2015). Water quality monitoring agencies commonly use E. coli concentration as a fecal contamination proxy indicator of freshwater quality, and E. coli beach action values (BAVs) are used as posting guidelines for recreational waters and protecting beachgoers from gastrointestinal illnesses (Health Canada, 2023; USEPA, 2012). Although bacteria from non-fecal sources typically predominate in water ecosystems (Becerra-Castro et al., 2016; Sun et al., 2019), enteric pathogens, even at low levels, can be detrimental to public health (Griffith et al., 2016; Korajkic et al., 2018). Therefore, any E. coli enumeration methodology should be specific only to this fecal indicator and sensitive enough to detect/quantify lower concentrations, even in the case of stochastic (outlier) contamination events.
Conventional methods of E. coli detection for water ecosystems usually rely on culturing-based enumeration techniques, which have an inherent limitation of an 18–24 h delay before results are known (Dorevitch et al., 2017; Saleem et al., 2022). Furthermore, E. coli counts from the prior day may not be a good estimator of the following day's water quality (Saleem et al., 2023), suggesting that the changing E. coli concentrations within 24 h of sample collection may impact the reliability of water posting decisions. E. coli-specific chromogenic media is a method of choice for culturing-based enumeration methods, but some of these media can have high false-positive rates due to chemical constituents in complex water samples (McLain & Williams, 2008; McLain et al., 2011). Commonly used Most Probable Number (MPN) methods, including Colilert-18 for E. coli enumeration, can have >3% false positive/negative rate for freshwater E. coli isolates (Chao et al., 2004). Chromogenic media tests for FIB mainly rely on the activity of enzymes, including β-galactosidase, which some environmental isolates may not express under temperature (44.5°C) required for E. coli testing (Alonso et al., 1998). To overcome the limitations associated with culturing-based methods, nucleic acid amplification-based methods have been developed for FIB like E. coli and Enterococci, including qPCR (Chern et al., 2011; Haugland et al., 2021; USEPA, 2015), Droplet Digital PCR (Cao et al., 2015; Ibekwe et al., 2020), and RNA-based RT-PCR (Heijnen & Medema, 2009) have been developed for water quality monitoring.
Culture-independent molecular methods can serve as a potential alternative to conventional culturing-based methods (Ricchi et al., 2017). In PCR-based methods, quantification or detection of specific FIB depends on genetic markers that are taxonomically conserved only in the target and universal across all target strains. For example, E. coli detection PCR assays have commonly targeted hypervariable regions in universally distributed genes, including 16S rRNA gene (Clifford et al., 2012) and 23S rRNA gene (Ahmed et al., 2012). Although universal taxonomic markers have been developed for environmental water testing, inherent limitations related to the specificity and sensitivity of assays can lead to false positives/negatives (Gensberger et al., 2014; Maheux et al., 2009; Zhang et al., 2015). Additionally, universal taxonomic markers in environmental variants/isolates can have differing gene copy numbers (Kembel et al., 2012) or nucleotide polymorphisms (Hakovirta et al., 2016), which can impact the reliability and accuracy of qPCR assays for targeted taxa. Therefore, it is important to identify conserved genes that are uniquely found in a fecal indicator bacteria, based on which specific qPCR assays can be designed for environmental water testing.
In this study, we report the identification of several conserved signature proteins (CSPs) whose gene sequences are uniquely found in different E. coli strains. Extensive earlier work on CSPs, specific to other microbial taxa, shows that the sequences of these molecular markers provide reliable means for the demarcation of diverse microbial taxa at multiple phylogenetic depths (Gao & Gupta, 2012; Gao et al., 2009; Naushad et al., 2014). In view of their taxon-specificity and predictive ability to be found in other members of a specific taxon, the sequences of these taxon-specific CSPs also provide highly specific means for developing novel diagnostic tests for qualitative/quantitative assessment of specific microorganisms in biological samples, including water ecosystems (Gupta & Griffiths, 2006; Wong et al., 2014). Because of the specificity of these CSPs for a particular taxon, qPCR protocols utilizing them can overcome specificity limitations associated with other conventional universal markers, such as the 16S rRNA gene. This proof-of-concept study aims to identify new E. coli/Shigella-specific CSPs and explore their potential use in the development of robust qPCR assays for water quality monitoring. Specific questions we address in this study are: (1) Can conserved signature proteins/genes unique to E. coli (and Shigella) be identified? (2) Can CSPs/genes be used to develop a qPCR protocol for potential water monitoring strategies? (3) Is there a good correlation between E. coli/Shigella-specific CSPs gene copies and E. coli colony forming units (CFUs) from recreational water samples?
2 EXPERIMENTAL PROCEDURES
2.1 Identification of E. coli and Shigella spp. conserved signature proteins/DNA sequences
E. coli and Shigella-specific Conserved Signature Proteins/DNA sequences were identified by methods used in our previous studies (Gao & Gupta, 2007; Gupta & Mathews, 2010; Gupta & Mok, 2007). Local BLASTp (Altschul et al., 1990) searches were initially conducted on individual proteins from Escherichia coli str. K-12 substr. MG1655 against a database of >2000 different genomes, including>500 genomes for available Enterobacterales species and >200 genomes for diverse E. coli/Shigella strains. Based on these BLASTp searches, candidate E. coli signature proteins were identified for which all significant BLASTp hits were for E. coli/Shigella strains, and the homologs for these proteins were either not found in other bacteria or their E values were <1e-3. Additional BLASTp searches were conducted on the protein sequences of candidate E. coli CSPs against the NCBI nonredundant (nr) database without the low-complexity filter, and the top 5000 hits were examined. Based on these BLASTp searches, those proteins were identified where all significant BLASTp hits (E value < 1e-3) were for E. coli/Shigella strains, and the protein was broadly found in >1000 E. coli/Shigella strains (Gao & Gupta, 2007; Gupta & Mathews, 2010; Gupta & Mok, 2007). The genes for three of the proteins identified by these searches (YahL, YdjO, and YjfZ) were chosen for these studies.
2.2 Primer/probe design and in-silico specificity testing
For the qPCR assays, PCR primer sets were designed for the three E. coli/Shigella CSPs to be less than 120 bp in size for efficient PCR amplification. The sequences of PCR primers and qPCR probes for the three CSPs are indicated in Table 1. Specifically, the primers for YahL, YdjO, and YjfZ qPCR assays generated amplicon sizes of 112, 98, and 114 bases, respectively. The in-silico specificity of these primers was tested using Primer-BLAST (Ye et al., 2012) against NCBI nr and RefSeq genome databases with default parameters and specifying organism type as ‘bacteria.’ Additionally, in-silico amplification specificity was also tested at the phylum level by performing separate searches against each bacterial phylum in the RefSeq genomes database. Probes were designed using specific quality criteria (Lim et al., 2011): (1) Location of the probes was kept in close proximity to one of the primers, (2) Melting temperature of the probes was kept at 5°–10° higher than the primers, and (3) GC content was kept between 35% and 65%. Probes were aligned against the NCBI RefSeq databases to check for specificity.
| Gene | Primer/probe | Sequence (5′–3′) | Amplicon size (bp) |
|---|---|---|---|
| YahL | Forward | ACAGACGCGCCCATTAAGC | 112 |
| Reverse | CGTCCAGAACAGAGAGCAATAA | ||
| Probe | (FAM*)-AGGCGCTTGCGCAT GGATTATT-(MGBNFQ*) |
||
| YdjO | Forward | TTCTCGCTACAGGCACATTC | 98 |
| Reverse | GGCGATGCATACTGACTCAT | ||
| Probe | (FAM*)-TGAGCCAGGAATGTATTG ATAAGTTGGACA-(MGBNFQ*) |
||
| YjfZ | Forward | CAACAGGACGTATGCTCTATCG | 114 |
| Reverse | GCCGTAAACCTTCTGCTAACTC | ||
| Probe | (FAM*)-ACCTCAGCTTTAGACGA AATATATGGTGGT-(MGBNFQ*) |
- Abbreviations: *[FAM], 6-carboxyfluorescein (fluorophore); *[MGBNFQ]: minor groove binding and nonfluorescent quencher.
2.3 Bacterial strain growth and in-vitro specificity testing
The experimental specificity of the PCR primers was examined using negative controls, including Citrobacter rodentium (Enterobacteriaceae) and Serratia marcescens (Pseudomonadota) as in-group negative controls, and Micrococcus luteus (Actinomycetota), Bacillus subtilis (Bacillota), and Staphylococcus epidermis (Bacillota) as non-Pseudomonadota or out-group negative controls. Bacterial strains were grown on LB (Luria–Bertani) agar plates overnight at 37°C. DNA was extracted from single colonies by incubation at 98°C for 5 min in 30 µL of 0.2% SDS (Tris-EDTA) lysis buffer (Packeiser et al., 2013). The DNA concentration in lysate was measured using a QUBIT Fluorometer (dsDNA High-Sensitivity Assay kit, Thermo Fisher Scientific, USA) to ensure successful DNA extraction. Initial primer pair specificity testing was performed using cell lysate from E. coli K12, C. rodentium, S. marcescens, and M. luteus, with 16S rRNA amplification as PCR reaction positive control and non-template control. The primers and probes (qPCR assays) for the three CSPs were tested with E. coli K12 as positive control, negative controls (Discussed earlier), and wastewater DNA as environmental sample positive control. To test for the PCR specificity and nucleotide identity of CSPs in microbially complex samples (wastewater samples), larger amplicon fragments (600–700 bp) for each CSP (Appendix Table A1) were amplified in a total of 25 µL PCR reaction mix containing 1 µL of each primer (10 µm), 12.5 µL of Environmental master mix 2.0 (Thermo Scientific USA), and 10.5 µL of nuclease-free water and 1 µL of DNA extracted from wastewater samples. PCR amplification cycle consisted of initial denaturation at 98°C for 10 min, followed by 35 cycles of 98°C for 30 s, annealing at 60°C for 30 s, and extension at 72°C for 60 s, followed by final extension at 72°C for 5 min. Amplified PCR fragments for each CSP were then purified using Monarch DNA Gel Extraction Kit (New England Biolabs), followed by Sanger sequencing on the SeqStudio Flex Genetic Analyzer at Farncombe Sequencing Institute (McMaster University). Sequenced CSP fragments were aligned against NCBI nr and RefSeq genome databases to validate that the amplified fragments correspond to E. coli/Shigella.
2.4 qPCR assay development and sensitivity testing
PCR fragments (98–114 bp) for each assay were purified using Monarch DNA Gel Extraction Kit (New England Biolabs), followed by DNA quantification and copy number calculations. To avoid inherent E. coli DNA contamination from master mixes (Palomino-kobayashi et al., 2022), Environmental master mix 2.0 (Thermo Scientific, USA), which contains ultra-purified Taq Polymerase was used (https://assets.thermofisher.com/TFS-Assets/LSG/manuals/cms_079133.pdf). Purified DNA was diluted 10-fold to generate DNA standards ranging from 107 to 101 gene copies/µL. Standard curves for each assay were generated in 25 µL total qPCR reaction containing 1 µL of each primer (10 µm), 1 µL of probe (100 µm), 12.5 µL of Environmental master mix 2.0 (Thermo Scientific USA), and 9.5 µL of nuclease-free water. qPCR program included initial denaturation at 98°C for 10 min, followed by 40 cycles of 98°C for 30 s and 60°C for 30 s. Standard curves were only accepted if the coefficient of determination (R2) was higher than 0.95 and amplification efficiency was >90%. qPCR assay sensitivity was determined by analyzing DNA extracted from ten enterohemorrhagic E. coli strains (Karmali et al., 2003; Riley et al., 1983), including O98:H25-EC3, O84:NM-EC2, O172:NM-EC6, O103:H25-N00, O121:NM-N99, O113:H21-CL3, O5:NM-N00, O111:NM, O121:H19, O157:H7, and seven environmental E. coli isolates from aquatic ecosystems (obtained from Environment Canada). Gene copies/ng of DNA were calculated using slope and intercept values from standard curves generated for each assay. Each CSP gene target exists as a single gene copy per genome, and single gene copy targets are an equivalent measure of the number of microorganisms (Harwood et al., 2014). Therefore, the lower limit of detection (LLOD) for each assay was calculated as the lower limit of quantification (LLOQ), defined as the minimum number of gene copies that can be reliably detected per reaction (Klymus et al., 2020). The lower limit of quantification (LLOQ) was calculated by analyzing dilutions of standards in the range of 2 to 10 gene copies/reaction, and the coefficient of variation between the replicates of each qPCR assay was less than 15%
2.5 Recreational water sample collection and E. coli enumeration by culture
Water sample collection from recreational beaches and E. coli enumerations were performed as described earlier (Saleem et al., 2022; Saleem et al., 2023). In brief, 309 water samples were collected from two freshwater beaches (Marie Curtis Park East and Sunnyside beaches) and their adjacent river mouths (Etobicoke Creek and Humber River) between May 31, 2022 and August 26, 2022. Water samples were delivered to the lab within 1 h of sample collection and processed for E. coli enumeration by filtering 100 mL of water sample through a 0.45 µm polycarbonate membrane filter (Millipore Corp., Bedford, MA) and incubating filters on differential coliform agar (OxoidTM) for 24 h at 44.5°C. Only the samples exceeding the USEPA E. coli enumeration beach action value (≥235 CFUs/100 mL, n = 30) (USEPA, 2012) were used for qPCR testing.
2.6 DNA extraction, application of CSP qPCR assays for recreational waters, and data analysis
Approximately 100 mL of water sample was filtered through a 0.22 µm nitrocellulose membrane filter (Millipore Corp.), followed by DNA extraction using the Norgen Soil Plus DNA Extraction kit (Norgen Biotek Corp., Canada), as described previously (Saleem et al., 2024). The final eluate volume of DNA was 50 µL. The DNA concentration was measured using the QUBIT fluorometer (Thermo Scientific). qPCR assays and gene copy estimation for DNA from water samples were performed as described in an earlier section. For correlation analysis, data was log-transformed, and Shapiro-Wilk's normality testing (Stats v3.6.2 R package) was used to determine the normal distribution, followed by either Spearman's or Pearson's methods for correlation analysis.
3 RESULTS
3.1 E. coli/Shigella-specific conserved signature proteins/genes
Conserved signature proteins/DNA proteins/DNA sequences (CSPs) specific to E. coli and Shigella spp. were identified as described in the Methods section. Based on these studies, the genes for three CSPs (YahL, YdjO, and YjfZ) found uniquely in E. coli and Shigella spp. were chosen for the present work. The sequences for these three CSPs matched only E. coli and Shigella spp. when aligned against NCBI(nr/nt) and RefSeq Genomes Databases. Some characteristics of these CSPs are indicated in Table 2. Of these three CSPs, two (YdjO and YjfZ) are annotated as hypothetical/uncharacterized proteins as their cellular functions are yet to be determined.
| Protein name (gene symbol) | Gene ID (NCBI) | Protein length (aa) | Gene length (bp) |
|---|---|---|---|
| Uncharacterized protein (YahL) | 944970 | 271 | 816 |
| Hypothetical protein (YdjO) | 917061 | 267 | 804 |
| DUF2686 domain-containing protein (YjfZ) | 948719 | 264 | 795 |
3.2 In-silico and experimental validation of primer/probe specificity based on the conserved signature proteins/genes
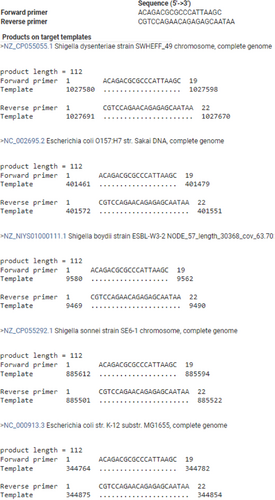
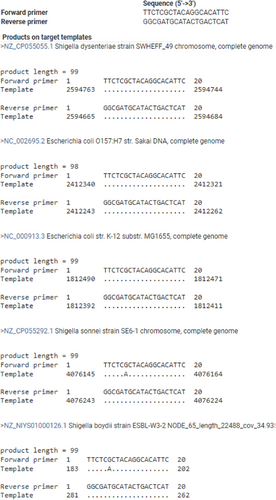
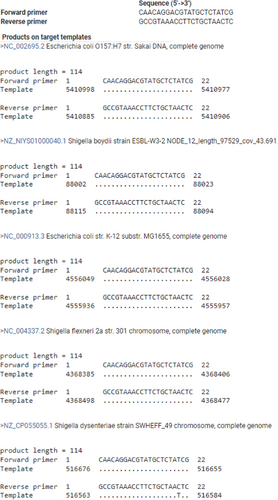
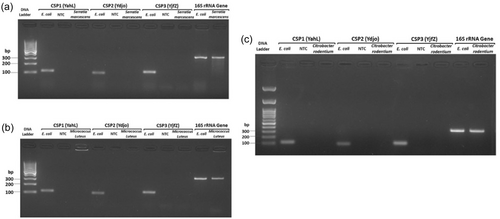
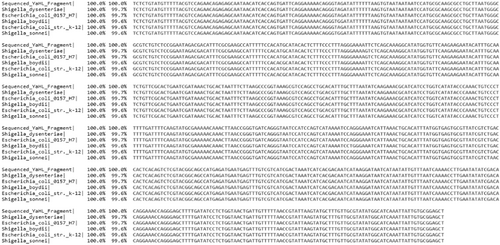
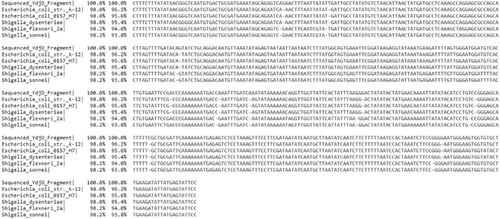
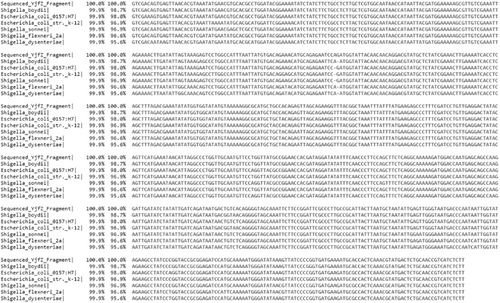
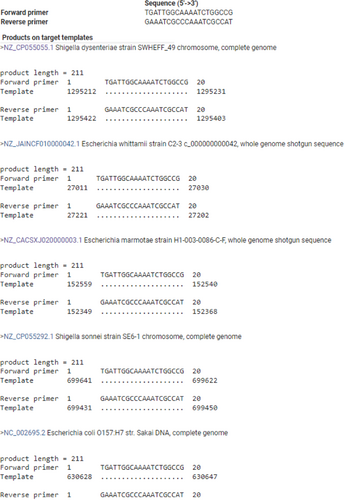
In-silico PCR against NCBI nonredundant (Appendix Table A2) and RefSeq genome databases (Appendix Figures A1, A2, and A3) was used as a first step to assess the specificity of PCR amplification/detection. At the species level, in-silico PCR hits matched with only E. coli for the genus Escherichia, while Shigella hits corresponded to three species (S. dysentriae, S. flexneri, and S. sonnei). To validate the specificity of the designed PCR primers for these three CSPs, colony PCR was performed using E. coli as a positive control, C. rodentium and S. marcescens as in-group negative controls, M. luteus as an out-group negative control, 16S rRNA gene as PCR reaction positive control (Appendix Figure A4). Similar to in-silico PCR, the primer sets for all three CSPs amplified DNA fragments at the expected sizes for E. coli, and no amplification was observed in the examined in-group or out-group negative-control species. Further, probe-based qPCR assays for the CSPs were tested for specificity using E. coli DNA, wastewater samples, and negative control species (C. rodentium, S. marcescens, M. luteus, S. epidermis, and B. subtilis) (Appendix Table A3). Similar to the results for primer specificity tests, no amplification/fluorescence was observed for non-target species, while the probes for all three CSPs generated positive fluorescence for E. coli and wastewater DNA in qPCR assays. To test the PCR specificity and nucleotide identity of CSPs from complex microbial community samples (wastewater DNA), we amplified a larger (500–700 bp) PCR fragment for each CSP, which was then sequenced (Sanger) and aligned against RefSeq reference sequences (Appendix Figures A5, A6 and A7). As expected, all three sequenced CSP fragments from wastewater DNA matched only to E. coli and Shigella species when tested against the NCBI RefSeq Genome Database. Query coverage for each CSP fragment ranged between 98% and 100%, while percentage identity was 94%–99.7%.
3.3 qPCR primer/probe testing and quality control analytics
qPCR assays for three CSPs were first validated on E. coli genomic DNA, wastewater DNA as positive controls, and negative/non-template controls (Appendix Table A3). For three CSP assays, E. coli and wastewater DNA showed comparable threshold cycle (Cq) values. Following qPCR primer/probe testing, standard curves were generated for three CSP-based qPCR assays (Table 3). The coefficients of determination for all three qPCR assays were above 0.99, and the efficiency of amplification ranged between 92% and 101%. Lower limits of quantification for YahL, YdjO, and YjfZ qPCR assays were determined as 2, 6, and 2 gene copies, respectively.
| Quality control parameter | YahL | YdjO | YjfZ |
|---|---|---|---|
| Coefficient of determination (R2) | 0.999 | 0.996 | 0.996 |
| Slope | −3.2 | −3.5 | −3.3 |
| Intercept | 40.5 | 38.6 | 38.3 |
| Efficiency (%) | 101 | 92 | 99 |
| Lower limit of quantification (LLOQ) | 2 | 6 | 2 |
3.4 Sensitivity testing using pathogenic and environmental E. coli strains
The sensitivity of the qPCR assays was tested against ten hemorrhagic and seven environmental E. coli strains (Table 4). All three qPCR assays provided positive amplification for pathogenic and nonpathogenic E. coli strains, with gene copies per nanogram of genomic DNA ranging between 1.5 and 5.5. Gene copies for each strain were comparatively similar between the three qPCR assays. Additionally, a significant (p < 0.001) positive correlation (rp > 0.7) was observed between three qPCR assays for gene copies obtained from E. coli strains (Appendix Table A4). Specifically, a strong positive correlation was observed between YahL and YdjO (rp = 0.92, p = 2.79E-04), followed by YdjO-YjfZ (rp = 0.73, p = 9.40E-04), and YahL-YjfZ (rp = 0.74, p = 9.40E-04).
| E. coli strain-serotype-seropathotype | Host | Source | Log gene copies/ng of DNA YahL YdjO YjfZ | ||
|---|---|---|---|---|---|
| O98:H25-EC3-377-E | Bovine | Karmali et al. (2003) | 4.6 | 3.9 | 4.3 |
| O84:NM-EC2-044-E | Bovine | “ | 4.8 | 4.0 | 4.4 |
| O172:NM-EC6-484-E | Bovine | “ | 4.9 | 4.1 | 1.5 |
| O103:H25-N00-4859-D | Human | “ | 5.1 | 4.2 | 4.8 |
| O121:NM-N99-4390-C | Human | “ | 4.8 | 4.0 | 4.5 |
| O113:H21-CL3-C | Human | “ | 4.9 | 4.2 | 4.6 |
| O5:NM-N00-4067-C | Human | “ | 5.3 | 4.6 | 5.2 |
| O111:NM-R82F2-B | Human | “ | 5.0 | 4.3 | 4.2 |
| O121:H19-CL106-B | Human | “ | 5.4 | 4.5 | 5.1 |
| O157:H7-EDL933-A | Human | Riley et al. (1983) | 5.3 | 4.6 | 5.1 |
| Environmental isolate | – | Environ. Canada | 4.4 | 3.7 | 4.1 |
| Environmental isolate | – | “ | 4.3 | 3.9 | 4.0 |
| Environmental isolate | – | “ | 5.2 | 4.5 | 4.3 |
| Environmental isolate | – | “ | 4.4 | 3.9 | 3.7 |
| Environmental isolate | – | “ | 4.5 | 4.0 | 3.6 |
| Environmental isolate | – | “ | 5.1 | 4.5 | 4.6 |
| Environmental isolate | – | “ | 4.8 | 4.1 | 4.5 |
3.5 Application of qPCR protocol for beach quality monitoring
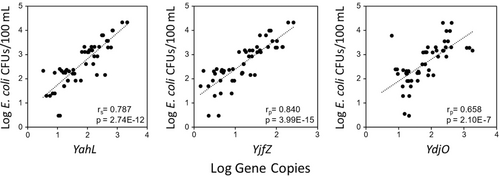
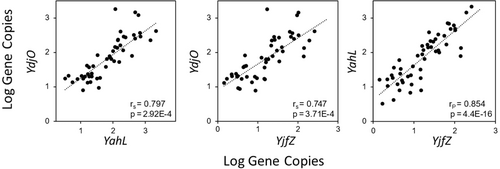
Thirty recreational water samples collected from two different beaches and associated rivers were tested for each of the E. coli/Shigella-specific CSP-based qPCR assays (probe-based) to assess the applicability of these assays for beach monitoring applications. The detection rate of the YahL qPCR assay was 100% for the tested sites, followed by 96% for YjfZ and 93% for YdjO qPCR assays (Appendix Table A5). Additionally, gene copy data from three qPCR assays were compared against culturing-based E. coli colony forming units (CFUs) data to assess the relationship between methods (Figure 1). Gene copies from all three qPCR assays showed a significant (p < 0.001) positive (r > 0.7) correlation with E. coli CFUs. Specifically, a strong correlation was observed between YjfZ and E. coli CFUs (rp = 0.84, p = 3.99E-15), followed by YahL-E. coli CFUs (rs = 0.78, p = 2.74E-12), and YdjO-E. coli CFUs (rp = 0.65, p = 2.10E-07). Correlation analysis was also performed to test the relationship between quantification results from the three CSP-based qPCR assays for the same recreational waters (Figure 2). Similar to the culturable E. coli comparison, a strong significant (p < 0.001) positive correlation (rp > 0.7) was observed for the gene copies obtained from the three different assays for the recreational water samples. Gene copies from YahL and YjfZ showed the strongest correlation (rp = 0.84, p = 4.40E-16), followed by YahL-YdjO (rs = 0.79, p = 2.9E-4), and YdjO-YjfZ (rs = 0.74, p = 3.71E-4).
4 DISCUSSION
Beach water quality monitoring strategies mainly rely on testing fecal indicator bacteria, including E. coli, using culture-based methods, which can take up to 18–24 h and lead to delays in beach posting decisions (Dorevitch et al., 2017; Saleem et al., 2023). To date, universal taxonomic genes, including the 16S rRNA gene (Clifford et al., 2012) and the 23S rRNA gene (Ahmed et al., 2012), have been the primary targets of rapid qPCR-based methods for E. coli detection. However, due to the occurrence of environmental variants of these targeted sequences, qPCR assays targeting universal taxonomic markers may lack specificity (Hakovirta et al., 2016; Maheux et al., 2009) and sensitivity (Kembel et al., 2012). Compared to conventional universal taxonomic DNA markers, Conserved Signature Proteins (CSPs)/DNA sequences represent conserved genes that are unique to specific taxonomic groups (Gao & Gupta, 2007; Gupta & Mathews, 2010; Gupta & Mok, 2007; Naushad et al., 2014). Because of their taxonomic specificity and sequence conservation, the DNA sequences of these CSPs can be targeted to detect specific taxa of interest (Gupta & Griffiths, 2006). In this proof-of-principle study, we identified three E. coli/Shigella-specific CSPs and used them to develop a qPCR-based protocol for testing fecal pollution in recreational freshwater beaches.
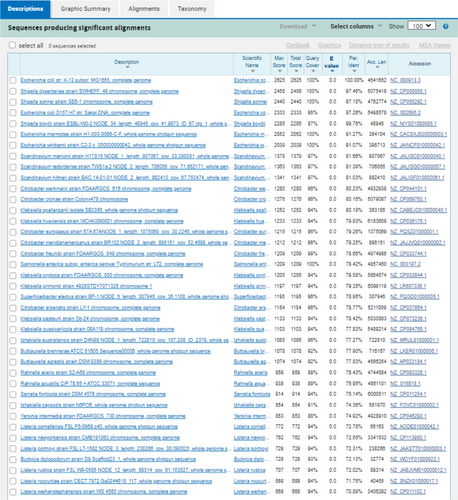
In-silico and in-vitro primer testing validated that all three CSP sequences (YahL, YdjO, and YjfZ) were specific for E. coli and Shigella species, highlighting their taxonomic/evolutionary conservation among the two taxa. As Shigella species are phylogenetically not distinct from E. coli (branch in between different E. coli strains) (Meier-Kolthoff et al., 2014; Sims & Kim, 2011), the shared presence of these CSPs in both Shigella and E. coli is expected. A previous study (Walker et al., 2017) developed a qPCR method targeting the ybbW gene, which is purportedly specific to E. coli and thus not present in Shigella or other bacteria. However, when tested (BLASTn and in-silico PCR) against the NCBI RefSeq Representative Genome Database (Appendix Figures A8 and A9), we found ybbW to be also present in non-E. coli species, including Escherichia marmotae, Shigella, and multiple non-Escherichia taxa (>70% percentage similarity, nucleotide matched >1000 bp). Similarly, nonspecific in-silico matches for primers and probes were observed against Klebsiella, Citrobacter, and other Escherichia species for the E. coli-specific qPCR method based on the detection of the 23 S rRNA gene (Chern et al., 2011; Lane et al., 2020). In comparison, YahL, YdjO, and YjfZ were only found in E. coli and Shigella species, which signifies their value for E. coli/Shigella detection.
Universal taxonomic markers (including 16S and 23S rRNA genes) typically rely on a few conserved nucleotides for taxonomic characterization, but the potential for diverse single nucleotide polymorphisms within or environmental, genetic variants in conserved DNA nucleotides can lead to false positive detection of target taxa (McIlroy et al., 2011; Thorsen et al., 2016). In contrast to the other universal molecular markers used for taxonomic characterization or identification of species in environmental samples, where only a few nucleotides discriminate among different taxa, the entire coding sequences of the CSPs, which are generally quite large (in the present case ~800 bp), are specific for the members of a given taxon (E. coli and Shigella spp.). Hence, the PCR primers and qPCR probes based on these sequences provide more reliable and highly specific means for the identification/characterization of genetically diverse species such as E. coli in complex/ever-evolving microbial environments such as water ecosystems.
CSP-based qPCR assays provided positive results for all ten pathogenic (including O157:H7) and seven environmental E. coli isolates with comparable gene copies between tested isolates, which signifies the potential of using these assays for broad-range environmental testing. False negative detection associated with conventional culture-based enumeration methods is a well-known problem (Ding et al., 2017; Kibbee & Örmeci, 2017). Specifically, E. coli O157:H7 can exist in a viable but not culturable (VBNC) state (Li et al., 2020; Liu et al., 2020) and cannot be detected using conventional culturing-based water methods at 44.5°C, which can lead to underestimation of health risks. Differences in correlation strengths can be due to the inability of culturing-based methods to culture all environmental E. coli isolates, including viable but not culturable cells and E. coli isolates, which may not grow at a specific incubation temperature (44.5°C) recommended for culturing-based analysis (Pommepuy et al., 1996; Servais et al., 2009). Additionally, β-glucuronidase activity-based E. coli enumeration methods, including COLIFAST and COLIMINDER, can generate false positives by detecting β-glucuronidase-positive phenotypes belonging to Klebsiella, Citrobacter, Aeromonas and Enterobacter, Yersinia and Salmonella species (Ciebin et al., 1995; Feng & Hartman, 1982; Frampton & Restaino, 1993). if β-d-glucuronidase activity is either lacking (Maheux et al., 2008) or is present in lower levels (Fricker et al., 2010) in some environmental E. coli isolates, this could also result in underestimated quantification. In comparison, qPCR assays can also detect VBNC E. coli and Shigella species, allowing estimation of the whole spectrum of targeted taxa in complex environmental samples. However, factors including the detection of genetic material from nonviable cells (Gedalanga & Olson, 2009), environmental nucleotide variants/polymorphisms (Boyle et al., 2009; Fernández-No et al., 2015) and some environmental strains carrying a different number of gene copies (Větrovský & Baldrian, 2013) can impact the PCR-based quantification methods. However, a significant positive correlation between gene copy estimates of the three assays can indicate a high level of agreement between the methods.
A previously described E. coli-specific RNA-based qPCR assay (Heijnen & Medema, 2009) has limited sensitivity due to a high lower limit of quantification (LLOQ = ~104 gene copies) (Walker et al., 2017). Environmental water samples can harbor diverse microbial communities with lower fecal indicator densities (Saleem et al., 2024), which may go unnoticed using qPCR assays with higher LLOQs (Walker et al., 2017). All three CSP-based qPCR assays tested in this study demonstrated low LLOQs for recreational water samples, featuring a sensitive detection for environmental water testing. Additionally, unlike RNA-based qPCR assays (as described previously), CSP-based assays showed a high detection rate of E. coli gene copies from recreational waters, which can overcome the variable gene expression limitation associated with RNA-based qPCR assays. Furthermore, gene copies from three CSP-based assays showed significantly strong positive correlations with E. coli Colony Forming Units, indicating the potential application of CSP-based assays as a rapid alternative to conventional culture-based methods for beach monitoring.
In this study, we developed three independent qPCR assays using three E. coli/Shigella-specific Conserved Signature Proteins/genes as targets. The potential of CSP-based qPCR assays to detect E. coli/Shigella species in complex recreational water samples was also explored. All three assays can also detect Shigella species (S. sonnei, S. dysenteriae, S. boydii, and S. flexneri) of public health concern (Health Canada, 2020), which strengthens the potential of these assays. This proof of principle study demonstrates the potential of Conserved Signature Proteins/DNA sequences for designing and developing taxonomically specific quantitative/qualitative molecular assays for other water-related and clinically important organisms. Additionally, this study can serve as the foundation for future studies to assess the relationship between CSP-based fecal indicator estimates and Beach Action Values or water quality thresholds and the development of other CSP-based tests for clinical, food, and water quality surveillance.
5 CONCLUSIONS
- 1.
YahL, YdjO, and YjfZ proteins/genes were identified as conserved for E. coli and Shigella sp only, and in-silico/in-vitro testing validated the conservation of three CSPs, and their potential as molecular markers for developing PCR-based assays.
- 2.
Positive amplification was observed for Enterohemorrhagic and environmental E. coli strains, indicating high detection sensitivity across a range of clinical and environmental isolates of E. coli for CSP-based qPCR assays.
- 3.
E. coli CFUs from culturing-based tests and CSP gene copies (qPCR) from recreational water samples showed a significant positive correlation, indicating the potential of CSP-based qPCR assays for water monitoring applications.
- 4.
CSP-based qPCR assays can be a rapid testing alternative to traditional culture-based testing methods for E. coli and offer a more phylogenetically targeted approach to the detection of E. coli and Shigella for water quality monitoring strategies.
AUTHOR CONTRIBUTIONS
Faizan Saleem: Methodology; data curation; writing–original draft; conceptualization. Enze Li: Writing–review and editing. Kevin L. Tran: Methodology. Bashudev Rudra: Investigation. Thomas A. Edge: Writing–review and editing; conceptualization. Herb E. Schellhorn: Writing–review and editing; supervision; project administration; funding acquisition; conceptualization. Radhey S. Gupta: Conceptualization; funding acquisition; writing–review and editing.
ACKNOWLEDGMENTS
This research was funded by an Alliance grant (#554507-20) by the Natural Sciences and Engineering Research Council of Canada.
CONFLICT OF INTEREST STATEMENT
The authors declare no competing financial interest.
ETHICS STATEMENT
None required.
APPENDIX
| CSP/primer name | Primer sequence (5'–3') | PCR product size (bp) |
|---|---|---|
| YahL-F-Sanger | AGCTCCGCACAATAATTTGATG | 756 |
| YahL-R-Sanger | CTGTCACCTAATTCCTGGACTC | |
| YdjO-F-Sanger | GCCTGGCTTTCGACTCTTT | 610 |
| YdjO-R-Sanger | GAATGTGCCTGTAGCGAGAA | |
| YjfZ-F-Sanger | GCCATTAAGCAATGTCCTTCAG | 772 |
| YjfZ-R-Sanger | AAGAGATGACGGTTGCAGAG |
| Conserved signature protein/genes | PCR product size (bp) | In-silico E. coli matches/hits | In-silico Shigella matches/hits | In-silico non-E. coli and non-Shigella matches/hits | Eschericia/Shigella species matched |
|---|---|---|---|---|---|
| YahL | 112 | 950 | 51 | 0 | Eschericia coli, Shigella dysenteriae, Shigella sonnei, Shigella flexneri |
| YdjO | 99 | 919 | 82 | 0 | |
| YjfZ | 114 | 949 | 57 | 0 |
| qPCR assay | Mean Cq Value | |
|---|---|---|
| Wastewater DNA | YahL | 29.2 |
| YdjO | 30.0 | |
| YjfZ | 32.3 | |
| E. coli K12 Genomic DNA | YahL | 18.8 |
| YdjO | 17.2 | |
| YjfZ | 16.1 | |
| Non-template/negative controls | All three qPCR assays | No amplification/fluorescence Signal |
| Conserved signature proteins | Correlation coefficient | p-value | |
|---|---|---|---|
| YahL | YdjO | 0.92 | 2.79E-04 |
| YahL | YjfZ | 0.74 | 9.40E-04 |
| YdjO | YjfZ | 0.73 | 9.40E-04 |
| qPCR assay | Number of positive samples | Detection efficiency (%) |
|---|---|---|
| YahL | 30 | 100 |
| YdjO | 28 | 93 |
| YjfZ | 29 | 96 |
Open Research
DATA AVAILABILITY STATEMENT
All the analytical data supporting the findings in this study is provided in the figures and tables in the article and its appendix.


