Clinical applications of non-invasive multi and hyperspectral imaging of cell and tissue autofluorescence beyond oncology
Abstract
Hyperspectral and multispectral imaging of cell and tissue autofluorescence employs fluorescence imaging, without exogenous fluorophores, across multiple excitation/emission combinations (spectral channels). This produces an image stack where each pixel (matched by location) contains unique information about the sample's spectral properties. Analysis of this data enables access to a rich, molecularly specific data set from a broad range of cell-native fluorophores (autofluorophores) directly reflective of biochemical status, without use of fixation or stains. This non-invasive, non-destructive technology has great potential to spare the collection of biopsies from sensitive regions. As both staining and biopsy may be impossible, or undesirable, depending on the context, this technology great diagnostic potential for clinical decision making. The main research focus has been on the identification of neoplastic tissues. However, advances have been made in diverse applications—including ophthalmology, cardiovascular health, neurology, infection, assisted reproduction technology and organ transplantation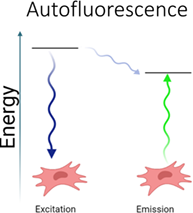 .
.
1 INTRODUCTION
Cells and tissues contain numerous native fluorophores (autofluorophores) that can be excited to emit light at characteristic wavelengths [1, 2] in a similar manner to the exogenous ‘tags’ used in bioimaging technologies like immunofluorescence. Although considered to be noise by other methodologies, with the main technological interest being the optimum way to filter it out without interfering with the signal of interest, autofluorescence can be analysed for information on cell and tissue biochemistry and metabolic changes without staining, fixation or biopsy. This approach has been a useful research tool, especially in contexts where it is desirable to correlate the findings of multiple, potentially interfering assays on single specimens [1]. However, there is also great potential for the translation of this technology to the clinic where the ability to collect biological information non-invasively and non-destructively is potentially valuable, especially in contexts that benefit from tissue characterisation in vivo.
Reduced nicotinamide adenine dinucleotide (NADH) and flavin adenine dinucleotide (FAD) are among the most prevalent of autofluorophores. NADH has excitation maxima at the wavelengths 290 and 351 nm and emission maxima at 440 and 460 nm, while FAD has a single excitation maximum at the wavelength 450 nm with an emission maxima at 535 nm [3]. Their relative concentrations give the optical redox ratio [4] which, as they are principle electron donors and acceptors of oxidative phosphorylation, is a key indicator of cellular metabolism and redox state. Related autofluorophores, that is, NADPH and flavins, have similar spectral profiles that are not spectrally distinct from NADH and FAD. However, differences in their decay rate can allow them to be discriminated by fluorescence-lifetime imaging microscopy (FLIM) [5].
If a static reference frame is used to capture a series of images applying different excitation and/or emission combinations (channels), two-dimensional spectral profiles of the cells or tissue under examination can be created. This imaging strategy—termed multi- or hyperspectral imaging depending on the number of channels applied (multispectral imaging generally refers to the use of 3-10 bands, while hyperspectral imaging can have hundreds). With proper subtraction of background fluorescence [6, 7] the spectral profiles from hyper/multispectral images can then be mapped to the characteristics of specific, known autofluorophores with great precision [2, 8-10]. Additionally, Big-Data approaches to algorithmic modelling, paired with correlative microscopy, have bene used to match hyper/multispectral data to the outcomes of subsequent, invasive stains to build model for the non-invasive assessment of cell and tissue characteristics from the spectral data alone (Figure 1) [1, 11].

Spectroscopic approaches have been applied without the creation of images, but these only capture one spectrum for the entire region of interest, where hyper/multispectral imaging quantifies autofluorescent molecules at a single pixel level (ie, every pixel represents a spectral profile, Figure 2), enabling the production of spatial maps of potentially informative spectral information [2, 8, 12]. These datasets, containing molecular and spatial information, can be analysed by Big Data image analysis methodologies for the estimation of informative cell and tissue characteristics [13, 14]. By preserving spatial features through image analysis greater depth of assessment is made possible [15]. This allows multi/hyperspectral imaging of autofluorescence to enable non-invasive approaches for rapid assessment [16], that are able to obtain complex data from limited samples, even being effective at the single cell level [17]. The relative accessibility of the technology can vary depending on other aspects of the systems implemented; for example, single photon fluorescence has low cost instrumentation while two-photon autofluorescence or FLIM require specialised instrumentation and highly trained personnel [18, 19], and lasers or LEDs may be chosen for excitation.

Source: Adapted from Muselimyan et al. [20] under a cc attribution liscence
Hyper and multispectral imaging of cell and tissue autofluorescence has numerous potential diagnostic clinical applications across a broad variety of disease contexts. Its potential for clinical impact is readily apparent, with pilot studies of in vitro cultured animal cells being carried out for some applications [21], while endoscopic versions of the technology are being trialled in human subjects in others [22]. The largest body of work has been carried out on cancer—mostly relating to the discrimination of normal from neoplastic tissue for diagnosis or the definition of surgical margins. However, this review focuses on all other fields of clinical application where hyper/multispectral imaging of cell and tissue autofluorescence has been put to diverse uses. A scoping review methodology is followed [23] to identify all relevant, contemporary studies on hyper/multispectral imaging of autofluorescence (2010 to September 2021). Title, key and indexing terms (eg, multispectral, hyperspectral, spectral, multi-modal, endogenous fluorescence, native fluorescence and autofluorescence) joined by Boolean operators were searched in Pubmed, Scopus and Embase. An initial 3307 potential studies were identified, which was reduced to 213 on review of the titles and abstracts, with a final 40 studies included after full text review. Studies were found in the clinical areas of ophthalmology, cardiovascular health, neurology, infection, reproductive medicine, dentistry, transplantation and liver health. The approaches taken and resulting findings of these studies are detailed in this review to provide an overview of the field and inform future research and translation (Table 1).
| Excitation | Emission | Single or two photon | Context | Application | |
|---|---|---|---|---|---|
| Ophthalmology | |||||
| Tong et al. [24] | 436, 480 nm | 420 to 720 in 10 nm increments | Single | Ex vivo | Widefield epifluorescence microscope; age related macular degeneration donor tissue |
| Mohammed et al. [25] | 436, 480, 505 nm | 420 to 720 in 10 nm increments | Single | Ex vivo | Widefield epifluorescence microscope; age related macular degeneration donor tissue |
| Dey et al. [26] | 436, 480, 500, 560 nm | 420 to 720 in 10 nm increments | Single | Ex vivo | Upright microscope; retinal tissue from non-neovascular dry AMD and age matched control |
| Ben Ami et al. [27] | 436, 480 nm | 420 to 720 in 10 nm increments | Single | Ex vivo | Zeiss Axio Imager A2 microscope; samples from visually healthy human donors |
| Kaluzny et al. [28] | 488 nm | 496 to 610 nm in 6 nm increments | Single | Ex vivo | Laser scanning confocal microscope; paraffin embedded globes from donors with age related macular degeneration and healthy controls |
| Meleppat et al. [29] | 405, 488, 561, 640 nm | 475 to 750 nm | Single | In situ | Confocal fluorescence microscopy; mouse retinal pigment epithelium flatmounts |
| Dugel et al. [30] | 520 to 940 nm (12 steps) | Not specified | Single | In vivo | RHA™ MultiSpectral Imaging Device |
| Cardiovascular | |||||
| Cardiac | |||||
| Papayan et al. [31] | 360 nm | 385, 460 and 540 | Single | Ex vivo | Multispectral organoscope; in vitro, ischemic rat hearts |
| Muselimyan et al. [20] | 365 nm | 420 to 720 nm | Single | Ex vivo | Nuance FX hyperspectral imaging system; human and bovine atria and left ventricles of blood perfused rat hearts |
| Gil et al. [32] | 365 nm | 420 to 720 nm in 10 nm increments | Single | Ex vivo | Nuance FX hyperspectral imaging system; porcine cardiac tissue |
| Asfour et al. [33] | 365 nm | 420 to 720 nm | Single | Ex vivo | Nuance FX hyperspectral imaging system; porcine left atrial tissue |
| Guan et al. [34] | 365 nm | 420 to 720 in 10 nm increments | Single | Ex vivo | Nuance FX hyperspectral imaging system; atria from freshly excised porcine hearts; |
| Swift et al. [35] | 365 nm | 420 to 720 nm | Single | In vivo | Nuance FX hyperspectral imaging system; ventricular surface of live rats |
| Armstrong et al. [36] | 355 nm | Variable (six bandpass filter wheels) | Single | In vivo | Percutaneous catheter |
| Muselimyan et al. [37] | 365 nm | 420 to 720 nm | Single | Ex vivo | Nuance FX hyperspectral imaging system; rat, porcine and bovine hearts |
| Arterial | Single | ||||
| Alfonso-Garcia et al. [38] | 355 nm | 380 to 400, 415 to 455, 465 to 553 nm | Single | Ex vivo | Optical fiber FLI; porcine carotid arteries |
| Bec et al. [39] | 355 nm | 390, 452, 542, 629 nm | Single | In vivo | Multimodal FLIM catheter; porcine arteries |
| Bec et al. [40] | 355 nm | 390/40, 450/45, 540/50, 630/53 nm | Single | Ex vivo | Bimodal intravascular catheter (FLIM/ultrasonography); patients undergoing heart transplants, organ donors |
| Neurology | |||||
| Michael et al. [41] | 647.1 nm | NS | Adaptive Raman with 3 modalities/two | Ex vivo | Laser-scanning confocal Raman microspectrometer; paraformaldehyde fixed, hippocampus and frontal cortex of Alzheimer's disease brain donors |
| Morgan et al. [42] | 405 nm | 400 to 720 in 10 nm increments | Single | Ex vivo | Confocal microscope; brains from mice exposed to demyelinating treatment |
| Gosnell et al. [4] | 334, 365, 385, 395, 405, 415, 425, 435, 455, 475, 495 nm | 570 to 605 nm | Single | In vitro | Wide-field microscope; neurosphere cells from patients with the mitochondriopathy MELAS |
| Lifante et al. [43] | 808 nm | 900 to 1600 nm | Single | In vivo and Ex vivo | Near infrared II imaging system; mouse brain |
| Infection | |||||
| Graus et al. [44] | 488 nm | 500 to 850 nm | Single | In vitro | Confocal microscopy; Candida species in human serum media |
| Orzekowsky-Schroeder et al. [45] | 730 to 910 nm | 380 to 450, 450 to 500 500 to 580 and 580 to 680 nm | Two | In vivo | Modified two-photon microscope; in vivo mouse intestine |
| Reproduction | |||||
| Blastocyst | |||||
| Gosnell et al. [10] | 334 to 495 in 10 nm increments | 450 to 700 nm, 18 increments | Single | In vitro | Wide-field microscope; morula stage bovine embryos |
| Tan et al. [46] | 395 to 495 nm | 447 to 700 nm (67 channels total) | Single | In vitro | Wide-field microscope; aneuploid mouse blastomeres and blastocysts, human embryonic fibroblasts |
| Santos Monteiro et al. [47] | 367 to 664 nm (39 steps) | 475, 593, 715 nm | Single | In vitro | Wide-field microscope; bovine embryos |
| Oocyte | |||||
| Bertoldo et al. [21] | 345 to 476 nm | 414 to 595 (15 total channels) | Single | In vitro | Widefield microscope; mouse oocytes |
| Campbell et al. [48] | 345 to 476 nm | 414 to 595 (15 total channels) | Single | In vitro | Widefield microscope; mouse oocytes |
| Dentistry | |||||
| El-Sharkawy and Elbasuney [49] | 488 and 514 nm | 400 to 1050 | Single | Ex vivo | Hyperspectral camera; human carious lesion |
| Chen et al. [50] | 405 nm | 565 to 750 nm | Single | Ex vivo | Spectral autofluorescence imaging system; Early decay, established decay, severe decay teeth |
| Abdel Gawad et al. [51] | 395 nm | 400 to 1000 nm with 128 steps | Single | Ex vivo | Hyperspectral camera; prediagnosed teeth |
| Yan et al. [52] | 405 nm | 500, 510, 635 nm; 400 to 1000 2 nm increments | Single | In vitro | Inverted microscope; dental plaque |
| Transplantation | |||||
| Campbell et al. [53] | 358 to 476 ± 5 nm | 414, 451, 575, 594 and 675 ± 20 nm | Single | Ex vivo | Widefield microscope; mouse islets |
| Liver | |||||
| Croce et al. [54] | 366 nm | 400 to 680 nm | Single | Ex vivo | Fluorescence microscope; cryostatic normal, fibrotic, and steatotic liver biopsies |
| Saitou et al. [55] | 405, 488, 561, 640 nm (1 photon), 1050 nm (2 photon) | 400 to 650 nm in 10 nm increments | Single and Two | Ex vivo | Upright confocal laser scanning and multi-photon microscope; mouse model of liver fibrosis |
| Bone and Joint health | |||||
| Nguyen et al. [56] | 280 to 480 in 10 nm increments | 300 to 900 nm | Single | Ex vivo | Endoscopic system; bovine and human knees with femoral insertion |
| Mahbub et al. [2] | 334, 365, 375, 385, 395, 405, 415, 425, 435, 455, 475 ± 10 | 450, 585, 700 nm | Single | Ex vivo | Custom-made wide-field fluorescence microscopy system; healthy bovine articular cartilage and osteoarthritic human articular cartilage |
| Blood disease | |||||
| Rey-Barroso et al. [57] | 405 nm | 452 to in 7 nm increments | Single | Ex vivo | Confocal system; red blood cells from patients with alpha-thalassemia, iron deficiency, and controls |
| Kidney | |||||
| Mahbub et al. [17] | 340 to 510 nm | 420 to 650 nm (total 34 channels) | Single | Ex vivo | Widefield microscope; urine exfoliated kidney proximal tubule cells |
2 OPHTHALMOLOGY
Extensive work has been done applying hyper/multispectral assessment of autofluorescence ophthalmological contexts where conventional assessment of autofluorescence is already a widely applied clinical tool. Age-related macular degeneration (AMD) has been particularly deeply investigated. Tong et al. (2016) carried out two studies using hyperspectral imaging of autofluorescence to characterise the spectral composition of drusen—lipid deposits that can accumulate with age and cause AMD—which, if applied in vivo, could enable the detection of the earliest forms of drusen, thereby providing an early warning for people at risk of AMD. In one study hyperspectral imaging (excitation 436 and 480 nm, emission 420-720 nm, 10 nm steps) of autofluorescence from five donor samples from people with AMD found a novel spectrum—peaking at 510 nm with excitation at 436 nm—that was specific for drusen and sub-retinal pigment epithelium (RPE) deposits [24] with distribution observed throughout the deposits showing that, as a biomarker, it was sensitive as well as specific. In a follow up study with 10 donor samples, including both AMD and controls [25], they showed that the drusen fluorescence was only found in samples from people with AMD, and that its spatial localisation could be improved by the addition of an additional excitation wavelength (505 nm) to the hyperspectral system. A related work applied tensor decomposition for the assessment of hyperspectral images (excitation 436, 480, 500, 560 nm, emission 420-720 nm with 10 nm steps) from samples from AMD donors and controls [26]. This approach enabled the detection of subtle shifts in emission—not specific to drusen—indicating differences in biochemistry which could be exploited for early diagnosis [26].
In another study, candidate spectra for abundant fluorophore families in RPE were assessed using ex vivo samples (RPE/Bruch's membrane flatmounts) from (visually) healthy human donors [27]. These were imaged across the fovea, perifovea and near-periphery, using two excitation wavelengths (436 and 480 nm) with emissions captured between 420 and 720 nm (10 nm steps). A Bruch's membrane (BrM) spectrum as well as and abundant perinuclear lipofuscin/melanolipofuscin spectra of RPE origin were extracted from each tissue assessed with no significant differences across age, sex or retinal location. Although of presently limited utility, given the association of lipofuscin with increasing age, the assessment of these spectra in diseased tissue by multispectral imaging has the potential to provide useful diagnostic and/or prognostic information, particularly with regards to AMD which is characterised by lipofuscin in the RPE [58]. Additionally, Kaluzy et al. [28] investigated autofluorescence signature of retia with age related macular degeneration in a confocal system, with excitation at 488 nm and emissions measured 496 to 610 nm in 6 nm steps. Microscopic features, including individual lipofuscin granules, melanolipofuscin granules, BrM and macroscopic features were evaluated. Although no differences were seen for individual components, AMD eyes showed a statistically significant blue shift—an indicator of oxidation—compared to healthy eyes in the combined RPE/BrM across all tissue sections. As these differences were small, the authors noted it may be a challenge to make use of this characteristic in vivo.
Meleppat et al. investigated major organelles of RPE in mice using a confocal system with four excitation wavelengths (405, 488, 561 and 640 nm and with emissions measured from 475 to 750 nm) [29]. This enabled the creation of detailed images of the RPE mosaic with visualisation of melanosomes and lipofuscin granules, with clearly evident differences between wildtype and mutant (Abca4 knockout—a model of Stargardt disease)—including a red-shift for the lipofuscin—demonstrating potential for disease characterisation. Stargardt disease may be the most common form of retinal dystrophy, but is broadly heterogenous in terms of genetic variants and modifying factors with great phenotypic heterogeneity resulting [59]. As such, novel tools for characterisation and prognosis are greatly needed.
In more translational work, the FDA approved RHA™ MultiSpectral Imaging Device was used in the clinical assessment of a female carrier of choroideremia who had mild visual symptoms and extensive fundus mottling [30]. Excitation from 520 to 940 nm (12 discreet wavelengths) enabled the clear visualisation of fundus anomalies, including RPE mottling with melanin clumping, which the investigators reported were not easily seen through other imaging modalities. Multispectral imaging of fundus autofluorescence further showed spotty regions of hypo and hyper autofluorescence appearance of the fundus.
3 CARDIOVASCULAR HEALTH
In contrast to other contexts, the majority of the available evidence on the application of multispectral imaging of autofluorescence to the cardiovascular system has so far been carried out in animals only. Heart function is vital for human health and survival, making research into the application of non-invasive label free imaging of autofluorescence for human surgical guidance and diagnostics imperative.
3.1 Cardiac assessment
One area which has been particularly closely investigated is the development of methodologies for the visualisation of radiofrequency ablation lesions to improve the treatment of atrial fibrillation, which has a high frequency of recurrence due to incomplete destruction of tissue [20, 32-37]. Application of the assessment of autofluorescence to this clinical problem has been hampered by the presence of thick interwoven layers of autofluorescent collagen and elastin in the left atrium of the heart, which is the most frequent source of the aberrant bioelectrical activities that cause arrythmias. However, the precise spectral characterisation achieved by hyperspectral assessment of autofluorescence has great potential for isolating specific signals in the face of significant interference compared to single or dual channel modes of assessment. Excitation at 365 nm with emission assessment from 420 to 720 nm has been used successfully discriminate normal tissue from radiofrequency lesions placed on ex vivo human, porcine and bovine atria, as well as the left ventricles of ex vivo rat hearts (where the presence of blood was shown to not disrupt the accuracy of discrimination despite decreasing the amplitude of the autofluorescence) as well as the atrial tissue of live pigs [20, 32, 35]. Drops in NADH fluorescence were a particularly strong marker [35]. Across studies radiofrequency ablation was shown to cause decreases in emissions below 490 nm and increases above, attributed to loss of NADH autofluorescence in the scarred region and increased scattering, respectively.
Further work in porcine hearts showed that the spectral step of emission assessment could be reduced to 420, 520, 620 and 720 nm (with excitation at 365 nm) without loss of accuracy—speed of image acquisition being an important consideration due to the high potential for motion artefacts from a beating heart [33]. Additionally, unsupervised analysis using k-means clustering—where the differing areas of ex vivo porcine hearts subjected to radiofrequency ablation were differentiated without use of reference standards—achieved 74% accuracy. Reducing the number of spectral steps here (also to 4) retained 94% accuracy with time cost reduced to 40% [34]. The use of unsupervised modelling demonstrates the utility of hyperspectral imaging of autofluorescence, as classification systems for novel scenarios can be developed without the potential obstacle of the collection of reference standards for training a classifier. Nonetheless, as the authors note, although the training of the classifier may be simplified through the use of unsupervised modelling, the use of such a model would, in most cases, would be slower—a specific issue for cardiovascular imaging [34]. It has also been shown that this technology could be used to discriminate between healthy tissue, radiofrequency ablation lesions and myocardial scarring in live rats whose heart beats had been slowed by immersion in ice water [35]. As the treatment of arrythmias will often require the ablation of dysfunctional tissue within or near areas of scarred myocardium this significantly validated the potential clinical utility of hyperspectral imaging of autofluorescence endoscopy for guiding radiofrequency ablation. Furthermore, this advance could be used to guide other surgical procedures, such as injections for stem cell therapy [60]. In one of their most recent works this group reported on the full process for the development of their prototype catheter for providing a live indicator of autofluorescence characteristics inside a beating heart [36]. Ultimately their system included a 355 nm excitation laser, a compliant balloon, a high-sensitivity charge coupled device, six bandpass filters on a wheel, and image acquisition synchronized with the cardiac cycle. The authors noted that their system is still affected by long overall acquisition times to avoid excessive noise, but that this is constrained by movement of the heart, making the collection of more light to improve signal an immediate translational goal. In an additional report [37], they excited rat, porcine and bovine hearts at 365 nm and collected emissions at 420 to 720 nm, with unmixing undertaken to characterise the molecular correlates of ablation induced spectral changes. They found a drop in myocardial NADH levels, the release of lipofuscin-like pigments and increased diffuse reflectance in cardiac muscle below the endocardial layer. Knowledge of specific biomarkers of ablation could help to optimise acquisition and post-processing, by reducing the number of spectral bands that need to be considered.
Another group investigated the biochemical processes of ischemia in in vitro rat hearts using 360 nm excitation and continuous registration of spectral signals at 385, 460 and 540 nm and found that it resulted in a rapid, increase in NADH autofluorescence (in ischemic regions as well as when the whole heart was subjected to ischemia), with the restoration of perfusate flow reversing the effect [31]. They also found that the repetitive, brief induction of global myocardial ischemia resulted in progressively lower magnitudes for the elevation, which could be the result of a preconditioning effect and points to the potential utility of this technology for preparation, monitoring and evaluation during cardiac surgeries which require periods of anoxia and revascularisation. The apparent contradiction between the spike in NADH fluorescence seen in ischemic hearts compared to the drop reported in cardiac ablation lesions is attributable to the differing natures of the damage [61]. Ablation results in the heat disruption of cardiomyocyte cell and mitochondrial membranes. This causes the rapid loss of NADH, which otherwise exists at high levels in these highly energetic cells, and a consequent drop in fluorescence. During ischemia, however, membrane integrity is maintained but oxygen is depleted. Oxygen is the final electron acceptor in the mitochondrial electron chain, and its depletion prevents NADH being converted to non-fluorescent NAD+, resulting in the accumulation of NADH and increased fluorescence.
3.2 Arterial assessment
In other contexts, an optical fiber based FLIM technology (355 nm excitation, 380-400, 415-455, 465-553 nm emission) was able to detect changes in collagen (variations in 415-455 nm), elastin (variations in 465-553 nm) and cell number (variations in 415-455 nm) in porcine carotid arteries which has potential applications for intraluminal monitoring of vascular tissue graft maturation in bioreactors as well as the in vivo evaluation of surgical therapeutics [38]. Another study that utilised FLIM for the multispectral assessment of autofluorescence in porcine arteries showed that a multimodal catheter system (355 nm excitation, 390, 452, 542, 629 nm emission) was able to rapidly (8 seconds) and consistently resolve the autofluorescent features of arterial walls, supporting the clinical utility of this technology [39].
Intravascular FLIM with excitation applied at 355 nm and emission collected as 390, 450, 540 and 630 nm applied to coronary arteries from patients undergoing heart transplants as well as organ donors was able to quantitatively predict the superficial presence of macrophage foam cells (AUC ROC = 0.94), extracellular lipid content in advanced lesions, and superficial calcium (AUC = 0.90) [40]. Although the experiments were carried-out ex vivo, a FLIM-IVUS catheter system for the in vivo imaging of coronary arteries was utilised. These finding indicate the potential for characterising atherosclerotic lesions in coronary arteries. This conclusion is further reinforced by Nam et al. who, demonstrated that analogue-mean-delay fluorescence lifetime imaging (excitation 355 nm, emission 390, 452 and 542 nm) combined with optical coherence tomography could discriminate rabbit normal iliac arteries from atherosclerotic specimens, with fluorescence lifetime changes being closely related to compositional changes in collagen density, lipid deposition, and macrophage infiltration [62].
4 NEUROLOGY
Hyper and multispectral imaging of autofluorescence has also been applied to a number of neurological dysfunctions. In combination with Raman microscopy—an optical label-free micro-spectroscopic method that uses the sensitive, precise acquisition of spatial and frequency resolved light scattering for the identification of groups of macromolecules—broad-band autofluorescence was able to identify neuritic plaques and neurofibrillary tangles in paraformaldehyde fixed, unstained slices from the hippocampus and frontal cortex of neuropathologically confirmed Alzheimer's disease brain donors [41]. Specifically, broad-band autofluorescence was 2.4 times higher in plaques and tangles compared to surrounding tissues, with some correlation to protein content and stronger correlation to beta-sheet content. Although the use of fixation precludes the application of this technique from the in vivo diagnosis of Alzheimer's disease, it could improve the efficiency definitive Alzheimer's diagnoses which currently rely on multiple, time consuming stains on post-mortem brain sections.
Autofluorescence (evaluated using a confocal microscope with 405 nm laser and emissions collected from 400 to 720 nm in 10 nm steps) was also found to be able to act as a surrogate marker for white matter pathology in specimens from mice exposed to the demyelinating treatment CPZ, with autofluorescent deposits, attributed to myelin debris remnants, being localised to white matter and proportional to lesion severity [42]. Autopsied tissue from people affected by multiple sclerosis (MS) was then investigated and it was shown that lesions could be detected by quantifying autofluorescence in relation to normal appearing white matter, but could not be classified by disease activity based on amount of autofluorescence alone. Autofluorescence relative to normal appearing white matter as well as the spectral signatures at the lesion rim and core also correlated with chronicity. This approach therefore has the novel capability of being able to illustrate past white matter damage that would normally be concealed by repair, and enable the label free characterisation of MS lesion activity.
Another study assessed cultured olfactory neurosphere cells from patients with mitochondrial myopathy, encephalomyopathy, lactic acidosis, stroke-like syndrome (MELAS) using a hyperspectral microscope with LED excitation from 334 to 495 nm (with approximately 10 nm steps) and emission assessed at 570 to 605 nm [4]. As well as successfully unmixing a broad range of autofluorophores (bound flavins, A2E, bound NAD(P)H, free NAD(P)H, lipofuscin). In particular, the effect on free and bound NAD(P)H was complicated as MELAS cells with a high mutational load (44%) had a slight increase of bound NADH compared to controls while those with a lower mutational load (11%) had slightly less bound NAD(P)H and slightly more free NAD(P)H than control cells. This system was also able to discriminate control cells from those from patients with MELAS, as well as detect treatment effects and differentiate cells by their mutational load. The diagnosis of MELAS (as well as other mitochondrial diseases and related disorders) is differential and very difficult due to similarities in biochemical and symptomatic profiles, as such any direct test has significant potential utility.
Lifante et al. investigated the near-infrared (NIR) autofluorescence (excitation 808 nm, emission 900-1600 nm) which takes advantage of the partial transparency of tissues to IR radiation to achieve high contrast deep tissue imaging, to develop a fingerprint for neuromelanin structures within the mouse brain based on the intensity of emission peaks seen at 1075 and 1015 nm [43]. Their findings indicate that this novel approach has potential for examining CNS disorders such as brain melanoma and Parkinson's disease.
5 INFECTION
Accurate, timely detection and diagnosis of infection and its associated pathogen is critical in many areas for the provision of timely care. Fungi of the Candida genus are common fungal pathogens that cause high morbidity and mortality. Their identification requires a culture step which can take up to 2 to 5 days. This can delay the initiation of optimal anti-microbial therapy, increasing the risk of a negative outcome. To address this issue, one study applied hyperspectral microscopy (488 nm excitation, 500-850 nm emission) to the identification of Candida species in human serum media (a model of human physiological conditions) [44]. In this initial investigation they achieved 75% accuracy for Candida albicans, 88% accuracy for Candida glabrata and 83% accuracy for Candida parapsilosis—although, interestingly, differences in spectral profile were not observed when the candida were grown in non-physiological conditions. This level of accuracy compared favourably to conventional methods of clinical diagnosis, which have been found to have false negative rates of 30% to 50% [63, 64]. The authors attributed the differences in emissions they observed to flavins which at 460 nm excitation fluoresce around 530 nm.
In vivo multispectral imaging of autofluorescence (excitation varied between 730 and 910 nm, emission 380-450, 450-500 500-580 and 580-680 nm) has also been shown to be able to discriminate between enterocytes, antigen presenting cells and lysosomes in the small intestine of a mouse model during an 8-hour time lapse experiment [45], which may have potential for investigating immune system activation. Autofluorescence in the cytoplasm of enterocytes was attributable mainly to NAD(P)H, and bright punctuate cell organelles in atypical cytoplasm of enterocytes and within antigen presenting cells were identified as FAD and lipopigment containing lysosomes.
6 REPRODUCTIVE MEDICINE
Assisted reproduction therapy (ART) is increasingly used by couples experiencing difficulties starting their families. With an ageing population and increasingly delayed initiation, this issue is likely to become more prevalent. Due to the heavy burden—both financial and emotional—there are strong incentives to maximise the efficiency of this process. One component of this is the optimal selection of highest quality reproductive material with the greatest likelihood of contributing to successful fertilisation, embryo development, implantation and the livebirth of a healthy offspring. However, assessment is obstructed by the relatively low amount of information available from morphological characteristics, and the importance of prioritising non-invasive assessment (the most reliable indicators of reproductive quality can only be measured through the destruction of the material being assessed, and embryo biopsy, used for screening and diagnosing genetic diseases, is too disruptive for routine application). Hyper and multi spectral imaging of autofluorescence is non-invasive and produces a rich, potentially informative data set and is therefore uniquely suitable for this application. These applications of hyperspectral imaging of autofluorescence are also applicable to the agriculture industry which makes heavy use of in vitro fertilisation and culture of embryos to optimise breeding efficiency.
6.1 Blastocyst assessment
Several studies have applied hyperspectral imaging of autofluorescence to the imaging of embryos as this would directly enable the selection and use of the best quality candidate, maximising the probability of a successful pregnancy without resorting to multiple embryo transfer. Moreover, although embryos are not typically discarded if not transferred in the first attempt, and despite advances, cryopreservation remains a perturbing exposure which further reduces embryo viability, reducing chances of subsequent success.
Gosnell et al. provided proof of concept for the application of hyperspectral imaging (Excitation 334-495, 10 nm steps, Emission 450-700 nm, 18 channels) of cell autofluorescence to embryos by showing that morula stage bovine embryos that had been cultured in low, physiological oxygen concentrations had different spectral properties (eg, greater internal homogeneity) than morula exposed to perturbing, atmospheric concentrations of oxygen [10]. In a follow-up work, the same collaboration identified four features whose linear combination could sensitively discriminate between the morula that had been exposed to the two oxygen environments. Tan et al. investigated whether a hyperspectral (Excitation 395-495 nm, Emission 447-700 nm, 67 spectral channels) signature for aneuploidy could be constructed in order to avoid the collection of biopsies [46]. As well as damaging embryos, many embryos are chimeric to a greater or lesser extent, and the small samples collected by embryo biopsy can consequently give misleading results. They found that an increase in the relative abundance of NAD(P)H as well as a decrease in flavins led to a significant reduction in the optical redox ratios of aneuploid cells in both individual mouse blastomeres and cultured, primary human fibroblasts compared to euploid controls. Furthermore, spectral signatures accurately separated euploid and aneuploid primary human fibroblasts (ROC AUC = 0.85), euploid and aneuploid mouse blastomeres (ROC AUC = 0.99), euploid and aneuploid chimeric blastocysts (ROC AUC = 0.87), and blastocysts with varying degrees (1:1 and 1:3) of chimerism (ROC AUC = 0.88).
Hyperspectral imaging (39 excitation wavelengths from 367 to 664 nm, emission 475, 593 and 715 nm) of cleavage stage bovine embryos also showed that fast developing embryos had significantly lower autofluorescence on day 2 than embryos with on-time development, while on day 4 there were significantly higher levels of NAD(P)H [47]. These findings indicate that better developing embryos have a ‘quieter’ metabolic pattern on day 2 and day 4 which could be useful for embryo selection in IVF.
Unlike most other applications discussed in this review, there has been no human hyper or multispectral imaging of reproductive material to date. This is, to a degree, attributable to caution on the potential for phototoxicity brought on by the hyperspectral imaging potential. However, the Tan et al. paper [46] demonstrated that morula embryos exposed to their hyperspectral imaging regimen developed to the blastocyst stage at the same rate and had not increase in DNA damage. Live birth rate and weight at weaning were also not affected.
6.2 Oocyte assessment
Non-invasive assessment of oocyte viability could provide supportive information for guiding the selection of embryos for transfer and guide clinical decision making in determining how many oocytes need to be cryopreserved for patients who will undergo treatments (eg, chemotherapy) likely to compromise their reproductive health. This would be invaluable for research where currently the only reliable marker of oocyte health is fertilisation and subsequent embryo development (an onerous mode of assessment which obstructs the research into methods for the optimisation of oocyte quality). Two additional papers [21] and [48] have been published reporting different outcomes from the same dataset for the assessment of oocytes from young and aged animals (as well as aged animals treated with the geroprotective agent nicotinamide mononucleotide) by multispectral imaging of autofluorescence (excitation 345-476 nm, emission 414-595 nm, 15 spectral channels).
The first study reported that oocyte levels of NAD(P)H declined with age, but were restored by NMN treatment [21]. In [48], hyperspectral imaging of autofluorescence showed that NMN—an NAD precursor—increased free NAD(P)H, protein bound NAD(P)H, redox ratio and the ratio of bound to free NAD(P)H. Furthermore, a spectral signature was modelled to differentiate young and aged accuracy which subsequently classified the aged, NMN treated oocytes as ‘young’ showing the potential for the technology to be applied as a marker of oocyte quality. Assessment of fluorophore maps was also able to demonstrate that the overall distribution of autofluorophores differed between groups, with young oocytes specifically having a lower gradient of change in flavin levels than aged.
7 DENTISTRY
Early detection of tooth decay (carious) is a priority in dentistry to minimise progression to infection and severe pain as well as to determine the scale of repair this it is necessary to avoid the likelihood of tooth loss. However, current diagnostic options require exposure to ionising X-ray radiation which should be minimised. An optical methodology, preferably utilising wavelengths in the visible region which avoids affecting the chemical, physical and thermal properties of the exposed sample, is therefore desirable. One group [49] used a hyperspectral imaging system (excitation 488 and 514 nm, emission collected by hyperspectral camera, exact range not defined). Reflectance and autofluorescence imaging were combined and it was found that enamel and dentin carious could be distinguished and characterised at 514 nm, while white spot lesions were distinct at 488 nm. Chen et al. showed that spectral imaging of caries lesion autofluorescence (405 nm excitation emission 565-750 nm) could classify sound, early decay, established decay and severe decay [50]. One likely source of the difference in fluorescence was the presence of protoporphyrin IX in Gram negative bacteria which increase as dental plaque biofilm becomes more mature.
More recently, Gawad et al. [51] examined 12 pre-diagnosed teeth using excitation at 395 nm and a hyperspectral camera that took 128 images with an emission range of 400 to 1000 nm and were able to successfully reveal dental lesions on a 2D image. Wavelengths that distinguished abnormal features were at 702 nm (root calculus), 771 nm (white spot) and 798 nm (dentin caries). Yan et al. found that autofluorescence could be used for the detection and classification of Porphyromonas gingivalis, Aggregatibacter actinomycetemcomitans and Streptococcus mutans bacteria in dental plaque based on the spectral intensity ratios 510/635 and 500/635 nm with excitation at 405 nm with 99% sensitivity and 99% specificity [52]. The fluorescent spectrum, of P gingivalis which at 405 nm excitation had a peaks around 635 and 705 nm, was attributed to protoporphyrin IX and coproporphyrin, while the spectra of S mutans (500 nm peak with a long tail extending toward the red) and A actinomycetemcomitans (500 and 635 nm peaks) were hypothesised to arise from FAD and other flavins generated by the bacteria species' energy metabolisms.
8 TRANSPLANTATION
Type-1 diabetes with hyperglycaemic unawareness can be treated by the transplantation of pancreatic islets. However, islets are often exposed to viability compromising conditions prior to removal from the organ donor which results in a low success rates and multiple treatment attempts. Unsuccessful treatments are a major patient burden and it would therefore be advantageous to be able to avoid attempting to transplant islets with no actual potential to restore glycaemic control. One relevant study has been carried out in this area [53] wherein it was demonstrated that a hyperspectral imaging system (Excitation 358 to 476 ± 5 nm, Emission 414 to 675 ± 20 nm), applied to mouse islets was able to sensitively identify islets exposed ROS (AUC = 1.00), hypoxia (AUC = 0.69), cytokines (AUC = 0.94) and warm ischemia (AUC = 0.94). Unmixing of the spectra succeeded in identifying NAD(P)H, flavins, collagen and cytochrome-C. Redox ratio (NAD(P)H/Flavins) was consistently elevated in islets exposed to compromising conditions. Moreover, the application of unsupervised assessment to hyperspectral images of islets transplanted into syngenic mice showed that the results could be used to prospectively identify whether or not a given islet preparation would restore glucose control (correctly classifying 6 functional and 3 non-functional preparations as such).
Other work by the same group has shown that mesenchymal stem cells, often used in cell transplant therapies, can have their functional characteristics probed by multispectral assessment of autofluorescence, including their functional age [65] and the levels of ROS [11].
9 LIVER HEALTH
Early, sensitive and specific characterisation of liver dysfunction is essential for risk stratification, monitoring of management strategies and has implications for transplantation. This has motivated work to investigate whether tissue autofluorescence could be used to detect and characterise liver pathologies. Specifically in 2010 Croce et al. showed that with excitation at 366 nm and emissions collected from 400 to 680 nm, NAD(P)H, collagen and vitamin A could be identified and used to characterise normal, fibrotic and steatotic liver tissue collected during surgical operations, with fibrotic tissue having a higher a signal, shifted towards shorter wavelengths [54]. More recently Saitou et al. studied carbon tetrachloride induced liver fibrosis in mice and developed a machine learning framework which was capable of using hyperspectral data (excitation 405, 488, 561, 640 and 1050 nm, emission 400-650 nm with 10 nm steps) along with SHG to discriminate between normal and diseased liver, as well as progressive disease states (90%-95% accuracy for classification) [55]. With the development of endoscopic techniques, this would enable the real-time histological examination of the liver without necessitating a biopsy for the diagnosis of liver disease.
10 BONE AND JOINT HEALTH
Mahbub et al. investigated the non-invasive monitoring of the functional state of articular cartilage tissue using 18 channels from combination of excitation at 334, 365, 375, 385, 395, 405, 415, 425, 435, 455, 475 ± 10 nm and emission filters at 450, 585 and 700 nm [2]. They were able to successfully identify collagen type I and II as well as free NAD(P)H and FAD. Furthermore, they identified chondrocyte cells within the cartilage and observed differences in molecular composition between superficial and transitional zones of articular cartilage which were sensitive to disease states and therapy.
Nguyen et al. used arthroscopic autofluorescence imaging, assessed with excitation wavelengths scanned from 280 to 480 nm in 10 nm steps, and emissions assessed from 300 to 900 nm to improve the visualisation of the anterior cruciate ligament during reconstructive surgery, with a focus on improving contrast between the femoral insertion site and background using bovine and human knees [56]. A mean Dice coefficient of 0.84 was obtained for agreement between visible light and autofluorescence. The authors concluded that these findings supported that their device could be used for guiding arthroscopic procedures, and that they could also have implications for diagnosis.
11 BLOOD DISEASES
Hemoglobinopathies are common, particularly in tropical countries, but their diagnosis can be difficult due to alternative causes of anaemia resulting in expensive genetic tests. Rey-Barroso et al. found that red blood cells from patients with different forms of alpha-thalassemia, iron deficiency (including iron deficiency anaemia), and healthy controls could be discriminated using a multispectral confocal system with excitation at 405 nm and emissions collected from 452 to 791 nm in 7 nm steps [57]. Specifically, mean intensities at 502, 579, 628 and 649 nm allowed full differentiation of diseased and healthy cells. Potential autofluorophores that were hypothesised to have contributed to this pattern included haemoglobin, lipofuscin and porphyrins.
12 KIDNEY HEALTH
The collection of biopsies for assessing kidney health is painful and risky, as such it cannot be undertaken lightly, and significant kidney function will often have been irreversibly lost before kidney disease is diagnosed. Mahbub et al. investigated whether multispectral imaging of urine exfoliated kidney proximal tubule cells could be used to indirectly assess kidney health [17]. From a system with 34 channels (selected from excitation 340-510 nm and emission 420-650 nm) they extracted 10 spectral features and were able to differentiate cells from healthy individuals and those with impaired renal function (assessed by estimated glomerular filtration rate) with an AUC = 0.99. Cells from patients with confirmed renal fibrosis could be differentiated from healthy controls with AUC = 0.90. The authors concluded that multispectral assessment of exfoliated kidney cells has strong potential to be developed as a sensitive, non-invasive diagnostic methodology for chronic kidney disease.
13 CONCLUSIONS
Beyond oncology, hyper/multispectral imaging of autofluorescence has been trialled for the non-invasive characterisation of cells and tissues in the clinical contexts of ophthalmology, cardiovascular health, neurology, infection, assisted reproduction technology and transplantation. Of these, the most work with the greatest progress towards clinical translation has been done for ophthalmology. A primary driver of in vivo human translation seems to be tissue accessibility, as the non-invasive nature of the technology means that it can be trialled on surface contexts (with no real potential for negative patient outcomes). Animal work is focused on developing new options where there is a strong clinical need for non-invasive testing, but the same driver of necessity makes human research difficult (ie, cardiovascular tissue characterisation; embryo and gamete viability assessment). Further clinical investigation as human variation (eg, in pigmentation) is likely to be a strong hurdle to overcome for the development of generalisable applications.
In conclusion, the application of multi and hyperspectral imaging to clinical contexts is a promising strategy to resolve intractable challenges where current options for the biological characterisation of cells and tissue are inaccurate or dangerous. Progress is heterogenous, however, with work directed more strongly by accessibility than clinical demand. Studies has also shown promising potential for the combination of this technology with other imaging modalities, such as SHG, reflectance microscopy and Raman microscopy. A degree of scientific imagination will be required to identify optimal future applications, as the in-depth characterisations that the literature has shown that hyperspectral imaging can achieve—completely non-invasively—has the potential to not just support or replace sub-optimal testing regimens, but also enable hitherto un-assayable systems to be clinically assessed.
FUNDING STATEMENT
This research was funded by the Australian Research Council, grant number DP210102960.
Open Research
DATA AVAILABILITY STATEMENT
No data was generated by this review.