Projected Climate Scenarios Reveal an Expanding Suitable Habitat for the Critically Endangered African White-Backed Vulture Gyps africanus预测的气候情景揭示了极危非洲白背兀鹫的适宜栖息地不断扩展
Editor-in-Chief & Handling Editor: Binbin Li
ABSTRACT
enEstimating the potential distribution of climatically suitable habitats for different species is important for developing targeted and adaptable biodiversity conservation strategies. However, such crucial information remains limited for obligate scavengers such as the Critically Endangered (CE) African White-backed Vulture (AWbVs) Gyps africanus. In this study, we applied two Species Distribution Modelling (SDM) algorithms, MaxEnt and BIOCLIM, within the Wallace interface to predict changes in the climatically suitable geographic ranges of the AWbVs under current, 2050, and 2070 climate scenarios in the Hwange ecosystem. Using 19 dynamic bioclimatic variables, five Global Circulation Models (GCMs), and two Representative Concentration Pathways (RCPs), we modelled the potential impacts of climatic changes on AWbVs geographic ranges. This analysis incorporated 89,809 GPS occurrence data points collected from six AWbVs that were captured and tracked in Hwange National Park and its surrounding areas. Model performance was robust, with a high overall mean AUC of 0.89. Our results indicate that climatic suitability within protected areas is expected to remain stable under future climate change scenarios. In addition, models developed in this study suggest that suitable habitats for the AWbVs are expected to expand significantly by 2050 and 2070, extending towards human-dominated landscapes. Given the critical conservation status of the AWbVs, these findings offer valuable insights that can inform current and future conservation strategies.
摘要
zh评估物种气候适宜栖息地的潜在分布对于制定针对性和灵活性的生物多样性保护策略至关重要。然而,这类关键信息在非洲白背兀鹫(Gyps africanus)等专性食腐动物中仍然缺乏。在本研究中,我们利用Wallace界面下的两种物种分布模型(SDM)工具——MaxEnt 和 BIOCLIM,对极危非洲白背兀鹫在Hwange生态系统中的气候适宜地理范围在当前、2050年和2070年气候情景下的响应进行了建模。
为实现这一目标,我们结合使用了19个动态生物气候变量、五个全球环流模型(GCMs)以及两种典型浓度路径(RCPs),以深入探讨气候变化对非洲白背兀鹫地理范围的潜在影响。同时,研究还整合了从6只非洲白背兀鹫个体收集的89,809条GPS定位数据,这些兀鹫均在Hwange国家公园及周边地区捕捉并安装追踪器。
基于AUC评估,模型表现优异,平均AUC值达到0.89。研究结果表明,在未来气候变化情景下,保护区的气候适宜性预计将保持稳定。此外,研究开发的模型显示,预计到2050年和2070年,非洲白背兀鹫将获得大量的气候适宜空间,并可能向人类主导的景观区域延伸。鉴于非洲白背兀鹫的极危保护状态,本研究的发现为指导当前及未来的保护干预提供了重要信息支持。
简明语言摘要
zh了解野生动物的气候适宜空间的潜在分布,对于制定有效的管理策略是至关重要的。但是,就非洲白背兀鹫(AWbV)等大多数兀鹫物种而言,尚缺乏此类信息。在本研究中,我们利用了两种方法,以探索在预计到2050年和2070年将发生的气候变化下,非洲白背兀鹫的适宜空间可能会如何受到影响。
为此,我们结合了包括温度和降雨在内的19个生物气候变量,以及其他方法,来评估气候变化对非洲白背兀鹫适宜栖息地的可能影响。同时,研究还整合了89,809条数据点,这些数据记录了研究期间不同时间段兀鹫的地理位置。这些兀鹫是在Hwange生态系统及其周边地区捕获并安装追踪器的,每只鸟的定位数据每15分钟更新一次。
研究结果显示,在预期的气候变化情景下,保护区预计能够维持适宜的气候条件。此外,研究结果还表明,到2050年和2070年,非洲白背兀鹫的适宜栖息地预计将进一步扩展,并可能向人类居住区延伸。本研究的发现为非洲白背兀鹫的当前和未来保护干预措施提供了重要的信息支持。
Plain Language Summary
en
-
Knowledge of the potential distribution of climatically suitable spaces for wildlife is important for developing effective management strategies. However, such information is often missing for many species, including the African White-backed Vulture (AWbVs), a Critically Endangered scavenger. In this study, we used two modelling methods to predict how suitable habitats for the AWbVs are likely to be impacted by climatic changes expected by 2050 and 2070. Using 19 bioclimatic variables, such as temperature and rainfall, along with GPS tracking data from 89,809 location points recorded every 15 mintus from six tagged vultures in the Hwange ecosystem and surrounding areas, we analysed the potential impacts of future climatic scenarios. Results show that protected areas are expected to maintain suitable climatic conditions under these scenarios. In addition, the models predict a significant expansion of suitable habitats for AWbVs by 2050 and 2070, extending towards human-dominated landscapes. These findings provide useful information that can be harnessed to guide current and future conservation interventions for this species.
Practitioner points
en
-
Protected areas in the Kavango Zambezi Transfrontier Conservation Area are expected to remain climatically suitable for the AWbVs under future climate change scenarios.
-
By 2050 and 2070, AWbVs are anticipated to gain additional suitable habitats, with these spaces expected to expand towards human-dominated landscapes.
-
Most countries in Southern Africa are predicted to offer climatically suitable conditions for AWbVs under future climate change scenarios.
实践者要点
zh
-
我们的研究结果表明,在未来气候变化情景下,卡万戈赞比西跨境保护区的各个保护区域预计将维持非洲白背兀鹫物种生存的气候适宜性。
-
重要的是,预计到2050年和2070年,非洲白背兀鹫将获得更多适宜栖息地,且这些空间预计将向人类统治区域扩展
-
在未来气候变化情景下,南非大多数国家预计将保持气候适宜性。
1 Introduction
Global climate change poses immense challenges to ecosystems and biodiversity conservation (Simmons and Jenkins 2007; Sutton et al. 2022). Projections suggest that the Earth is warming at an unprecedented rate, not seen in the last 40 million years (Simmons et al. 2004). Previous studies indicate that more species are expected to face range contractions of suitable habitats than those experiencing range expansions in the future (Araújo and Guisan 2006; Eustace et al. 2021; Cheng et al. 2023; Sutton et al. 2022). Understanding species-specific, climate-driven distributional shifts of suitable habitats is therefore a vital prerequisite for designing and implementing realistic and flexible conservation strategies (Sutton et al. 2022).
Sub-Saharan Africa is considered the most vulnerable to projected environmental changes, such as global warming and increased drought conditions, which are expected to have far-reaching consequences for ecosystems and landscapes (Simmons et al. 2004; Ogada et al. 2016; Simmons and Jenkins 2007; Phipps et al. 2017). While attention has been traditionally focused on how climate change affects human landscapes (Nhemachena et al. 2020; Thinda et al. 2020; Praveen and Sharma 2019; Fischer et al. 2005), it is becoming increasingly clear that wildlife species and their habitats are similarly under threat, heightening the risk of species extirpation (Sutton 2020; Román-Palacios and Wiens 2020; Mpakairi et al. 2020; Sáenz-Jiménez et al. 2021). Severe extinction risks are particularly evident for tropical species with narrower tolerance ranges, whose climatically suitable habitats are shifting or shrinking (Simmons et al. 2004; VanDerWal et al. 2013).
Among wildlife species, avian scavengers are perhaps some of the most vulnerable to environmental disturbances (Kendall et al. 2018; Margalida and Ogada 2018; Simmons et al. 2004). Previous studies have shown that climate change, working in concert with other environmental factors, can drastically alter avian scavenger habitats and prey availability, resulting in severe population declines (Simmons and Jenkins 2007; Román-Palacios and Wiens 2020). To address this challenge, there is need to develop ecological models that can provide insights into how current and future geographic and environmental spaces for threatened species might be impacted by environmental changes. Such information is important for guiding the design and implementation of effective strategies to monitor and preserve these species now and in the future (Hannah et al. 2007).
Previous studies have primarily focused on proximate threats to African vultures, including poisoning episodes, poaching, habitat loss (such as roosting and breeding sites), food shortages, and collisions with human infrastructure (Margalida and Ogada 2018; Santangeli et al. 2019; Ogada et al. 2022; Ogada et al. 2016; Safford et al. 2019; Kane et al. 2022). However, despite the IUCN identifying climate change as a major threat to numerous species, the potential impacts of projected climate change scenarios on the geographic ranges of avian scavengers such as the African White-backed Vulture (Gyps africanus), (hereafter AWbVs), remain largely under-explored (Phipps et al. 2017; Eustace et al. 2021). Like many other species, avian scavengers such as the AWbVs are not immune to the challenges posed by climate change, which may have unprecedented consequences for their persistence in ecosystems and their role in supporting human health (Simmons and Jenkins 2007).
The AWbV is a huge, long-lived obligate scavenger that is broadly distributed across selected African countries such as Zimbabwe, South Africa, Botswana, Namibian, Zambia, Kenya, Tanzania, Mozambique and some parts of Western Africa (Anderson 2004; Botha et al. 2017; Mundy et al. 1992). This species plays a vital role in ecosystems by providing a wide range of services, including removing carcasses from the environment, curbing the spread of infectious diseases by rapidly disposing of infected carrion, reducing greenhouse gas emissions from decaying carcasses, facilitating nutrient cycling, and supporting recreational and ecotourism activities (Henriques et al. 2020; Margalida and Ogada 2018; Van Den Heever et al. 2021). Classified as critically endangered (BirdLife International 2018), the conservation of the AWbVs is now a global priority (Safford et al. 2019; Santangeli et al. 2019; Bildstein 2022; Kane et al. 2022). However, one of the overarching challenges in prioritising vulture conservation is the lack of spatially explicit knowledge regarding their current geographic and environmental ranges and how these may be affected by projected climate change scenarios (Shrestha et al. 2021; Román-Palacios and Wiens 2020; Kane et al. 2022).
Over the last decade, species distribution modelling (SDM) has emerged as a powerful tool for addressing information gaps regarding the current and future distributional ranges of climatically suitable habitats (Booth 2018; Valavi et al. 2022; Sutton et al. 2021). SDM operates on the premise that suitable environmental conditions exist where species are currently found. By establishing a relationship between species occurrence data and the environmental variables in these locations, SDM allows for the prediction of geographically and environmentally suitable spaces for species across time and space (Phipps et al. 2017; Phillips and Dudík 2008; Booth 2018). This predictive capability is instrumental in updating current species distributional ranges and projecting their future distributions under various climate change scenarios (Sutton 2020; Elith and Leathwick 2009; Booth 2018; Kaky et al. 2020). In addition, SDM can guide research efforts and identify potential reintroduction sites for threatened species (Sutton 2020). In this regard, SDM is considered a critically important tool for developing management strategies that focus on climatically suitable environments where the target species are most likely to thrive (Kumar Jha and Jha 2020; Sutton 2020). When combined with very high-precision Global Positioning System (GPS) data, SDM can yield invaluable insights that support spatially explicit conservation interventions, such as species reintroduction, translocation programmes, and ecosystem restoration (Valavi et al. 2022; Phipps et al. 2017).
The primary aim of this study was to apply the MaxEnt and BIOCLIM SDMs to conduct the first assessment of how climatic constraints may influence the current and future geographic distribution of a sample of six AWbVs tracked within Zimbabwe's Hwange ecosystem. Specifically, it has four objectives:
First, we evaluate how current and projected climate scenarios for 2050 and 2070 may affect the geographical distribution of climatically suitable environments for the AWbVs. Second, we investigate the potential for range expansion, contraction, or shifts under these future climate scenarios and identify areas expected to remain climatically stable despite projected changes. Third, we assess whether these geographical shifts in suitable environments are concentrated within or outside the boundaries of gazetted protected areas, using the Transfrontier Conservation Areas (TFCA) network of Southern Africa as a framework to infer the relevance of protected areas under projected climate scenarios. Finally, we use climate envelope plots generated through the BIOCLIM model (Booth 2018) to demonstrate the extent of AWbVs tolerance ranges for relevant bioclimatic variables. Acquiring reliable information on potential range shifts, contractions, or expansions is fundamentally important for providing anticipatory conservation planning tools that can support effective wildlife management strategies (Hannah et al. 2007; Hannah 2011).
2 Materials and Methods
2.1 Study Area
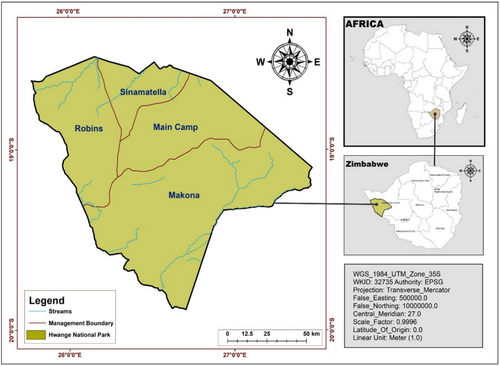
The study was conducted in Hwange National Park, located in western Zimbabwe, which forms part of the expansive Kavango–Zambezi Transfrontier Conservation Area (KAZA–TFCA; Figure 1). Hwange National Park is home to a diverse array of wildlife species, including African elephant (Africana loxodonta), lion (Panthera leo), buffalo (Syncareous caffer), greator kudu (Tragelaphus strepsiceros), impala (Aepyceros melampus), and zebra (Equus burchelli) (Mpakairi et al. 2020). These animals serve as the primary food source for vultures inhabiting the ecosystem (Mundy et al. 1992). The AWbVs, one of the prominent vulture species in the semi-arid Hwange ecosystem, is often given top priority in conservation interventions due to its rapidly declining population (Safford et al. 2019; Santangeli et al. 2019; Mundy et al. 1992).
2.2 Species Occurrence Data
Species occurrence data were systematically collected from six AWbVs, captured and fitted with third Generation, CTT 1000 Series BT3 GPS backpack tracking devices. Tracking was conducted from June 2016 to January 2018, yielding a total of 89,809 georeferenced occurrence data points. Detailed protocols for vulture capture, GPS tag specifications, and backpack tracking device deployment are provided in Zvidzai et al. (2020).
The GPS devices were programmed to record and transmit location data and associated variables for each bird at 15-min intervals. These intervals are considered representative of the species' unbiased movement within the environment. Consequently, no corrections for sampling bias were applied in this study.
The capture and tagging of vultures were conducted under the approval of the Zimbabwe Parks and Wildlife Management Authority, granted through Permit No. 23(1) (C) (II) 23/2016.
2.3 Bioclimatic Predictors
We sourced 19 dynamic bioclimatic predictors from WORLDCLIM (https://worldclim.org; Hijmans et al. 2005) to model the current, 2050, and 2070 geographic distributions of climatically suitable ranges for the AWbVs. These bioclimatic variables are widely used in SDM due to their high resolution, global coverage, and availability of both historical and future climate change scenarios (Hijmans et al. 2005; Phillips and Dudík 2008). The bioclimatic raster files at a spatial resolution of 2.5 arc min were processed using the user-defined study region (Booth 2018). This study focused exclusively on bioclimatic variables, as climate is considered the primary driver of species distribution at a landscape scale, especially in tropical environments (Sutton 2020; Phipps et al. 2017; Abolmaali, Tarkesh, and Bashari 2018). Dynamic bioclimatic variables were also used to project current species distribution models onto future time periods under different greenhouse gas emission scenarios.
In this study, we tested for multicollinearity using the Variance Inflation Factor (VIF) in R with the car package. Six bioclimatic variables with VIF values exceeding five were excluded from the model to minimise redundancy and ensure robust predictions (Table 1; Sutton et al. 2022).
| Code | Description of environmental variable | Unit |
|---|---|---|
| Bio1 | Annual mean temperature | °C |
| Bio2 | Annual mean diurnal range | °C |
| Bio3 | Isothermality (Bio2/Bio7) (*100) | J/K |
| Bio4 | Temperature seasonality (standard deviation *100) | CofV |
| Bio5 | Max temperature of warmest month | °C |
| Bio6 | Min temperature of coldest month | °C |
| Bio7 | Annual temperature range (Bio5-Bio6) | °C |
| Bio8 | Mean temperature of wettest quarter | °C |
| Bio9 | Mean temperature of driest quarter | °C |
| Bio10 | Mean temperature of warmest quarter | °C |
| Bio11 | Mean temperature of coldest quarter | °C |
| Bio12 | Annual precipitation | mm |
| Bio13 | Precipitation of wettest month | mm |
| Bio14 | Precipitation of driest month | mm |
| Bio15 | Precipitation seasonality (coefficient of variation) | — |
| Bio16 | Precipitation of wettest quarter | mm |
| Bio17 | Precipitation of driest quarter | mm |
| Bio18 | Precipitation of warmest quarter | mm |
| Bio19 | Precipitation of coldest quarter | mm |
- Note: Bioclimatic variables shaded in grey were not included in the model.
2.4 Modelling the Potential Distribution of Climatically Suitable Habitats for the AWbVs
In this study, we applied MaxEnt, a machine learning-based SDM approach, within the WALLACE environment to model the potential distribution of climatically suitable habitats for the AWbVs under different climate change scenarios (Kass et al. 2018, 2023; R Core Team 2022). We also used BIOCLIM, an envelope-based SDM method (Booth 2018), to assess the AWbVs' tolerance limits to ecologically relevant bioclimatic variables. BIOCLIM models bioclimatic limits on species occurrence data without assuming interactions among variables (Booth 2018). Using these two SDM tools allowed us to take advantage of their different but complementary capabilities in modelling geographic and environmental spaces for the AWbVs.
Previous studies have highlighted MaxEnt's superior performance compared to other present-only SDMs, its user-friendly interface, its ability to model presence-only data, as well as complex and nonlinear relationships, and its robustness with small datasets, making it popular for extensive application in biogeography and ecological studies (Phillips and Dudík 2008; Valavi et al. 2022; Elith and Leathwick 2009; Kaky et al. 2020). We used MaxEnt to draw comparisons between our findings and those from previous studies (Phipps et al. 2017; Phillips and Dudík 2008).
We used the default settings for MaxEnt and BIOCLIM, a common practice in species distribution modelling (Abolmaali, Tarkesh and Bashari 2018). The default 10,000 random points were chosen within the study area accessible to the tracked individuals as pseudo-absence background sampling points (Phillips and Dudík 2008). This sample size is widely adopted in literature and is considered sufficiently large to capture the full range of environmental conditions in the study area, resulting in high predictive accuracy (Elith and Leathwick 2009; Phillips, Anderson, and Schapire 2006; Kaky et al. 2020).
To test the predictive capacity of our models, we employed the ENMeval package within the Wallace environment, using k = 4 block cross-validation procedures for spatially partitioned species occurrence and background data (Kass et al. 2021). Models were trained on 70% of the data and tested on 30% (Phillips and Dudík 2008). This block method for data partitioning is especially recommended when transferring predictions to future climate scenarios (Sutton 2020). The MaxEnt model fitting was applied using the ENMeval, dismo, and MaxNet R packages (Kass et al. 2018; Hijmans et al. 2020; Kass et al. 2021; Phillips and Phillips 2021; R Core Team 2022). We applied linear, quadratic and hinge feature classes with default regularisation multipliers (Phillips and Dudík 2008). All possible combinations of the feature class settings were applied to control for model complexity and minimise overfitting (Valavi et al. 2022). We applied the regularisation functionality to enhance the predictive performance of models by penalising and shrinking regression coefficients, resulting in reduced variance of the regression model (Valavi et al. 2022). The clamping and parallel functionality with three cores were also turned on to facilitate projections to future and new time periods. The Akaike Information Criterion (AIC) was used to select the most parsimonious model (Sutton 2020). Environmental suitability was indexed using the cloglog function, where 0 indicates low suitability and 1 represents highly suitable. Percentage contributions were implemented to estimate the importance of bioclimatic variables in model calibration (Sutton et al. 2022).
The ENMeval package was further used to evaluate model predictive performance using the Area Under the Receiver Operation Curve (AUC; Kass et al. 2018; Valavi et al. 2022). AUC values range from 0 to 1, with 1 showing perfect discrimination, while values below 0.5 are considered worse than random discrimination (Valavi et al. 2022). For conservation planning purposes, an AUC value of more than 0.7 is deemed suitable (Sutton 2020).
Next, we then projected the current model under 2050 and 2070 climate scenarios using two Representative Concentration Pathways (RCPs), 4.5 and 8.5, which represent moderate and high greenhouse gas emission scenarios, respectively. RCP 4.5 represents lower emissions scenarios projected to stabilise at 650 ppm by 2100, while 8.5 represents the worst-case scenario with emissions projected to reach levels of up to 993 ppm by 2050 (Kaky et al. 2020). Worst-case scenarios, such as 8.5, are preferred for conservation planning as they prepare climate change managers for extreme outcomes (Beaumont, Hughes and Pitman 2008).
We integrated the two RCPs with five Global Circulation Models (GCMs) (Appendix A) from the Coupled Model Intercomparison Project (CMIP5) to evaluate how variations in GCMs can influence model projections for AWbVs geographic ranges (Shepherd et al. 2018). Five alternate climate models were applied in this study because previous studies have shown that no single best model exists, and thus, it is imperative for conservation managers to explore outputs from several alternate modelling scenarios to broaden their management options (Beaumont, Hughes, and Pitman 2008; Sillero and Barbosa 2021). After running the models, we classified the continuous suitability maps into three categories: most suitable (0.7–1), less suitable (0.1–0.6), and unsuitable (0). We used Arcgis 10.3 to quantify the most suitable, less suitable, and unsuitable habitats in km2 for each GCM and RCP under the current and future climate scenarios. This was to understand the extent of habitat expansion or contraction scenarios. We then calculated the percentage change in the most suitable habitats from the current model, comparing them against the different GCMs and RCPs for 2050 and 2070 future climate scenarios using the formula [((future − current)/current)*100] (Kaky et al. 2020).
A similarity index was used to estimate the consistency of suitable spaces across GCMs and RCPs for 2050 and 2070 climate scenarios (Warren, Glor, and Turelli 2010).
We then overlaid the AWbVs suitability maps with the boundaries of Southern Africa's transfrontier conservation areas to evaluate potential range shifts out of protected areas under projected climate change scenarios.
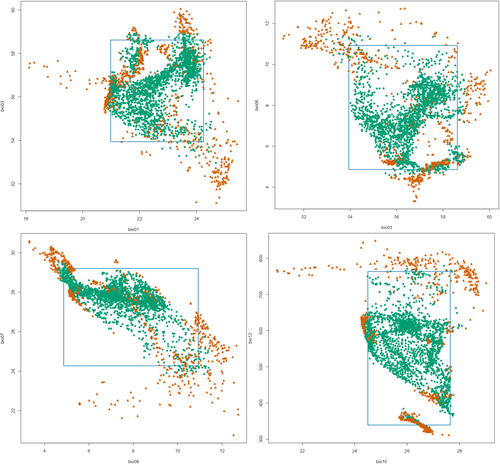
We also used the BIOCLIM model to estimate suitable environmental spaces for the AWbVs based on climate envelope plots (Booth et al. 2014). This was applied to determine AWbVs tolerance limits for selected bioclimatic variables (Booth 2018). This addresses gaps in understanding AWbVs climatic tolerance, as prior research has focused primarily on geographic range distribution (Zvidzai et al. 2020; Zvidzai et al. 2022; Kane et al. 2016; Phipps et al. 2013, Thompson et al. 2020; Reading et al. 2019).
3 Results
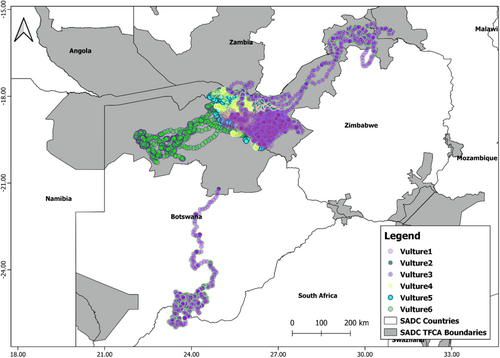
The models were constructed using thirteen uncorrelated bioclimatic variables and 89,809 georeferenced occurrence data points collected from six AWbVss. The tracked vultures exhibited a broad geographic range spanning six countries: Mozambique, Zambia, Zimbabwe, Namibia, Botswana and South Africa (Figure 2).
The predictive performance of the models was robust, with a high overall mean AUCTEST of 0.89, indicating that the MaxEnt model possessed strong statistical power to accurately predict the potential distribution of the climatically suitable space for the AWbVs.
Among the bioclimatic variables, annual mean temperature (bio1), isothermality (bio3), maximum temperature of warmest month (bio5), and precipitation of wettest month (bio13) contributed the most to the model.
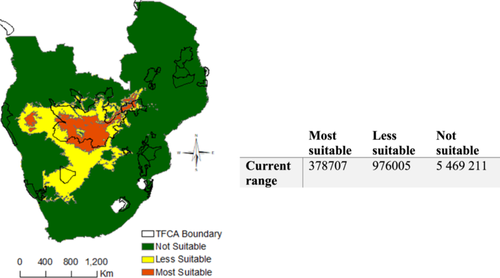
The current continuous distribution model predicts that most climatically suitable habitats for the AWbVs are concentrated within the KAZA region, which covers countries such as Zimbabwe, Botswana, Zambia, and Namibia (Figure 3). Less suitable ranges are predicted to expand beyond the KAZA region, mainly towards the southwest, encompassing parts of western South Africa. Notably, a significant proportion of these currently less suitable climatic habitats is projected to lie outside legally protected areas (Figure 3). The most suitable range is estimated to cover an area of 378,707 km2 (Figure 3).
While the current model presents a restricted climatically suitable geographic range for the AWbVs the scenario shifts considerably under the projected 2050 and 2070 climate models. Across all climate models and GHG emission scenarios, the climatically suitable habitats for the AWbVs are expected to expand substantially. By 2050 and 2070, the largest portion of Southern Africa is predicted to fall under the most suitable category. These expanded suitable spaces are projected to encompass countries such as South Africa, Botswana, Zimbabwe, Namibia, Zambia and Mozambique (Figure 4). Importantly, there is an indication that protected areas will remain climatically stable and continue to support suitable conditions for the AWbVs across all future climate scenarios (Figure 4).
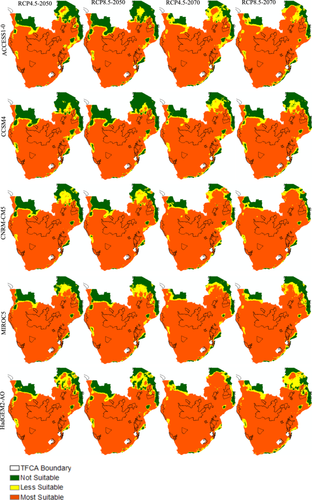
The projections indicate a multi-directional range expansion, with climatically suitable habitats extending into human-dominated landscapes. Most suitable habitats are predicted to become more contiguous, while isolated pockets of less suitable or unsuitable habitats are concentrated in the northern parts of Southern Africa across all GHG emission scenarios (Figure 4).
Suitability distribution maps (Figure 4) generated using MaxEnt reveal slight variations in the predicted suitable spaces across different climate models and GHG emission scenarios. The projections exhibit a high degree of similarity, with a similarity index exceeding 0.93, highlighting the robustness of the model outputs across various scenarios.
When compared to the current predicted range, our results suggest that all future climate scenarios are expected to result in massive expansions of climatically suitable habitats. The HadGEM2-AO-2070-4.5 model predicted the highest percentage increase, at 1487%, while the CCSM4-2050-4.5 model projected the smallest percentage increase, at 1229% (Table 2). None of the models predicted any loss in climatically suitable space for the AWbW. For 2050, the mean percentage gain in suitable habitat under the lower-emission 4.5 scenario across all GCMs is projected to be 1300%, slightly decreasing to 1287% for the high-emission, worst-case RCP 8.5 scenario. For 2070, the mean percentage gain under RCP 4.5 is estimated at 1399%, with a marginal decrease to 1378% under RCP 8.5. Thus, for both the 2050 and 2070 climate scenarios, results suggest that the mean percentage gain under the worst-case scenario is slightly lower compared to the lower-emission scenario (Table 2).
| Potential range change (km2) under the RCP4.5—2050 | Percentage increase (%) | Potential range change (km2) under the RCP8.5—2050 | Percentage increase (%) | Potential range change (km2) under the RCP4.5—2070 | Percentage increase (%) | Potential range change (km2) under the RCP8.5—2070 | Percentage increase (%) | |
|---|---|---|---|---|---|---|---|---|
| ACCESS1-0 | 5234347 | 1282 | 5086533 | 1243 | 5411307 | 1329 | 5655346 | 1393 |
| CCSM4 | 5034331 | 1229 | 5120031 | 1252 | 5372930 | 1319 | 5336503 | 1309 |
| CNRM-CM5 | 5318847 | 1304 | 5421578 | 1332 | 5808437 | 1434 | 5890180 | 1455 |
| MIROC5 | 5502223 | 1353 | 5340413 | 1310 | 5780218 | 1426 | 5652950 | 1393 |
| HadGEM2-AO | 5416500 | 1330 | 5298497 | 1299 | 6011390 | 1487 | 5445802 | 1338 |
Climatic tolerance ranges for the AWbVs indicate a narrow tolerance for bio3, ranging from 54 to 59 J/K. while for bio1, it can tolerate temperatures between 21°C and 24°C. For bio10, the range extends between 25°C and 28°C, and for bio12, it exhibits an equally narrow tolerance, spanning 350–750 mm (Figure 5).
4 Discussion
Understanding the current and future potential distribution of climatically suitable habitats for endangered species is crucial for developing realistic and targeted conservation strategies (Sutton 2020). Although perfect knowledge of present and potential future geographic ranges is unattainable, applying SDM tools provides useful baseline information to guide ecosystem restoration, population viability assessments, and species reintroduction and translocation programmes (Hannah et al. 2007; Kaky et al. 2020; Phipps et al. 2017). To our knowledge, this study represents one of the first assessments of the potential impacts of climate change scenarios on the spatial and temporal distribution of climatically suitable habitats for the AWbVs.
The predicted distribution models developed in this study show that the current climatically suitable geographic ranges for the AWbVs are largely confined to protected areas within the KAZA region, a known stronghold for the species (Botha et al. 2017; Anderson 2004). This suggests that protected areas are indeed safe havens for the AWbVs (Shrestha et al. 2021; Phipps et al. 2017). Previous studies have shown that AWbVs populations tend to persist in protected areas that offer climatically suitable habitats for foraging, breeding, and roosting (Virani et al. 2010; Buechley et al. 2022; Zvidzai et al. 2022; Kendall et al. 2018). These findings reaffirm the importance of protected territories as biodiversity strongholds that warrant substantial investment in conservation resources to ensure they continue fulfilling their conservation mandate (Shrestha et al. 2021; Buechley et al. 2022).
Projected climate scenarios for 2050 and 2070 suggest that the legally protected areas assessed in this study are expected to remain stable and maintain their climatic suitability, thereby serving as refugia for critically endangered AWbVs. However, due to their spatially fixed and static boundaries, these protected areas may not be sufficient to provide effective protection for critically endangered species such as the AWbVs, whose ranges are projected to expand considerably under future climate scenarios (Eustace et al. 2021; Buechley et al. 2022). This finding contrasts with previous studies that predicted a reduction in the proportion of protected area space expected to remain climatically suitable under projected climate change scenarios (Phipps et al. 2017; Hannah et al. 2007).
The predicted massive expansion of climatically suitable ranges into a mosaic of human-dominated landscapes, as indicated by all model scenarios in this study, contrasts with earlier studies that have projected potential contractions in the suitable geographic ranges of many species due to climate changes (Sutton 2020; Simmons et al. 2004; VanDerWal et al. 2013; Phipps et al. 2017; Shrestha et al. 2021). Although AWbVs face serious threats, the predicted expansion of suitable geographic spaces offers a positive outlook for wildlife managers. This suggests that, under the scenarios explored in this study, the AWbVs could emerge as one of the species that is expected to benefit under future climate change scenarios (Hannah et al. 2007).
However, caution is warranted when interpreting these findings. The exclusive use of bioclimatic variables in model fitting may oversimplify the complex ecological interactions that influence species distributions (Sutton 2020). While bioclimatic factors provide a useful framework for predicting broad patterns, they cannot fully capture the interplay of habitat characteristics, ecological dynamics, and anthropogenic influences.
Bioclimatic variables such as annual mean temperature, isothermality, maximum temperature of warmest month, and precipitation of wettest month emerged as the most important predictors in the models in this study. Temperature and other temperature-derived variables are particularly influential in the movement ecology of large avian species, including African vultures (Campbell 2015; Harel, Horvitz, and Nathan 2016). Previous studies have shown that as large, soaring birds with wide ranges, AWbVs rely heavily on favourable meteorological conditions, such as high temperature, thermal uplift, and convective energy, to locate the unpredictable food resources in the form of carrion (Dodge et al. 2014; Duerr et al. 2015; Safi et al. 2013; Harel, Horvitz, and Nathan 2016).
Moreover, future climate scenarios for the South predict lower rainfall levels, which could support the expansion of suitable habitats for the AWbVs. High rainfall has been shown to negatively impact flight efficiency, foraging success, and breeding outcomes of vulture species (Simmons and Jenkins 2007; Harel, Horvitz, and Nathan 2016). This is corroborated by previous studies that have observed an inverse relationship between vulture breeding success and the amount of rainfall (Virani et al. 2010; Virani et al. 2012).
Assuming that vultures in this study track climatically suitable habitats, this could lead to an escalation in human-wildlife conflicts, presenting new local conservation challenges, though potential ecosystem benefits may also emerge (Henriques et al. 2018). Conservation challenges may arise because human-dominated landscapes are often viewed as incompatible with biodiversity conservation objectives (Buechley et al. 2022). For example, as AWbVs shift into these landscapes to follow climatically suitable spaces, they may be vulnerable to several threats, including poisoning, poaching, scarcity of food, and a lack of suitable roosting and nesting habitats (Ogada, Keesing, and Virani 2012).
However, the expansion of suitable ranges may also create opportunities for coexistence and mutualistic relationships between vultures and humans (Henriques et al. 2018). Vultures may provide essential ecosystem services that enhance human well-being, such as waste disposal, nutrient cycling, greenhouse gas reduction, and regulating the potential spread of diseases (Margalida and Ogada 2018; Santangeli et al. 2019; Buechley et al. 2022).
Some studies have shown that organisms forced out of their current habitats may not necessarily become immediately threatened by new environments (Simmons et al. 2004; Margalida and Ogada 2018). Instead, certain species may quickly adapt and establish viable populations in new settings (Simmons and Jenkins 2007). For example, research on priority conservation areas for vultures, such as the Hooded Vulture (Necrosyrtes monachus), has shown that significant proportions of their habitat lie outside formally protected areas. This suggests that some vulture species may indeed adapt and thrive in human-dominated landscapes (Buechley et al. 2022; Henriques et al. 2018).
Although other studies have demonstrated poleward shifts in climatically suitable habitats for various bird species, including some African vulture species (Simmons et al. 2004; Phipps et al. 2017; Sutton 2020; VanDerWal et al. 2013), the results of this study suggest a contrasting trend. Here, we observed a multi-directional expansion of suitable climate spaces for AWbVs under future climate scenarios. This predicted expansion encompasses countries such as Zimbabwe, Botswana, South Africa, Namibia, Zambia, and Mozambique, which are already recognised as established strongholds for the AWbVs populations (Mundy et al. 1992).
Previous analyses, projecting poleward shifts in species' suitable ranges were mainly based on global temperature metrics, which are closely linked to elevation and latitude (VanDerWal et al. 2013). In contrast, this study used interactions between temperature, precipitation, and other derived bioclimatic variables, which have often been overlooked in previous studies. This methodological difference could possibly explain the contrasting results. The findings of this study are corroborated by Sutton (2020), who observed that within the tropics, climate change may not necessarily drive poleward geographic range shifts but instead result in multi-directional range shifts of suitable habitats (VanDerWal et al. 2013).
Climatically suitable distribution models based on different GCMs and RCP scenarios show a high similarity index (> 93), which is also visibly evident (Figure 4). The high degree of similarity across climate change scenarios suggests the relative stability of the MaxEnt model, a result consistent with findings from other studies (Kaky et al. 2020; Valavi et al. 2022). This consistency underscores the reliability of the MaxEnt model for guiding the design and implementation of wildlife management strategies relevant to both current and future climate trajectories.
Although climate is often considered the primary constraint on the distribution of many species at a landscape scale, we acknowledge the limitations of this assumption. As such, there are good grounds for future studies to integrate the effects of bioclimatic variables with other environmental factors, such as the availability and distribution of carrion, to enhance the accuracy of SDM tools. While this study suggests a potential expansion of climatically suitable habitats for the AWbVs, these findings should be interpreted with caution. The study is based on a relatively small sample size (n = 6) from a limited geographical region, which may restrict the generalisability of the results. Future research could benefit from using a larger sample size from a broader geographic scale to develop more robust species distribution models. Nevertheless, this study provides valuable initial insights into the potential impacts of climate change on the geographic distribution of the critically endangered AWbVs. These findings can serve as a baseline for improving the current and future conservation status of this species.
Author Contributions
Mark Zvidzai: conceptualisation, fieldwork activities, methodology, software, formal data analysis, writing the original manuscript, reviewing manuscript, software, validation, visualisation, data curation. Fadzai M. Zengeya: conceptualisation, supervision, data analysis reviewing the manuscript, visualisation, validation. Mhosisi Masocha: conceptualisation, supervision reviewing manuscript, visualisation, validation. Amon Murwira: conceptualisation, supervision funding acquisition, resources, reviewing of manuscript. Paradzayi Tagwireyi: conceptualisation, fieldwork activities, reviewing and editing the article, visualisation.
Acknowledgements
We thank the University of Zimbabwe for funding this research through purchasing tags used in the study and supporting all fieldwork activities. We also thank the Director General for Zimbabwe Parks and Wildlife Management Authority for giving us permission to conduct the research in their premises.
Conflicts of Interest
The authors declare no conflicts of interest.
Appendix A: The five GCMs from CMIP5 used for predicting 2050 and 2070 potential geographic distribution of the African White-backed Vulture
| Acronym | GCM |
|---|---|
| ACCESS1-0 | Australian Community Climate and Earth-System Simulator, version 1.0 |
| CCSM4 | Community Climate System Model, version 4 |
| CNRM-CM5 | Centre National de Recherches Meteorologiques Coupled Global Climate Model, version 5 |
| HadGEM2-AO | Hadley Centre Global Environment Model, version 2–Atmosphere and Ocean |
| MIROC5 | Model for Interdisciplinary Research on Climate, version 5 |
Open Research
Data Availability Statement
The data used in this study are for a critically endangered species and thus cannot be publicly shared.


