Establishment of Reference Intervals for Serum Uric Acid Among Adults in China
Funding: This study was supported by the National Key Research and Development Program (Grant/Award Number: 2022YFC2009600).
ABSTRACT
Background
The reference interval (RI) for serum uric acid (SUA) is a critical parameter for clinical diagnosis. However, systematic studies reflecting SUA levels across different regions in China are lacking. We aim to establish reference intervals for SUA using samples from multiple centers across China.
Methods
This cross-sectional study collected serum samples from 9314 healthy individuals across 6 regions in China (Shenyang, Yinchuan, Chengdu, Hangzhou, Changsha, and Nanning) between June and December 2020. The samples were analyzed using standardized methods, and non-parametric statistics were applied to assess differences in SUA levels.
Results
The analysis revealed significant sex-based differences in SUA levels. The mean SUA level was 345.3 μmol/L in men and 276.9 μmol/L in women. The RI for men was 215.5–494.3 μmol/L, while that for women was 180.3–425.7 μmol/L. When stratified by sex and age, the RI for men aged 18–29 years was 226.4–508.9 μmol/L, and that for men aged 30–100 years was 213.4–485.1 μmol/L. For women, the RIs were 184.1–430.4 μmol/L (18–29 years), 176.5–414.1 μmol/L (30–49 years), 183.2–422.1 μmol/L (50–59 years), 185.8–429.2 μmol/L (60–79 years), and 194.5–478.6 μmol/L (80–100 years). Regional analysis also showed significant variation in SUA levels: the RI was 194.9–496.2 μmol/L in Shenyang, 192.5–447.8 μmol/L in Changsha, and 187.1–468.3 μmol/L for the combined regions of Nanning, Hangzhou, Chengdu, and Yinchuan.
Conclusion
We successfully established RIs for SUA across different age groups, sexes, and geographic regions in China.
Abbreviations
-
- ISO
-
- International Organization for Standardization
-
- RI
-
- reference interval
-
- SUA
-
- serum uric acid
-
- UA
-
- uric acid
1 Introduction
The reference interval (RI), commonly referred to as the reference range, denotes the span within which 95% of measurements from a healthy population are expected to fall. This interval is determined using standardized methods and instruments specific to each testing parameter [1]. The International Organization for Standardization (ISO) 15189 accreditation standards for clinical laboratories recommend that each laboratory establish its own RI to ensure the accuracy and reliability of test results [2]. Accurate establishment of the RI is crucial for clinical diagnosis [3]. Currently, there are two primary methods for determining the RI: the direct detection method and the indirect detection method. The direct detection method involves selecting samples from qualified healthy individuals based on stringent inclusion and exclusion criteria, conducting tests, and then establishing the RI. However, this method requires considerable time and resources and is relatively complex to implement [4]. By contrast, the indirect detection method utilizes accumulated data from clinical testing to establish the RI through data screening, cleaning, and appropriate statistical analysis [5]. Nevertheless, the EP28-A3 document continues to recommend that laboratories prioritize the direct detection method for establishing target RI [4, 6].
Serum uric acid (SUA) is the end product of purine metabolism and exhibits both oxidative and antioxidative effects, with its function contingent upon the specific chemical microenvironment [7]. Oxidative stress caused by uric acid metabolism is closely associated with various diseases, including cardiovascular diseases, renal disorders, and metabolic disorders [8]. Patients with obesity, gout, and metabolic syndrome often exhibit abnormalities in UA metabolism. Recent studies indicate that both elevated and decreased SUA levels are associated with increased risks to organs such as the heart and kidneys, showing a U-shaped relationship with all-cause mortality in patients [9]. Therefore, accurately determining whether SUA levels are within the normal range is critical for disease management. SUA levels in patients with gout are typically elevated compared with normal values. It is generally accepted that a SUA level of ≥ 7 mg/dL is indicative of hyperuricemia [10]. Currently, some experts contend that the existing SUA RI lacks sufficient accuracy, which may lead to misdiagnosis. Consequently, they recommend the establishment of a new RI [11]. Accurate assessment of SUA levels is essential for the diagnosis and treatment of gout. Research indicates that some patients experience poor treatment outcomes and worse prognoses because of failure to accurately evaluate SUA levels [12]. Significant differences in UA metabolism exist between sexes and across age groups, rendering the use of a uniform RI for disease diagnosis and treatment inappropriate. Research has shown that the average SUA levels among populations in Eastern, Western, and Central China are not consistent [13].
Therefore, establishing SUA RIs based on sex, age, and regional populations is essential for accurately reflecting SUA levels. However, there is currently a lack of systematic research and corresponding RIs for various regional populations in China. In this study, we collected representative samples from regions including Northeast China (Shenyang), Northwest China (Yinchuan), Southwest China (Chengdu), East China (Hangzhou), Central China (Changsha), and South China (Nanning) to establish RIs that reflect the diversity of SUA levels across the country.
2 Materials and Methods
2.1 Study Population
This study was a cross-sectional investigation with sample collection conducted from June to December 2020. The participants comprised patients aged 18–100 years who underwent health check-ups at large comprehensive tertiary hospitals across various regions of China, specifically Shenyang, Changsha, Yinchuan, Chengdu, Hangzhou, and Nanning. The participating hospitals were the People's Hospital of Liaoning Province (Shenyang), the General Hospital of Ningxia Medical University (Yinchuan), the Hospital of Chengdu University of Traditional Chinese Medicine (Chengdu), the First Affiliated Hospital of Guangxi University of Chinese Medicine (Nanning), the Hangzhou First People's Hospital (Hangzhou), and the Second Xiangya Hospital of Central South University (Changsha). The inclusion criteria were patients who underwent routine health examinations at the aforementioned hospitals and were found to have normal clinical diagnoses and physical examination results, thus qualifying as an apparently healthy population, and patients who had resided in the respective cities for > 1 year. The exclusion criteria were a history of coronary heart disease, kidney disease, liver disease, diabetes, hypertension, or hereditary metabolic disorders; surgery within the last 6 months; pregnant women or those within 1 year postpartum; use of any medication within 2 weeks prior to the health check-up; a body mass index of ≥ 28.0 or < 18.5 kg/m2; and a clinical diagnosis of hyperuricemia. The sample population in this cohort was primarily sourced from the multicenter study conducted for the initial RIs cohort [14]. Building on the work of Fan et al. [14], the present study extends the RIs to additional substances. In accordance with a multi-institutional cooperation agreement, the lead institution, Beijing Anzhen Hospital, is authorized to utilize this sample batch for testing other substances. This study received approval from the Ethics Committee of Beijing Anzhen Hospital, Capital Medical University (2025100X). Due to the fact that the samples in this study were obtained from residual clinical testing, informed consent from patients was waived as per the requirements of the ethics committee of Beijing Anzhen Hospital, Capital Medical University.
2.2 Sample Collection
All patients were required to fast for at least 8 h prior to blood collection and to sit quietly for 15 min beforehand. Blood samples were centrifuged within 30 min at 2980 × g for 10 min. The samples were then promptly divided into 1.2-mL aliquots to allow multiple future analyses and to minimize repeated freeze–thaw cycles that could compromise sample integrity. The aliquots were stored in a −80°C freezer. To reduce variability due to different reagents and instruments across regions, all samples were sent to the Department of Laboratory Medicine at Beijing Anzhen Hospital for uniform analysis.
2.3 Measurement
The detection instrument used in this study was the Mindray biochemical analyzer (BS-2800M; Mindray, Shenzhen, China). SUA levels were measured using the uricase-peroxidase method (Lot 141223018; Mindray). The accompanying reagents included CD80 washing solution (Lot 196122035), acidic cleaning solution A (Lot 196224004), and alkaline cleaning solution B (Lot 196324003), all from Mindray. On the day of testing, two levels of quality control materials (high and low) were used to calibrate the instrument, ensuring operation within the normal parameter range. The linear range specified by the reagent manufacturer was 20.0–1500 μmol/L. The coefficient of variation for within-batch precision was ≤ 3.0%, and that for between-batch precision was ≤ 6.0%. During sample testing, we strictly adhered to standardized internal quality control protocols, confirming that all quality control results met the required standards before initiating sample analysis. The measured coefficients of variation for high and low values were 2.57% and 2.70%, respectively—both within the acceptable quality range.
2.4 Overall Strategy
To establish reliable RIs for SUA with clinical significance, we acknowledged that factors such as age, sex, and geographic region may influence SUA levels. Accordingly, we conducted stratified analyses—specifically by sex, age, and region—as a preliminary investigation into the impact of these factors on SUA levels.
2.5 Outlier Processing
To ensure the validity of the research methods and the robustness of the results, we employed both the Tukey method and the Z-score method for outlier detection and conducted a comparative analysis of their outcomes. The Tukey method uses quartiles (Q1 and Q3) and the interquartile range (IQR), defining outlier thresholds as Q1 − 1.5 × IQR and Q3 + 1.5 × IQR, with data points falling outside this range classified as outliers. By contrast, the Z-score method identifies outliers by calculating the Z-scores of data points, typically designating those with |Z| > 3 as outliers.
2.6 Statistical Analysis
For data analysis, we utilized R software (version 4.2.2) along with relevant R packages, and GraphPad Prism (version 9.0) for data processing and statistical analysis. The Kolmogorov–Smirnov test was applied to assess the normality of the data. For non-normally distributed data, we used the median (Q1, Q3) for descriptive analysis and the Wilcoxon signed-rank test to compare the two groups. The Kruskal–Wallis H test was used to compare multiple groups, followed by Dunn's post hoc test to further analyze group differences.
We performed Box–Cox transformations on non-normally distributed data. To describe the distribution of SUA, we applied the Box–Cox t distribution from the Generalized Additive Model for Location, Scale, and Shape [15]. SUA was treated as the dependent variable with age as the independent variable, and age was smoothed to ensure flexibility in the model. The criterion for statistical significance was set at p < 0.05.
3 Results
3.1 Detection Process and Sample Information
To clearly present the study design, we constructed a flowchart of the research process (Figure 1a). This study included samples from six regions—Shenyang, Changsha, Yinchuan, Chengdu, Hangzhou, and Nanning—totaling 9405 cases. We applied both the Z-score method and Tukey's method to identify outliers. The Z-score method identified 48 outliers, while Tukey's method detected 91. Notably, all 48 outliers identified using the Z-score method were also included among 91 detected using Tukey's method (Figure 1b). To ensure rigor in our analysis, we ultimately adopted Tukey's method. Figure 1c illustrates the distribution of the SUA for the 91 outliers identified. After removing these outliers, the final analysis included 9314 samples (Table 1).
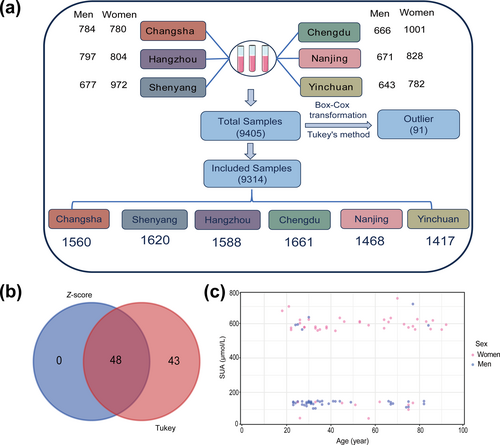
Research flowchart and outlier removal. (a) Flowchart of the research process. (b) Outliers identified using the Z-score method and Tukey's method. (c) Distribution characteristics of SUA in the 91 outlier samples along with corresponding patient information. SUA, serum uric acid.
| Ages | No. of samples | Men | Women | ||||||||||
|---|---|---|---|---|---|---|---|---|---|---|---|---|---|
| Chang-sha | Shen-yang | Yin-chuan | Cheng-du | Hang-zhou | Nan-ning | Chang-sha | Shen-yang | Yin-chuan | Cheng-du | Hang-zhou | Nan-ning | ||
| 18–29 | 1890 | 122 | 110 | 111 | 127 | 116 | 257 | 142 | 109 | 88 | 253 | 143 | 312 |
| 30–39 | 2272 | 136 | 114 | 150 | 173 | 179 | 173 | 173 | 229 | 218 | 318 | 182 | 227 |
| 40–49 | 1350 | 111 | 76 | 101 | 70 | 102 | 85 | 122 | 215 | 154 | 133 | 96 | 85 |
| 50–59 | 1081 | 102 | 87 | 76 | 89 | 98 | 73 | 90 | 121 | 82 | 88 | 83 | 92 |
| 60–69 | 1182 | 114 | 100 | 97 | 89 | 96 | 66 | 122 | 116 | 113 | 97 | 99 | 73 |
| 70–79 | 845 | 109 | 72 | 73 | 41 | 115 | 7 | 77 | 98 | 87 | 58 | 93 | 15 |
| 80–100 | 694 | 87 | 96 | 32 | 73 | 85 | 2 | 53 | 77 | 35 | 52 | 101 | 1 |
| Total | 9314 | 781 | 655 | 640 | 662 | 791 | 663 | 779 | 965 | 777 | 999 | 797 | 805 |
3.2 Data Normality Analysis
Although we applied the Box–Cox transformation using the optimal lambda, which improved the kurtosis and skewness of the data to some extent (Figure 2), the transformed data still did not conform to a normal distribution. Therefore, we ultimately adopted non-parametric testing methods for the subsequent analysis.
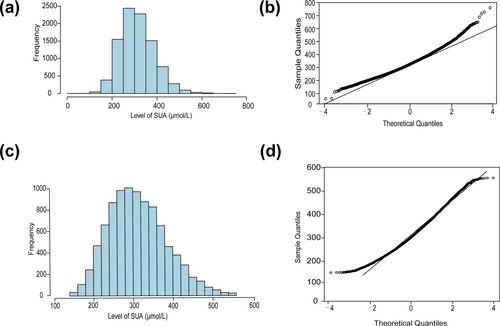
Comparison of data before and after Box–Cox transformation. (a) Histogram of SUA data before transformation. (b) Q-Q plot of SUA data before transformation. (c) Histogram of SUA data after transformation. (d) Q-Q plot of SUA data after transformation. SUA, serum uric acid.
3.3 Relationship Between SUA Levels, Age, and Sex in China
To gain a deeper understanding of the relationship between SUA levels, age, and sex in the Chinese population, we employed generalized additive models to fit the data. The optimal degrees of freedom were selected using the Akaike Information Criterion to ensure that the model adequately captured the nonlinear relationships present in the data. To visually present the model fitting results, we plotted a residual graph (Figure 3a), which demonstrated good model fit. As a result, we selected a degree of freedom of 7 for subsequent data fitting. Figure 3b illustrates the percentile curves of SUA levels computed using the beta-counted Tweedie distribution. The results showed that SUA levels in both men and women increased with age, with levels in men consistently higher than those in women, and a more pronounced increase was observed after 50 years of age. This suggests that both sex and age are significant factors influencing SUA levels. To further explore variations in SUA levels across different regional populations, we conducted similar analyses using regional data (Figure 3c). The specific process for selecting degrees of freedom is detailed in Supporting Information: Table S1.
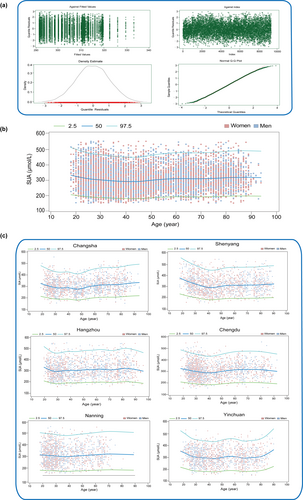
Distribution characteristics of SUA based on the generalized additive model. (a) Residual Diagnostic evaluation plots of the GAMLSS mode (b) Distribution characteristics of SUA in the Chinese adult population. (c) Distribution characteristics of SUA among adults in different regions. SUA, serum uric acid.
3.4 Establishment of SUA RI by Sex
We grouped the data by sex and analyzed the distribution of SUA levels. As shown in Figure 4, the mean SUA level in men (345.3 μmol/L) was significantly higher than that in women (276.9 μmol/L). We further analyzed the SUA RI for each sex using non-parametric testing methods. Significant differences in the RI were observed between the sexes. The RI for women (P2.5–P97.5) was 180.3–425.7 μmol/L, whereas that for men was 215.5–494.3 μmol/L. At the median level, the SUA levels in men were significantly higher than those in women (Table 2).
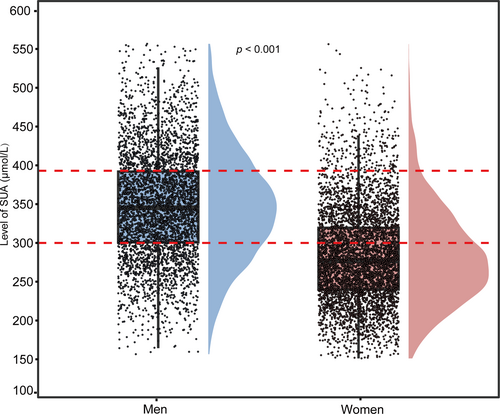
Comparison of SUA distribution between men and women. The two red lines represent the SUA levels in the men group at the first quartile (Q1) and third quartile (Q3), respectively, serving as reference lines for comparing the two groups. SUA, serum uric acid.
| Sex | No. of samples | Median | Percentile | Reference intervals | ||
|---|---|---|---|---|---|---|
| 25% | 75% | P2.5 | P97.5 | |||
| Women | 5122 | 276.9 | 240.0 | 319.6 | 180.3 | 425.7 |
| Men | 4192 | 345.3 | 300.8 | 392.0 | 215.5 | 494.3 |
- Abbreviation: SUA, serum uric acid.
3.5 Establishment of RI by Age
We categorized the 9314 samples into age groups based on 10-year intervals: 18–29, 30–39, 40–49, 50–59, 60–69, 70–79, and 80–100 years. According to the boxplot (Figure 5), differences in the distribution of SUA levels were observed among these age groups. Significant differences were noted between certain intervals (e.g., 18–29 vs. 30–39 and 40–49 vs. 50–59, p < 0.001), while differences between 50–59 and 60–69 (p = 0.050) and between 60–69 and 70–79 (p = 0.927) were not significant. Based on these findings, we adopted an age-stratified approach to establish the SUA RI using non-parametric methods. Age groups with significant differences were assigned a separate RI, whereas those without significant differences were combined to form a unified RI. Specific information is presented in. There were notable differences in the RI and median SUA levels across the various age groups. The median SUA for the 18–29 group was 310.3 μmol/L, with an RI of 191.3–486.0 μmol/L. In the 30–39 group, the median slightly decreased to 299.2 μmol/L, with an RI of 183.7–466.9 μmol/L. The 40–49 group showed a further decline, with a median of 290.3 μmol/L and an RI of 181.7–452.9 μmol/L, indicating a gradual downward trend. Because there were no significant differences in SUA levels among the 50–59, 60–69, and 70–79 groups, these were combined, yielding a unified RI of 191.1–468.6 μmol/L. Finally, the median SUA for the 80–100 group was 322.0 μmol/L, with an RI of 201.7–484.8 μmol/L (Table 3).
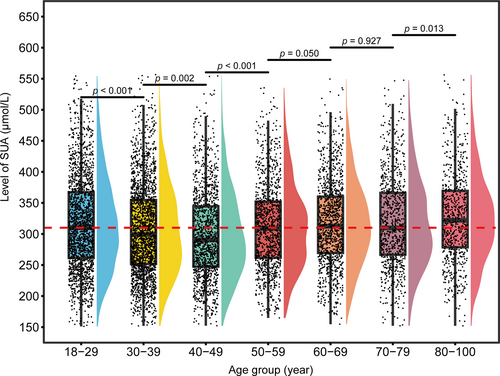
Comparison of SUA distribution across different age groups. The red line represents the median SUA level in the 18–29 age group, serving as a reference line. SUA, serum uric acid.
| Age groups | No. of samples | Median | Percentile | Reference intervals | ||
|---|---|---|---|---|---|---|
| 25% | 75% | P2.5 | P97.5 | |||
| 18–29 | 1890 | 310.3 | 261.3 | 367.3 | 191.3 | 486.0 |
| 30–39 | 2272 | 299.2 | 251.7 | 354.8 | 183.7 | 466.9 |
| 40–49 | 1350 | 290.3 | 247.2 | 344.5 | 181.7 | 452.9 |
| 50–59 | 1081 | 308.9 | 261.5 | 352.3 | 191.1 | 468.6 |
| 60–69 | 1182 | 312.4 | 269.4 | 360.4 | 191.1 | 468.6 |
| 70–79 | 845 | 309.7 | 266.5 | 366.3 | 191.1 | 468.6 |
| 80–100 | 694 | 322.0 | 278.2 | 369.4 | 201.7 | 484.8 |
- Abbreviation: SUA, serum uric acid.
3.6 Establishment of RI Across Different Age Groups for Both Men and Women
Through the analysis presented above, we identified differences in SUA RIs across sexes and age groups. Consequently, we further examined the SUA RI for both men and women across different age categories. As illustrated in Figure 6a, SUA levels in men aged 18–29 were slightly higher than those in other age groups. However, from age 30 onward, SUA levels remained relatively stable across all age categories. Therefore, we established a unified RI for the population aged 30–100 years. The analysis revealed that the SUA RI for men aged 18–29 was 226.4–508.9 μmol/L, while the RI for those aged 30–100 was 213.4–485.1 μmol/L (Table 4).
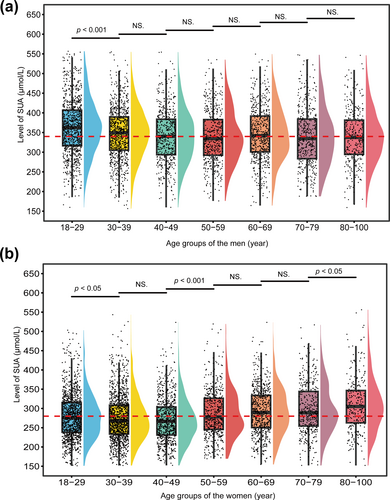
Comparison of SUA levels across different age groups within the same sex. (a) SUA levels among different age groups of men. (b) SUA levels among different age groups of women. In figure (a), the red line represents the median SUA level in the 40–49 age group, serving as a reference line. In figure (b), the red line represents the median SUA level in the 50–59 age group, serving as a reference line. SUA, serum uric acid.
| Age groups | No. of samples | Median | Percentile | Reference intervals | ||
|---|---|---|---|---|---|---|
| 25% | 75% | P2.5 | P97.5 | |||
| 18–29 | 982 | 362.3 | 316.4 | 406.9 | 226.4 | 508.9 |
| 30–39 | 851 | 348.2 | 305.1 | 389.9 | 213.4 | 485.1 |
| 40–49 | 540 | 341.4 | 293.5 | 383.8 | 213.4 | 485.1 |
| 50–59 | 490 | 339.3 | 292.1 | 383.1 | 213.4 | 485.1 |
| 60–69 | 570 | 345.4 | 300.7 | 391.9 | 213.4 | 485.1 |
| 70–79 | 426 | 339.2 | 283.3 | 384.5 | 213.4 | 485.1 |
| 80–100 | 333 | 339.3 | 294.0 | 381.6 | 213.4 | 485.1 |
- Abbreviation: SUA, serum uric acid.
For women (Figure 6b), the overall SUA levels were lower than those of men. A comparison across age groups revealed significant differences in the SUA distribution for the 18–29, 50–59, and 80–100 age groups compared with others. Based on these findings, we established corresponding RIs. Specifically, the SUA RI for women aged 18–29 was 184.1–430.4 μmol/L; for those aged 30–49, the RI was slightly lower at 176.5–414.1 μmol/L; and for the 50–59 age group, the RI was nearly equivalent to that of the 18–29 group, at 183.2–422.1 μmol/L. Because there was no significant difference in the SUA distribution between the 60–69 and 70–79 groups, these were combined to establish a unified RI of 185.8–429.2 μmol/L. Finally, the SUA levels in the 80–100 age group were overall higher, with an RI of 194.5–478.6 μmol/L (Table 5).
| Age groups | No. of samples | Median | Percentile | Reference intervals | ||
|---|---|---|---|---|---|---|
| 25% | 75% | P2.5 | P97.5 | |||
| 18–29 | 1200 | 280.4 | 238.2 | 315.3 | 184.1 | 430.4 |
| 30–39 | 1283 | 275.7 | 233.7 | 308.8 | 176.5 | 414.1 |
| 40–49 | 784 | 270.9 | 231.1 | 303.7 | 176.5 | 414.1 |
| 50–59 | 515 | 287.1 | 245.5 | 326.5 | 183.2 | 422.1 |
| 60–69 | 647 | 292.8 | 250.5 | 333.9 | 185.8 | 429.2 |
| 70–79 | 418 | 298.3 | 254.1 | 344.7 | 185.8 | 429.2 |
| 80–100 | 275 | 310.8 | 262.7 | 346.7 | 194.5 | 478.6 |
- Abbreviation: SUA, serum uric acid.
3.7 Establishment of RI by Region
China has a large population with diverse customs and significant regional differences. To account for the impact of regional lifestyles on SUA levels, we further analyzed the distribution of SUA across various regions. Figure 7 illustrates the distribution of SUA levels and their statistical significance among different regions (Changsha, Shenyang, Yinchuan, Chengdu, Hangzhou, and Nanning). The p between regions indicated significant differences in SUA levels (e.g., p < 0.001 between Changsha and Yinchuan), suggesting that the SUA RI should be stratified based on regional differences. Therefore, we recommend establishing independent RIs for different regions to ensure accurate clinical diagnoses and regional adaptability. Comparative information between regions and the RI established using non-parametric methods is presented. Notable discrepancies existed in the RIs and median SUA levels across regions. The median SUA level in Shenyang was 316.6 μmol/L, with an RI of 194.9–496.2 μmol/L. By contrast, Changsha had a median SUA level of 298.9 μmol/L, with an RI of 192.5–447.8 μmol/L. Our analysis revealed no statistically significant differences in SUA levels among Nanning, Hangzhou, Chengdu, and Yinchuan; therefore, we combined these regions to establish a unified RI of 187.1–468.3 μmol/L (Table 6).
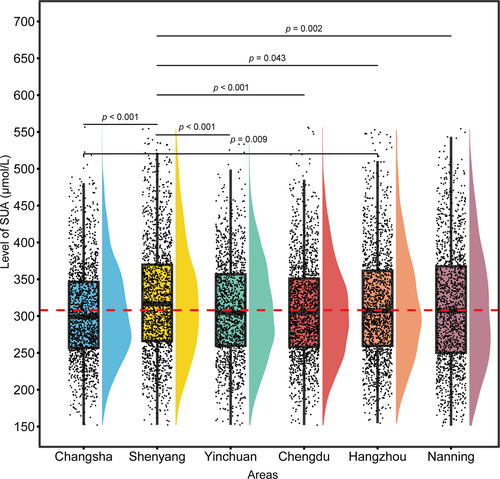
Comparison of SUA levels across different regions. The red line represents the median SUA level in the Hangzhou region, serving as a reference line. SUA, serum uric acid.
| Areas | Samples | Median | Percentile | Reference intervals | ||
|---|---|---|---|---|---|---|
| 25% | 75% | P2.5 | P97.5 | |||
| Shenyang | 1620 | 316.6 | 266.2 | 369.9 | 194.9 | 496.2 |
| Changsha | 1560 | 298.9 | 256.9 | 346.5 | 192.5 | 447.8 |
| Nanning + Hangzhou + Chengdu + Yinchuan | 6134 | 305.7 | 257.5 | 358.7 | 187.1 | 468.3 |
- Abbreviation: SUA, serum uric acid.
In this study, specific age groups (ages 80–100 years) exhibited insufficient sample sizes (e.g., < 120 cases), which may have compromised the statistical stability of the RI for these groups. To address this, we conducted a data aggregation analysis within these age groups rather than further subdividing by sex and age, thereby reducing the uncertainty associated with the limited sample size.
4 Discussion
Currently, reports on SUA levels in China are often limited to specific populations or regions, lacking comprehensive nationwide studies that reflect SUA levels in healthy populations across the country [16, 17]. This study established, for the first time, RIs for SUA that reflect levels across different regions in China (Shenyang, Yinchuan, Chengdu, Hangzhou, Changsha, and Nanning) by analyzing SUA data from these populations. Given that SUA levels are influenced by multiple complex factors, we implemented strict inclusion and exclusion criteria. The primary sources of UA are dietary intake and endogenous metabolic processes [18]. Consequently, we excluded individuals with a history of coronary heart disease, kidney disease, liver disease, diabetes, hypertension, or hereditary metabolic disorders—conditions closely related to UA metabolism that could result in abnormal SUA levels and compromise the accuracy of the RI [8, 19-21]. Additionally, the study accounted for lifestyle-related factors, such as the impact of diet, physical activity, and body weight on SUA levels. Research has shown that metabolic abnormalities associated with obesity are frequently linked to elevated UA levels [22]. Therefore, we excluded individuals with a body mass index outside the range of 18.5–28 kg/m2 to effectively reduce the confounding effects of obesity. These measures ensured greater consistency in the overall health status of our study population, thereby enhancing the reliability of the results.
In our study, we found that regional differences significantly influenced SUA levels, along with notable variations by sex and age group. For instance, the mean SUA level in men (345.3 μmol/L) was significantly higher than that in women (276.9 μmol/L). This finding is consistent with the RI results for SUA levels by sex reported in Brazilian cohorts [23]. Moreover, the results reported by Dório et al. [23] This disparity may be related to differences in physique, dietary patterns, and metabolic capacity between sexes. With respect to age stratification, we found that 50 years of age appears to be a critical cutoff point influencing SUA levels. Our data (Figure 5) show that SUA levels differed significantly among the 18–29, 30–39, and 40–49 age groups (p < 0.05), while no statistically significant differences were observed among the 50–59, 60–69, and 70–79 groups (p > 0.05). Additionally, the distribution of SUA levels across the overall population (Figure 3b) supports this conclusion, showing a slight upward trend in SUA levels after the age of 50 years. Similar findings were reported by Yang et al. [24] and Wang et al. [25], both of whom identified a correlation between SUA levels and age, consistent with our results. Yang et al. [24] showed higher SUA levels in men aged 20–59 years than in those aged 60–79 years. By contrast, we observed a slight decrease in SUA levels between ages 20 and 50 years, followed by a mild increase after age 50 years.
The overall distribution trend of SUA levels in our study aligns with that observed by Wang et al. [25]. Interestingly, although both Yang et al. [24] and Wang et al. [25] used indirect methods to establish SUA RIs, their SUA trends differed. This discrepancy may be related to population distribution and regional differences. Yang et al. [24] evaluated a population from the southwest region of China, whereas Wang et al. [25] focused on a population from the northern region. Similarly, our study showed notable inconsistencies in SUA level distributions across different regions (Figure 7). The boxplot analysis revealed that SUA levels in Shenyang were significantly different from those in the other five regions (p < 0.05). Significant differences were also observed between Changsha and Hangzhou as well as between Changsha and Shenyang (p < 0.05). However, no significant differences were found among Nanning, Hangzhou, Chengdu, and Yinchuan (p > 0.05). Accordingly, we established separate SUA RIs for Shenyang and Changsha, while assigning a common RI to the other four regions (Table 6). The average SUA level across Nanning, Hangzhou, Chengdu, and Yinchuan was 305.7 μmol/L, compared with a lower average of 298.9 μmol/L in Changsha. The dietary patterns in these regions are relatively diversified, with a greater emphasis on low-purine foods such as fruits and vegetables. A more balanced and varied diet, along with healthier lifestyle habits, may help maintain more moderate SUA levels. Previous studies have shown that individuals adhering to vegetarian diets generally have a lower risk of hyperuricemia [26, 27]. Despite the cultural and culinary differences among Nanning, Hangzhou, Chengdu, and Yinchuan, no significant differences were found in their SUA distributions. Piao et al. [13] divided China into eastern, western, and central regions and used stratified sampling to investigate the average UA levels and the prevalence of hyperuricemia among Chinese adults in 2015. Their findings showed the highest UA levels in the eastern region (315.5 μmol/L), followed by the western region (310.4 μmol/L), and the lowest in the central region (303.5 μmol/L). Our study reflects a similar pattern: the highest levels were observed in the eastern region (Shenyang), followed by the western region (Yinchuan, Chengdu, and Nanning), and the lowest in the central region (Changsha) (Table 6). However, although Hangzhou is geographically classified as part of the eastern region, our statistical analysis revealed no significant difference between its UA levels and those in the western region. This discrepancy may be attributed to differences in population selection: Piao et al. [13] utilized stratified sampling, while our population consisted of individuals undergoing medical check-ups in hospitals. Finally, variations in UA levels are likely influenced by a complex interplay of physiological, genetic, lifestyle, and environmental factors. A comprehensive, multifactorial approach is therefore essential to fully understand these differences.
Although we aimed to encompass diverse regions and populations, sample selection may have introduced some degree of bias due to differences in economic conditions, culture, and dietary habits across China. For instance, diets in northeastern China tend to be high in protein and purines, whereas populations in southern China may prefer low-purine diets—factors that can directly influence UA levels [28]. This dietary contrast is reflected in our findings, with UA levels in Shenyang being higher than in other regions. Additionally, the absence of certain subpopulations—such as rural residents or low-income groups—may limit the generalizability of the study. Research has shown a significant association between UA distribution and population type, with urban residents exhibiting higher average UA levels (317.5 μmol/L) than rural residents (302.9 μmol/L) [13]. Because our study population primarily consisted of individuals undergoing hospital-based health check-ups, it lacked representative data for rural or lower-income populations, potentially limiting the study's ability to fully reflect national UA levels. Moreover, participants were individuals who voluntarily underwent medical examinations rather than being selected through stratified sampling. This approach may have introduced selection bias because such individuals tend to be healthier. Prior studies have indicated that stratified sampling can significantly improve the representativeness of a study by ensuring a balanced distribution across subgroups, thereby enhancing the generalizability and reliability of findings [29].
The results of this study indicate that applying a uniform SUA RI may lead to inaccurate diagnoses or misleading treatments in certain regions or populations. Therefore, establishing region-specific SUA RIs will help improve diagnostic accuracy for SUA-related diseases and enhance clinical treatment outcomes.
Although this study included a wide range of regions and patient populations, there are limitations regarding the representativeness of regional samples, sample size, and control of confounding variables. For instance, the study was unable to fully account for differences in economic levels and dietary habits across regions, which may affect the interpretation of results. Future research should aim to increase the sample size, particularly to enable more in-depth analyses of different social groups within regions. Additionally, incorporating adjustments for varying dietary habits, lifestyles, seasonal factors, and environmental exposures may further clarify differences in SUA levels among populations and help optimize the establishment of RIs.
5 Conclusion
This study successfully established differentiated RIs by analyzing SUA levels in populations across multiple regions in China. These results provide a foundation for improving the diagnosis and treatment of related diseases such as gout and offer valuable direction for future region-specific research on SUA levels.
Author Contributions
Jiashu Yang: conceptualization (lead), data curation (lead), investigation (lead), methodology (lead), software (lead), visualization (equal), writing – original draft (lead). Junyi Wu: data curation (equal), formal analysis (equal), project administration (equal), software (equal), visualization (equal). Qing Liu: investigation (equal), software (equal), validation (equal), visualization (equal). Jingzhu Nan: methodology (equal), validation (equal), visualization (equal). Huai Zhao: software (equal), supervision (equal), visualization (equal). Hui Yuan: conceptualization (equal), data curation (equal), funding acquisition (equal), project administration (equal), resources (equal), supervision (equal), writing – review and editing (equal).
Acknowledgments
We thank the People’s Hospital of Liaoning Province, the General Hospital of Ningxia Medical University, the Hospital of Chengdu University of Traditional Chinese Medicine, the First Affiliated Hospital of Guangxi University of Chinese Medicine, the Hangzhou First People’s Hospital, and the Second Xiangya Hospital of Central South University for providing test samples for this study.
Ethics Statement
This study was approved by the ethics committee of Beijing Anzhen Hospital, Capital Medical University (2025100X).
Consent
Due to the fact that the samples in this study were obtained from residual clinical testing, informed consent from patients was waived as per the requirements of the ethics committee of Beijing Anzhen Hospital, Capital Medical University.
Conflicts of Interest
Mindray Medical provided the assay reagents, quality control materials, and calibrators for the detection of SUA in this study. However, the company was not involved in the study design, data interpretation, or manuscript writing, and has no direct conflict of interest with the study. The authors declare no conflicts of interest.
Open Research
Data Availability Statement
The data that support the findings of this study are available on request from the corresponding author. The data are not publicly available because of privacy or ethical restrictions.


