Quantifying streambank erosion: A comparison of physical surveys, aerial imagery and UAS LiDAR surveys
The manuscript does not include any material generated by other sources.
Abstract
Excessive or accelerated streambank erosion can harm stream ecosystems and negatively impact water supply and infrastructure systems. Streambank erosion can be the most significant source of in-stream sediment loads and associated contaminants. Site-specific, low-cost and timesaving methods to quantify active erosion rates are needed to identify and prioritize locations for restoration actions focused on reducing sediment loads and improving stream functions. Therefore, we examined several methods for quantifying streambank erosion at smaller spatial and temporal scales that are typical of most restoration projects. Physical surveys, aerial imagery analysis and Unmanned Aircraft System (UAS) based light detection and ranging (LiDAR) surveys were conducted to document erosion at three streams in the Blue Ridge and Ridge and Valley regions of Virginia. Three methods were used to quantify bank retreat: 1) cross-section (XS) surveys, 2) top-of-bank (TOB) surveys and 3) aerial imagery analysis. The bank retreat rates were compared to rates estimated from aerial images collected during 2007 to 2019. All three methods were then paired with field-measured bank heights to estimate the volume of erosion. Reachwide erosion volumes were also estimated with digital elevation models (DEM) of Difference (DoD) using LiDAR data collected with an UAS. The estimated eroded sediment volumes varied widely across all methods but were of a similar magnitude. DoD produced the lowest estimated sediment loads, highest uncertainty and was statistically different from the average of the maximum erosion measured at all cross-sections. The volume of streambank erosion ranged from 0.18 to 1.26 m3/m/yr across all sites for all methods excluding DoD. Based on the small size of our study streams and the short monitoring period (one to two years), DoD was the least suitable method. Selecting the appropriate method for documenting and quantifying erosion depends on the time available, the purpose of estimating erosion, the resolution required and stream conditions.
1 INTRODUCTION
Erosion, sediment transport and deposition are natural stream processes that are essential for healthy river ecosystems (Wohl et al., 2015). However, accelerated erosion has numerous negative consequences. Sediment can cover spawning fish habitats, disturb filter feeders and decrease the biodiversity of species, thus reducing ecosystem functions (DWER, 2000; U.S. EPA, 2017; Gage, Spivak, & Paradise, 2004; Paterson et al., 1993). Accelerated erosion can reduce the storage capacity in reservoirs and lakes, increase costs for hydroelectricity, water treatment and stormwater drainage, exacerbate flooding impacts and degrade aesthetics (U.S. EPA, 2015; Paterson et al., 1993). Streambed incisions and associated bank erosion can cause structural damage or failures that are a public safety hazard (Simon & Rinaldi, 2006). Problematic excessive erosion is primarily due to geological or anthropogenic disturbances (Florsheim, Mount, & Chin, 2008; Hupp et al., 2013; Wohl et al., 2015). Geologic disturbances like earthquakes cause dramatic shifts in the sediment regime causing instability through the imbalance of sediment transport (Hupp et al., 2013). Urbanization and development, for example, destabilize streams by increasing runoff and introducing new sediment sources from construction, gravel landscaping and road-deposited sediments (Atkins, Wegmann, & Bohnenstiehl, 2023; Hopkins et al., 2015; Noe et al., 2022; Russell, Vietz, & Fletcher, 2019, 2017; Wohl et al., 2015). Removal of vegetation, straightening and deepening of streams and other watershed disturbances such as cattle grazing can increase erosion. In some watersheds, streambank erosion can be the most significant process contributing to in-stream sediment loads (Stott, 1997).
Stream restoration and bank stabilization practices are used to address accelerated streambank erosion in hopes of recovering stream functions. Most restoration contracts span three to five years including monitoring allowing for one pre- and post-monitoring visit (Johnson, 2010). Some watershed management programs use pre- and post-monitoring for crediting streambank erosion reductions achieved through restoration (Altland et al., 2020). Various rapid geomorphic assessments are used to determine current stream conditions. The assessment used can result in different restoration approaches and priorities (Habberfield et al., 2014). The Bank Assessment for Non-point source Consequences of Sediment (BANCS) model can be used to predict sediment loads to assess restoration priorities (Rosgen, 2001) and is one of the most commonly used methods for pre-restoration assessments (Altland et al., 2020). The BANCS method produces curves for specific physiographic regions (the Piedmont of North Carolina (Doll et al., 2003), the Front Range of Colorado (Rosgen, 2001), Northeast Kansas (Sass & Keane, 2012), Yellowstone National Park in Montana (Rosgen, 2001)) that estimate a bank retreat rate based on the existing condition of an eroding streambank. However, the curves are an oversimplification of erosion rates across large spatial scales that may not be representative of the current conditions at a specific site (Couper, 2004; Goode et al., 2024). In fact, the erodibility of streambanks a few miles apart can be significantly different (Fox et al., 2016). Nevertheless, BANCS assessments are used by several U.S. state programs when quantifying the ecological uplift and associated mitigation credits allocated for stream restoration efforts (Donatich et al., 2020). Site-specific field surveys require longer periods of time (months to years) and physical labour to quantify erosion. This effort may not fit within the scope of a restoration project. Remote sensing methods often lack the resolution required to quantify channel changes on lower-order streams (Williams et al., 2020). Goode et al. (2024) states the need for lower-cost site-specific methods for facilitating stream restoration and mitigation projects.
Various methods exist for documenting and quantifying streambank erosion rates through field and geospatial desktop methods.
In the field, cross-section surveys and bank pins are commonly used to measure bank retreats (Purvis & Fox, 2016). Bank pins are installed horizontally into the bank at specified intervals, and the exposed length of the pins is repeatedly measured to capture bank erosion (Myers, Rediske, & McNair, 2019; Purvis & Fox, 2016). A total station survey instrument can be used to accurately measure cross-section geometry. The point density affects the survey resolution, where too few points fail to capture streambank retreat. These field methods are better suited for smaller-scale studies due to the time and cost required to perform the surveys and measurements (Williams et al., 2020). They are also only representative of changes at the specific cross-section and are unable to capture episodic streambank erosion (Purvis & Fox, 2016). The use of a total station for surveying has been shown to work well on both vegetated and bare banks (Myers, Rediske, & McNair, 2019).
Surveys can also be conducted along the top of bank (TOB), here-in referred to as TOB surveys, in the field to quantify reach wide erosion. Points are taken along the edge of the bank to capture the shape of the bank (El-Khoury, Doll, & Kurki-Fox, 2024). Unlike other methods that capture geomorphic change, field surveys are less limited by the presence of vegetation, but the labour and cost required are prohibitive when surveying large spatial scales.
Aerial imagery analysis is another method used to quantify streambank retreat that is more conducive for larger study areas and over multiple years. Streambanks are manually digitized using aerial imagery in GIS (Belmont et al., 2011; Heeren et al., 2012; Purvis & Fox, 2016; Ross et al., 2019; Williams et al., 2020), which can be difficult when there is dense vegetation. This method assumes vertical banks and excludes undercutting, which creates a bias. Aerial imagery analysis is time-consuming and leaves room for subjectivity limiting the ability to replicate studies (Williams et al., 2020). Many studies have applied aerial imagery on high-order streams over multiple-year periods (Bartley et al., 2008; Belmont et al., 2011; Heeren et al., 2012; Larsen, Premier, & Greco, 2006; Purvis & Fox, 2016; Ross et al., 2019; Williams et al., 2023, 2020) but not on first- or second-order streams over a period less than two years.
Digital elevation models (DEM) of Difference (DoD) involves quantifying volumetric change between successive topographic surveys (Williams, 2012). DoD analysis for estimating morphological change can be completed using DEMs produced through light detection and ranging (LiDAR) data, which uses point clouds to capture three-dimensional surfaces from laser-based measurements (Myers, Rediske, & McNair, 2019; Williams, 2012). Like aerial imagery, dense vegetation can affect the accuracy of DEMs derived from LiDAR. The chance the laser pulse will reach the ground is inversely proportional to the vegetation density (Schaffrath, Belmont, & Wheaton, 2015). The complexity of the method from collecting the data, processing and calibrating the data, creating a surface and processing it with a Geomorphic Change Detection (GCD) software increases the number of potential errors and uncertainties that can compound with each step (Gkiatas et al., 2022; Hohenthal et al., 2011; James et al., 2012; Schaffrath, Belmont, & Wheaton, 2015; Williams, 2012).
Different methods of measuring erosion rates provide varying levels of resolution and spatial scales that make direct comparisons of results difficult. Mapping the TOB from field surveys or by analysing aerial imagery, and DoD analysis can capture reachwide streambank retreat while cross-section surveys represent erosion only for a specific point. However, undercut banks which are the most difficult to measure, survey and quantify erosion rates for, are only captured with cross-section surveys. Bank angles are an important factor in streambank evolution helping to identify the stage of channel evolution which points towards the dominant channel processes (Simon, 1989; Simon & Rinaldi, 2006). Mass wasting (gravity-driven erosion) often occurs with undercut banks which is a different physical erosion process than flow-driven erosion that is caused by hydraulic forces (Zhao et al., 2022). Bank angles are commonly assumed to be near vertical for aerial imagery analysis and TOB surveys, which ignores the influence that bank angle has on the failure mode. Guidelines that recommend the best methods for measuring and predicting erosion rates based on stream type, physiographic region and the required spatial resolution could help to ensure the most appropriate methods are applied.
This study quantified and compared streambank erosion rates and reachwide volume estimates from different methods suitable for smaller spatial and temporal scales. Specifically, three methods were used to quantify bank retreat: 1) cross-section (XS) surveys, 2) field surveys of TOB and 3) aerial imagery analysis of TOB. The bank retreat rates were compared to rates estimated from aerial images collected during 2007 to 2019. Reachwide erosion volumes were also estimated with DoD using LiDAR data collected with an Unmanned Aircraft System (UAS). The research objectives were to: 1) quantify rates of erosion for streams in the Ridge and Valley and Blue Ridge regions in Virginia, 2) determine if erosion rates were comparable or statistically different between methods, 3) examine the suitability of each method on low-order streams under short-time periods and provide recommendations based on findings.
2 METHODOLOGY AND METHODS
2.1 Study area
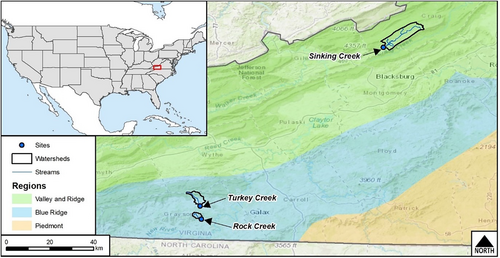
Three sites in Virginia were selected to compare various methods for quantifying streambank erosion. Rock Creek and Turkey Creek are located in the Blue Ridge and Sinking Creek is in the Valley and Ridge physiographic region (Figure 1). All three sites are second-order streams in the New River watershed. The three sites were initially identified by the U.S. Department of Agriculture's Natural Resources Conservation Service (NRCS) for future restoration to help with the recovery of the Eastern Hellbender (Cryptobranchus alleganiensis). Since the 1970s, their populations have been declining mainly due to the degradation of streams causing them to be listed as rare, threatened or endangered. Stream restoration is one of the ways the Virginia Department of Wildlife Resources is working on Eastern Hellbender conservation (Virginia DWR, 2021). The average channel slope ranged from 0.0022 m/m to 0.0144 m/m (Table 1). The largest percentage of land cover was forested for all site's watersheds followed by agriculture with less than 10% developed lands. Cattle were present at all three sites. However, the cattle were fenced out of Sinking Creek prior to the start of the study.
| Site | Rock Creek | Sinking Creek | Turkey Creek |
|---|---|---|---|
| Watershed Area (ha) | 774 | 7,542 | 2041 |
| Impervious (%) | 0 | 0.3 | 0.2 |
| Developed (%) | 1.2 | 4.7 | 4.1 |
| Forested (%) | 84.8 | 55 | 66.3 |
| Agriculture (%) | 14 | 38.7 | 28.7 |
| Channel Length (m) | 347 | 384 | 509 |
| Channel Slope | 0.0144 | 0.0032 | 0.0022 |
| Channel Evolution Stage | IV | IV | III |
| *Wbkf/WbkfVR | 0.7 | 0.6 | 0.4 |
| Mean Bank Height (m) | 1 | 1.5 | 1.6 |
| Mean Wbkf (m) | 4.2 | 9.8 | 3.8 |
- * Wbkf = bankfull width measured at cross-sections; WbkfVA = bankfull width estimated from Valley and Ridge hydraulic geometry regional curve (Keaton et al., 2005).
2.2 Site selection
These three sites were selected for a comparison of methods because of the presence of streambank erosion and minimal tree canopy obscuring the banks. Located in open pastures with easily identifiable TOB, these sites are ideal for both aerial imagery analysis and UAS-based surveys where there would be little vegetation to hinder drone flight and data collection. The target reach length for each site was approximately 300 m. The channel evolution stage (Simon, 1989) was determined for each stream based on channel dimensions and reach conditions. The average measured bankfull width (Wbkf) was compared to the bankfull width calculated using the Valley and Ridge hydraulic geometry regional curve (WbkfVA) (Keaton et al., 2005).
2.3 Analysis approach
To capture streambank erosion rates during the study period, all sites were surveyed with a total station and/or Global Navigation Satellite System Real-Time Kinematic (GNSS RTK) system and streambank erosion conditions, see section 2.6, and bank heights were recorded along the entire reach between January 2020 and January 2021. Bank pins were not considered for this study because they tend to increase bank instability during installation (Myers, Rediske, & McNair, 2019), and cattle were present at two of three sites. Six cross-sections were selected at Rock Creek and five cross-sections were selected at both Sinking and Turkey Creek in areas where bank erosion was present representative of all eroding banks along the reaches. The cross-sections were marked using rebar pins driven in the ground at the cross-section extents. Sinking and Turkey Creeks were surveyed approximately one year after the initial survey and Rock Creek was surveyed again after approximately two years. (Table 2). UAS-based LiDAR surveys were conducted in March 2021 and February 2022 including capturing aerial images. A minimum of one year of data is recommended to account for seasonal changes influencing erosion rates, as the variability of estimating annual erosion volumes decreases once at least a year of data is used (Gamble, 2021). To compare estimated streambank erosion rates to historical rates over a longer time period, aerial imagery analysis was conducted using the four available years of aerial images obtained for the Virginia Department of Emergency Management (VA EM) (2007, 2011, 2015 and 2019) (Virginia Department of Emergency Management, 2024). A summary and timetable of the methods applied to each study site are provided in Table 2.
| Site | XS survey | TOB survey | UAS LiDAR survey | |||
|---|---|---|---|---|---|---|
| Rock Creek | Jan 27, 2020 | Dec 13, 2021 | Jan 4, 2021 | Dec 13, 2021 | ||
| Sinking Creek | June 8, 2020 | June 28, 2021 | June 8, 2020 | June 28, 2021 | Mar 16, 2021 | Feb 15, 2022 |
| Turkey Creek | Jan 4, 2021 | Dec 13, 2021 | Jan 4, 2021 | Dec 13, 2021 | ||
2.4 Precipitation analysis
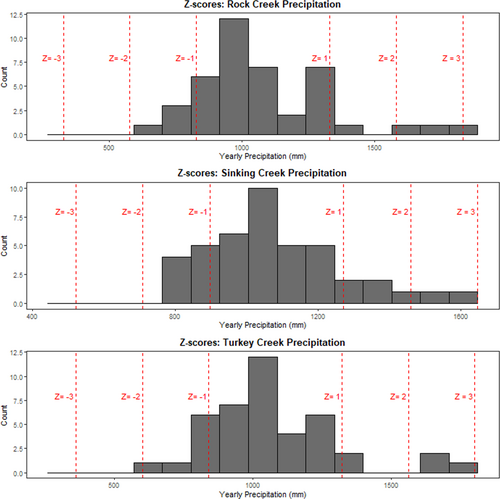
Daily rainfall data were downloaded from the PRISM Climate Group (Oregon State University, 2024) from January 1, 1981 (the earliest date available) through December 31, 2022. Annual precipitation was compared to the annual mean of the 41-year precipitation record using z-scores to determine if a year during the monitoring period fell outside the normal variation range following methods used by Zaimes, Schultz, & Isenhart (2006). A year was considered outside the normal range of variability if it had a z-score less than negative three or greater than three (Zaimes, Schultz, & Isenhart, 2006).
2.5 Annual bank retreat rates
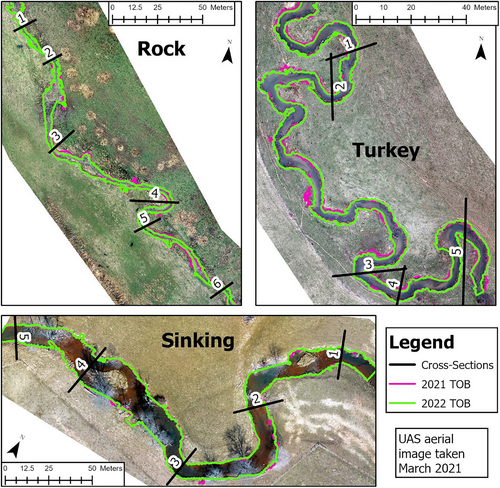
Survey points were collected along the selected cross-sections (Figure 2) by two teams using either a Trimble R10–2 GNSS System RTK, Trimble S5 Robotic Total Station or a Topcon GT 505 Series. The GNSS RTK system consisted of a base station set on a permanent rebar monument and a rover. The survey data were collected and then post-corrected though the National Oceanic and Atmospheric Administration's Online Positioning User Service (NOAA OPUS) (National Oceanic and Atmospheric Administration, n.d.). All surveys were conducted using the Virginia State Plane Coordinate System. The GNSS RTK system can reach up to 1 cm accuracy under ideal circumstances (e.g. clear weather, non-extreme temperature, clear line of sight, stable ground for instrument set up and a properly levelled instrument). The tolerance to record survey points with the Trimble TSC-3 controller was set to < 0.015 m horizontal and < 0.02 m vertical to allow points to be captured in remote locations with dense canopy cover or when high ridgelines were present (Edwards, 2021). The Topcon GT 505 Series total station has an accuracy of 2 mm ± 2 ppm under ideal conditions (Topcon, 2016).
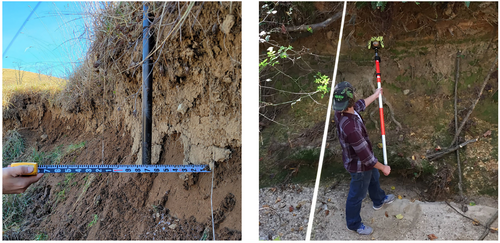
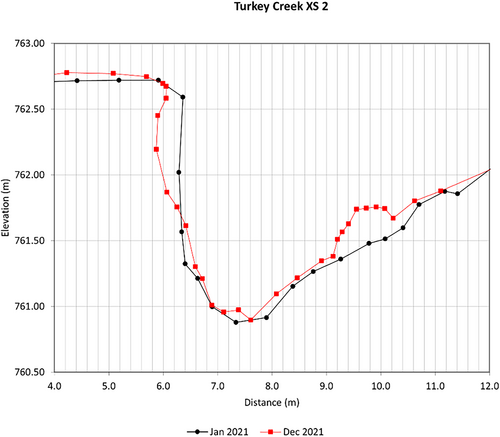
To accurately survey undercut banks, two techniques were applied. First, the horizontal offset between the survey rod and the bank was measured (Figure 3). The offset value was recorded so the horizontal station could be adjusted in post-processing to reflect the undercut. Second, when the survey instrument was positioned on the opposing bank with a clear view of the undercut bank, the prism was placed directly against the bank using 0 m for the rod height (Figure 3).
The cross-section survey data were exported into Microsoft Excel. The data were graphed, and the elevations for the top and bottom of the streambank were selected to isolate the bank from the channel bed and floodplain. The horizontal stations for the first- and second-year surveys were interpolated at every 0.15 m elevation interval from the predefined top and bottom of streambank elevations. Bank retreat was calculated by subtracting the stations. Minimum, average and maximum bank retreat values for each individual streambank at each cross-section were calculated to account for uncertainty in measurements and variability in erosion rates (El-Khoury, Doll, & Kurki-Fox, 2024). This method was similar to the bank retreat calculation method applied by Resop & Hession (2010). Any streambanks experiencing deposition, such as point bars, were excluded from this analysis.
To determine the survey error, two teams surveyed the same cross-sections on the same day at select locations in December 2021 following recommendations by Lawler (1993). Distances between the two teams' survey points were calculated. The median difference was used as the survey error. Factors that contribute to survey error and reducing data precision include human error (e.g. incorrectly setting the rod height, taking points when the rod is not completely vertical, collecting a survey shot when the rod is not in contact with the ground, etc.) and environmental conditions (e.g. animal and/or human disturbance of the survey pin, freeze/thaw cycles moving the pin, etc.) (Myers, Rediske, & McNair, 2019). Any bank retreat values less than or equal to the survey error were assumed to be 0 m.
Because erosion is generally non-uniform, TOB surveys were also included. Survey points were collected along the top of the streambanks extending both upstream and downstream of the cross sections for the length of the bank that was eroding or along the entire length of the surveyed channel.
Aerial imagery analysis was conducted on both historical images obtained from the VA EM (Virginia Department of Emergency Management, 2024) and from UAS images captured in 2021 and 2022. The VA EM images were collected in 2007, 2011, 2015 and 2019 and had 0.3 m resolution. The UAS images were collected to enable a temporally direct comparison to the LiDAR-based DoD analysis. These images had a resolution that ranged from 0.012 to 0.019 m depending on the site and year the image was taken. Streambanks were manually digitized from the images using ArcMap to quantify erosion following methods outlined by Purvis & Fox (2016).
Bank retreat rates at each cross-section were quantified in two ways in ArcGIS Pro for the delineations of TOB from field surveys and aerial imagery analysis. First, the bank retreat was directly measured at each cross-section location. Second, the eroded area was divided by the bank length from the first-year survey near each cross-section similar to methods described by Larsen, Premier, & Greco (2006) and Heeren et al. (2012).
All bank retreat rates were annualized by adjusting for the temporal distribution in rainfall energy and intensity (Renard, 1997). Linear interpolation was used to find the energy times intensity (EI) distribution for each day of the year based on the USDA Agriculture Handbook 703 (Renard, 1997) to calculate the EI value for each monitoring period. The bank retreat rates were divided by the EI value for an annual rate, except for the historical aerial images since the exact dates when the images were taken are unknown.
2.6 Reachwide erosion volumes
Both sides of the banks were visually assessed to classify if the bank was stable or eroding. Banks were classified as stable if they were fully covered with vegetation, and there was no bare soil. All other banks were classified as eroding. In addition, the general character of the erosion was also noted including surface scour, mass wasting, undercutting, bank toe erosion and/or hoof sheer by livestock. A GPS (Juniper Systems, Logan, UT) unit linked to the ArcGIS Collector app was used to record the start and end point of each eroding bank and the bank height.
Bank retreat values from all surveyed cross-sections at a site were averaged for the mean and maximum values that were measured. A reachwide volume of eroded material (m3/yr) was then estimated for the entire study reach by multiplying the average bank retreat value (m/yr) by the sum of the product of bank height (m) and length for each eroding section (m). The volume was estimated using both the mean and maximum measured bank retreat values to show the possible range of erosion.
For the TOB surveys and aerial imagery analysis, a lateral area of erosion was calculated by comparing the TOB digitization in ArcGIS from different years (Table 2), closely following the methods laid out by Purvis & Fox (2016). The lateral area of erosion was then multiplied by the field-measured bank height to estimate the volume of total erosion.
For the aerial imagery analysis, the error was estimated by having two assessors complete the aerial imagery analysis for Turkey Creek. The total area of erosion for each streambank was divided by the length of the bank (year 1) to obtain square meters of areal erosion per linear meter of stream per year. Erosion estimates were combined for the right and left banks. The percent difference in erosion areas was calculated between the two assessor's estimates.
To apply DoD, a geospatial mapping contractor collected LiDAR elevation data using a DJI Matrice 600 Pro unmanned aerial vehicle (UAV) equipped with a RIEGL miniVUX1-UAV LiDAR sensor (RIEGL, Austria) during March 2021 and February 2022. The UAV was equipped with a GNSS RTK. A base station was set up on the same surveyed rebar monument for each flight to allow for post-processing correction. The LiDAR sensor collected points at a density of 40 points per square meter with a stated accuracy of 1.5 cm. However, the checkpoints were only within ±3 to 6 cm of the LiDAR-measured elevations. The permanent rebar pins on the ends of each cross-section were used as ground control points.
The raw LiDAR data was filtered and classified by the contractor using a variety of proprietary software following standard industry practices and best professional judgement. First, the raw LiDAR data was downloaded, then the trajectory information stored was extracted into the Applanix PosPac software (Applanix Corp., Richmond Hill, Canada) to run the Post-Processed Kinematic solution. The corrected trajectory information was then loaded into the Riegl RiProcess software package and output into a LaSER (LAS) point cloud file. Leica 3DR software (Leica, Wetzlar, Germany) was used to remove extraneous points and to identify the ground points. The point cloud was processed into a 3D mesh and Triangulated Irregular Network (TIN) surface in LandXML format. The LandXML surface was converted into a DEM using ArcGIS Pro (ESRI, 2022). The DEM was created using a linear interpolation of the LandXML surface with a cell resolution of 0.03 m to ensure the bank edges were captured in the DEM. The resulting DEM had some voids where overhanging banks could not be reconciled by raster DEM algorithms. These overhanging areas were filled by using the ArcGIS Pro ‘Elevation Void Fill’ Raster Function assuming linear interpolation across the voids.
The Geomorphic Change Detection (GCD) Software (version 7; Wheaton et al., 2010) was used to estimate the year-over-year volumetric change in the channel banks (erosion and deposition). The bounds for the DoD analysis were set to 1.52 m outside the top of the bank. The narrowest edge of the water boundary from the two aerial images was traced to remove the areal extent of the water since LiDAR cannot completely penetrate the water to the stream bed, and the analysis was focused on streambanks, not bed features. The DEM error was used to calculate a propagated error within the GCD software (Wheaton et al., 2010). Reachwide erosion volumes were annualized the same way bank retreat rates were.
2.7 Statistical analysis
Statistical analysis was performed in R 4.2.2 (R Core Team, 2023) to determine if there were statistical differences in the magnitude of reachwide erosion rates and annual bank retreat rates based on the method used. An Analysis of Variance (ANOVA) test with a randomized block design was implemented with eroded volume per linear meter or annual bank retreat as the value, the method as the treatment level and the site as the block. To keep the residuals centered around zero, the eroded volume was raised to the power of 0.8. Tukey's Honestly Significant Difference (HSD) test was used to further determine which, if any, methods were statistically different from each other. Similar tests were performed by Myers, Rediske, & McNair (2019), Purvis & Fox (2016) and Zaimes, Schultz, & Isenhart (2006) to examine differences in erosion rates.
The ANOVA and Tukey's HSD test were run twice for the annual bank retreat rates: once for the rates measured along the XS alignment and again for rates calculated by dividing the eroded area by the bank length. A square root transformation applied to the annual bank retreat was used for both sets of tests to ensure the residuals were centered around zero with a normal distribution. Prior to the transformation, the residuals were right-skewed.
3 RESULTS
3.1 Precipitation
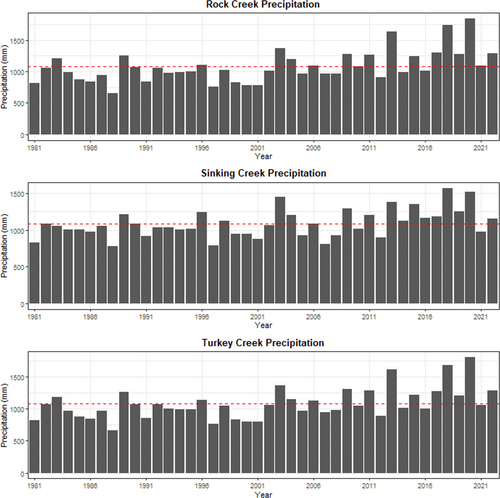
The average annual precipitation over the 41-year record for Rock, Sinking and Turkey Creek was 1,079, 1,084 and 1,081 mm, respectively. Since 1981 the total annual precipitation has been trending upward (Figure 4). The annual precipitation totals for all sites were within the normal range, although the z-score for Turkey and Rock Creek was three in 2020 (Figure 5).
3.2 Annual bank retreat rates
The bank retreat was calculated for the eroding bank at each of the 16 cross-sections across all three sites from field surveys (XS and TOB surveys) and aerial imagery analysis. The short-term annual bank retreat rates were compared to historical annual bank retreat rates from the analysis of aerial images taken in 2007, 2011, 2015 and 2019 (Figures 6 and 7). The 2021–2022 aerial imagery (<0.02 m resolution) produced the lowest bank retreat rates.
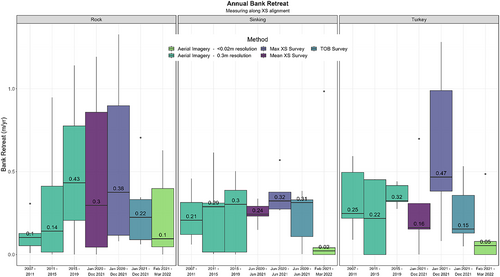
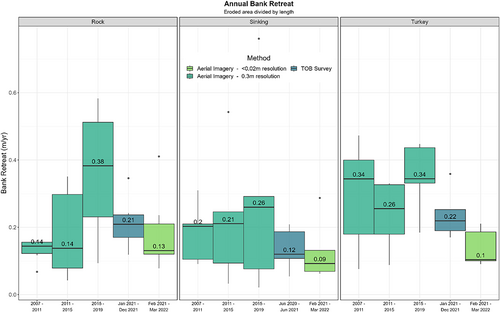
Rock and Sinking Creek show continually increasing annual bank retreat rates from 2007 to 2019 based on median values from aerial imagery analysis (Figures 6 and 7). Bank retreat rates decreased from 2007 to 2011 and increased from 2011 to 2019 at Turkey Creek. The median values of the max retreat rates from XS surveys for each study site are similar to the median values of 2015–2019 aerial imagery analysis. The median TOB survey retreat rates are closest to the median values of the mean XS survey rates for Rock and Turkey Creek and the max XS survey rates for Sinking Creek. Based on the historical aerial imagery analysis, there is an overall upward trend in bank retreat rates that could be from lateral migration or stream widening. All streams exhibited widening with an average increase in stream width of over 1 m occurring between 2007 to 2019. This is further supported by the ratios of less than one for the measured bankfull width compared to the bankfull width predicted based on watershed size from the Valley and Ridge regional curve (Keaton et al., 2005) (Wbkf/WbkfVR in Table 1).
There were statistically significant differences between methods (p = 0.021) but not between sites (p = 0.71) for the ANOVA test for annual bank retreat measured along the XS alignment. Tukey's HSD test revealed there was a statistical difference between the max XS and 2021–2022 aerial imagery (<0.02 m resolution) (p = 0.0085).
The ANOVA test for annual bank retreat calculated using the area divided by the bank length found statistical differences between the methods (p = 0.013) but not between sites (p = 0.11). Tukey's HSD test revealed there was a statistical difference between the 2015–2019 aerial imagery (0.3 m resolution) and 2021–2022 aerial imagery (<0.02 m resolution) (p = 0.0076). Refer to Supporting Information for tables with all p-values.
Figure 8 compares the annual bank retreats for each individual cross-section from the methods applied over a one-to-two-year period. There was a wide range of lateral bank retreat measured across all sites from 0 to 1.27 m/yr. As expected, aerial imagery produced the lowest rate except for Sinking 1. If the digitization of the TOB had been selected differently, it is possible the bank retreat at Sinking 1 would also have the lowest retreat rate. There will always be some degree of subjectivity when determining the TOB placement or where to take a survey shot along a cross-section.
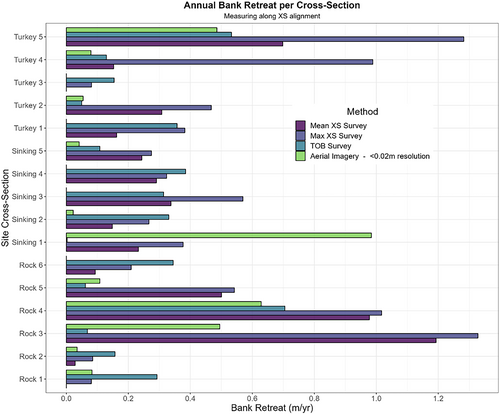
The precision of the total station and RTK survey data was estimated at 0.03 m based on the median lateral difference between repeated cross-section surveys completed on the same day by two different groups. Therefore, any measured bank retreat less than 0.03 m could not be confidently classified as erosion and was assumed to have an annual bank retreat rate of 0 m/yr. The percent difference between surveyors ranged from 0 to 7.5% with an average of 1%. The comparison of repeat aerial imagery analysis conducted by two different assessors showed a range in percent difference from 0.5 to 22% with an average of 9.6% for Turkey Creek when comparing the values for the area of erosion per linear meter of the stream.
3.3 Reachwide erosion volumes
The total estimated annual erosion volumes for Rock, Sinking and Turkey Creeks are illustrated in Figure 9. No reachwide erosion volume for TOB is reported for Sinking Creek since TOB surveys were not completed along the entire reach. The only methods that can be directly compared are the XS and TOB surveys at Sinking and Turkey Creek and 2021–22 aerial imagery and DoD analysis. Data for the other methods were collected during different time periods, which introduced other sources of variability (i.e. discharge), so a direct comparison would require that we account for differences in stream discharge between the different time periods. Flow data were not available at the sites, but precipitation was used as a proxy for flow. However, annual erosion volumes between Rock, Sinking and Turkey Creeks were similar across the different methods. The DoD method produced the lowest volume for all sites which was statistically different from the other methods. While not statistically significant, the XS survey volume estimates are more than double the volume estimated by the other methods for Rock and Turkey Creek (Figure 9), which is still a substantial difference.
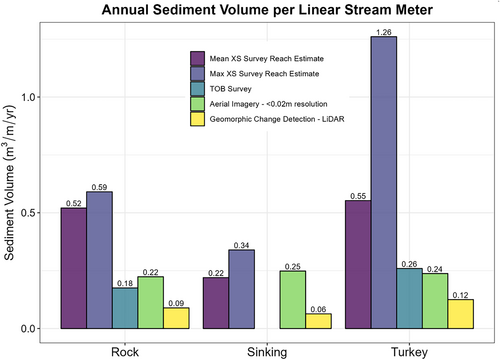
The max XS survey volume for Turkey Creek is 2.3 times greater than the mean XS survey volume due to a high presence of undercut banks. Turkey Creek exhibited undercutting at four of the five cross-sections and it was noted at several other eroding banks along the reach. No undercutting was present at the cross-sections for Rock and Sinking Creek, but undercutting was noted at a couple of spots along the reaches. As a result, the difference between the average mean bank retreat and average max bank retreat at Turkey Creek (0.36 m/yr) was more than twice that of Rock Creek (0.07 m/yr) and Sinking Creek (0.11 m/yr).
The percentage of eroding banks along the reach ranged from 39% at Sinking Creek, 54% at Rock Creek to 79% at Turkey Creek. Turkey Creek had the largest eroded volume per linear meter of stream across all methods, except for aerial imagery volume at Sinking Creek. Sinking Creek, with the lowest percentage of eroding banks, had the smallest volume, except for the aerial imagery volume. Turkey Creek has the most eroding banks which may have influenced why there was a larger annual volume of erosion per linear meter of stream estimated for this site.
The ANOVA test comparing reachwide erosion volumes did not have statistically significant differences between the sites (p = 0.16) but did between the methods (p = 0.05). Tukey's HSD test showed that there is a statistical difference between the DoD method and the max XS survey method (Table 3). The DoD method has an error range from 25 to 44% across all three sites corresponding to ± 0.02 m3/m/yr for Rock and Sinking Creek and ± 0.03 m3/m/yr for Turkey Creek. Even with the error added to the DoD volume, it is still less than the other methods.
| Methods | p-value |
|---|---|
| Max XS Survey Reach Estimate|DoD | 0.022* |
| Max XS Survey Reach Estimate|Aerial Imagery - < 0.02 m resolution | 0.093 |
| Max XS Survey Reach Estimate|TOB Survey | 0.12 |
| Mean XS Survey Reach Estimate| DoD | 0.20 |
| Max XS Survey Reach Estimate|Mean XS Survey Reach Estimate | 0.45 |
| Mean XS Survey Reach Estimate|Aerial Imagery - < 0.02 m resolution | 0.70 |
| Mean XS Survey Reach Estimate|TOB Survey | 0.70 |
| Aerial Imagery - < 0.02 m resolution| DoD | 0.77 |
| TOB Survey| DoD | 0.89 |
| Aerial Imagery - < 0.02 m resolution|TOB Survey | 1.00 |
4 DISCUSSION
4.1 Annual bank retreat rates
Our study results reported a range of bank retreat rates across three study sites. The amount of erosion we recorded was likely influenced by riparian, watershed and climate conditions among other factors such as livestock access. Our range of measured bank retreat rates was similar to rates reported for forested and agricultural watersheds in Maryland, North Carolina, Pennsylvania and Tennessee (Gellis et al., 2017) and measured at Stroubles Creek in Blacksburg, Virginia (Resop & Hession, 2010). Gellis et al. (2017) demonstrated the temporal variability in erosion rates for the urban Upper Difficult Run watershed in northern Virginia with only 20 of 140 streambanks continually eroding during the four periods. In contrast, most of the banks in this study continually eroded from 2007 to 2022 (Supporting Information Table S5) despite fluctuations in annual precipitation. It is anticipated that all sites will continue to experience increasing bank retreat rates until the stream reaches the quasi-equilibrium phase (Simon, 1989). Evaluation of the historical aerial imagery helped us to determine the current channel evolution phase for the stream, which provides insight regarding the potential trajectory of bank retreat rates in the future.
After notable precipitation resulting from tropical storm Lee, Gellis et al. (2017) observed most reaches had eroded. Booth & Henshaw (2001), Palmer et al. (2014) and Zaimes, Schultz, & Isenhart (2006) also found correlations between temporal variations in erosion rates and precipitation factors with higher amounts of precipitation causing greater streambank erosion and channel changes. Zaimes, Schultz, & Isenhart (2006) also observed some high rates of bank erosion during low daily precipitation events that suggest the influence of additional factors other than precipitation such as vegetation cover and freeze–thaw cycles.
When comparing the average bank retreat to the average annual precipitation during each monitoring period, larger precipitation amounts correlated to higher bank retreat, similar to previous studies. The one exception is the 2011–2015 period at Turkey Creek indicating other factors are influencing the erosion rate (Figure 10).
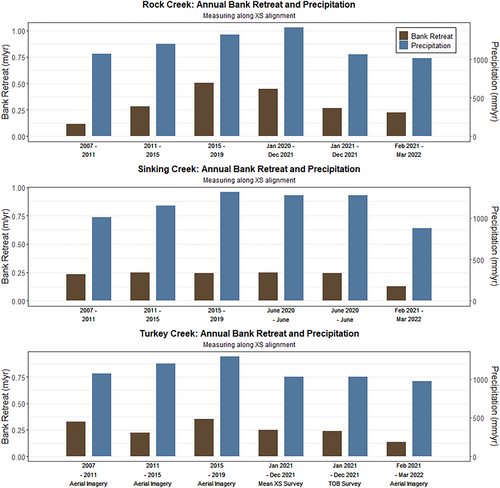
Streambank erosion rates are often higher in the winter even though these months have lower magnitude flows compared to summer months which typically experience the highest peak flows (Wolman & Miller, 1960). This can be attributed to freeze–thaw cycles that have been identified as significant drivers of erosion along with other subaerial processes (Couper & Maddock, 2001; Zaimes, Schultz, & Isenhart, 2006; Zhao et al., 2022). This is especially important in regions with freezing temperatures, like the Valley and Ridge region of Virginia where it has been proven that freeze–thaw cycles play an important role in streambank erosion (Gamble, 2021; Wynn, Henderson, & Vaughan, 2008; Wynn & Mostaghimi, 2006). Couper and Maddock (2001) found that most erosion along the River Arrow, UK was driven by subaerial processes that occurred during the months where no flow events reached the level of erosion pins. This emphasizes how freeze–thaw cycles are just as important as fluvial processes to streambank erosion and bank failure.
The bank retreat rate from the mean XS survey, TOB survey and 2021–2022 aerial imagery were lower than the bank retreat rate from the 2015–2019 aerial imagery analysis across all sites (Figures 6, 7 and 10). These three methods may have reported lower bank retreat rates since they had a shorter timeframe to quantify erosion compared to a four-year period. The frequency and intensity of storms combined with antecedent soil conditions dictate the amount of erosion that will occur due to unstable undercutting and mass wasting (bank failure) (Daly, Miller, & Fox, 2015; Midgley, Fox, & Heeren, 2012). This is why streambank erosion, especially extreme erosion, is episodic in nature. Erosion associated with bank failure mechanisms is typically observed after a bankfull or larger flow event that fully saturates the banks (Daly, Miller, & Fox, 2015; Midgley, Fox, & Heeren, 2012; Zhao et al., 2022). If the conditions that drive bank failure were not met or did not occur as frequently during the study period, bank failure could be underrepresented, and bank retreats potentially underestimated. In contrast, fluvial erosion is more continuous and progressive (Zhao et al., 2022). Also, repeated low-magnitude flow events can erode the bank toe, undermining the bank and resulting in bank failures (Simon, 1989; Simon et al., 2000). Longer monitoring periods would likely capture more of these flow scenarios and provide a more accurate annual average erosion rate (Couper, 2004; Daly, Miller, & Fox, 2015; Gamble, 2021). With the shorter monitoring period for the field surveys and the 2021–2022 aerial imagery analysis, conditions may not have been met for all sites to experience more extreme erosion. From Figure 10, there is a strong correlation (0.69) between the average annual precipitation and bank retreat rates. Further investigation of rainfall was not explored since event-based erosion was not measured.
4.2 Reachwide erosion volumes
Our range of annual volume per linear meter of stream, 0.18 to 1.26 m3/m/yr, fell at the mid to bottom of the range reported for Pennsylvania (0.4 to 1.9 m3/m/yr) (Walter, Merritts, & Rahnis, 2007) and on the lower end of the previously recorded North Carolina range (0.05 to 4.5 m3/m/yr) (Wegmann et al., 2013). At Stroubles Creek, Resop & Hession (2010) estimated 0.19 and 0.15 m3/m/yr from total station and terrestrial LiDAR scanning (TLS), respectively, which falls at the lower end of volume estimates in this study. Variations in each methods' ability to capture changes along the bank surface and reach likely contributed to the differences in volume as well as differences in monitoring time periods. While the differences in monitoring periods could have contributed to differences in the rate of erosion due to variations in flow events, land use changes and other factors, it does not explain the difference between methods with the same monitoring period.
The XS and TOB surveys at Sinking and Turkey Creek had the same monitoring period, but the XS reachwide method estimated larger volumes compared to the TOB survey. Similarly to Resop & Hession (2010) and Myers, Rediske, & McNair (2019), the cross-section surveys estimated a larger reachwide volume compared to all other methods likely due to each methods' ability to capture undercut banks. Our method did apply the mean retreat rate measured from all XSs to the entire length of all eroding streambanks, which assumes a consistent erosion rate for all eroding banks that could result in over or underestimation.
Undercut banks have been reported as the most challenging banks to quantify streambank erosion (Myers, Rediske, & McNair, 2019; Resop & Hession, 2010; Williams et al., 2020). Unlike cross-sectional surveys, TOB mapping from aerial imagery analysis and DoD analysis is unable to capture changes along the bank surface. Field survey and aerial imagery analysis of TOB both capture the lateral non-uniformity but not the difference in erosion vertically along the bank as both assume a 90° bank. DoD should in theory capture both the vertical and lateral non-uniformity but does have limitations depending on the type of survey used to generate the DEMs and software used to estimate volumes. UAS LiDAR cannot penetrate water preventing changes along the bank toe from being quantified. Additionally, the GCD software cannot depict undercut banks since it can only process 2.5 D surfaces, i.e. surfaces with one coordinate per elevation (Williams, 2012). Studies that use TLS, which captures both vertical and longitudinal variation along streambanks (Lyons et al., 2015; Resop & Hession, 2010), still produced lower estimates compared to total station surveys (Myers, Rediske, & McNair, 2019; Resop & Hession, 2010). The assumption of a vertical bank/absence of undercutting could explain why these methods produced smaller erosion rates when compared to the cross-sectional method. Resop & Hession (2010) reported being unable to survey a deeply undercut bank with a total station. Using our two methods for surveying undercut banks, we did not have any difficulties and were able to fully capture the extent of undercutting along banks (Figure 11). The purpose of a study is to help determine which method captures the degree of spatial variability required. The method used to estimate the potential reduction in sediment loads through bank stabilization or stream restoration could affect whether a project is selected or how many mitigation credits are awarded.
4.3 Capturing non-uniformity in streambank erosion
The non-uniformity of erosion was captured to varying degrees by each method. Despite the range in values of bank retreat from various methods across the 2020–2022 period, only the aerial imagery analysis (2021–2022) produced a statistically different mean (Supporting Information Table S6 and S7). While Myers, Rediske, & McNair (2019) had a large range of relative errors from 22 to 3,715% between different methods, they detected no statistically significant differences. Unlike the Myers, Rediske, & McNair (2019) study which compared methods (erosion pins, total station and terrestrial laser scanner) that all capture the shape of the bank from the top to toe, this study compared total station/RTK cross-section surveys to two methods that only capture longitudinal variation. The limitations of each method must be considered when comparing results. Reachwide erosion estimates from cross-section surveys assume that the bank retreat is uniform across the entire length of the eroding bank. In contrast, TOB delineation from field surveys and aerial imagery and DoD can map changes along the entire reach. Couper (2004) discusses that the extrapolation of measurements over larger spatial scales may not be representative. Gamble (2021) recommended a longitudinal distance of three channel widths or less between cross-sections as this reduced the variability in estimating reachwide erosion volumes. Since the majority of the spatial distances between our cross-sections was less than three channel widths, one can assume the cross-sectional surveys are representative of the eroding streambanks throughout the reach.
From an aerial perspective, undercut banks would appear stable unless the overhanging bank collapsed. Over a multi-year period, it is more likely to see the entire bank laterally retreat, negating issues with quantifying erosion from undercut banks. More cross-sections in the 2021–2022 aerial imagery analysis showed deposition compared to the other methods (Supporting Information Table S5), which contributed to the overall lower erosion rates for this method. For example, two of the four cross-sections at Turkey Creek that experienced undercutting showed deposition or no change based on the 2021–2022 aerial imagery analysis. These two cross-sections were, however, eroding based on XS and TOB surveys (Supporting Information Table S5). The third XS at Sinking Creek also showed deposition from the 2021–2022 aerial imagery analysis, but the XS surveys revealed the top portion of the bank was eroding at a faster rate than the bottom. The erosion along the top portion of the bank was not visible from the aerial perspective.
To obtain a more accurate erosion rate when using aerial imagery or field TOB surveys, it is better to divide the eroded area by the bank length, particularly for streams with undercut banks. For Turkey Creek, that method produced bank retreat rates closer to rates measured at cross-sections with field surveys than measuring along the XS alignment. This is important to note if aerial imagery is used to estimate bank retreats to justify stream restoration efforts and mitigation credits, potentially eliminating the need for field surveys.
4.4 Determining top of bank in the field and remotely
Locating the top of the bank was a critical step for both the field TOB surveys and aerial imagery analysis. Images collected when vegetation is dormant are most appropriate for discerning the top of the bank (Myers, Rediske, & McNair, 2019; Williams et al., 2020). Overhanging vegetation including trees, woody shrubs and long grasses made it difficult to delineate the TOB both in the field and during desktop aerial imagery analysis for our study. When the TOB is obscured, the certainty of the results decreases (Lawler, 1993; Purvis & Fox, 2016; Williams et al., 2020). Therefore, it is best to remove obscured sections of the bank from the analysis. This is acceptable where vegetation is heavy along the bank as higher root density and surface protection are likely to decrease the erosion potential of the bank (Bigham et al., 2018; Rosgen, 2001; Zhao et al., 2022). Other factors that made delineating TOB on the aerial images more challenging included the water levels, shadows, irregularity of banks trampled by livestock, and clarity of the images. When surveying in the field, selecting the specific location for collecting the TOB survey point was also difficult, especially at locations where the bank had slumped but had not fully collapsed.
Our methodology assumed a uniform height for each segment of the stream between locations where we field-measured the streambank heights. We potentially could have estimated more precise volumes using LiDAR DEMs to extract the bank height for each pixel within the polygons similar to the methodology followed by Tomer & Van Horn (2018).
4.5 Temporal and spatial scales
Many previous studies applied aerial imagery analysis on higher-order streams than those in this study (Macfall, Robinette, & Welch, 2014; Purvis & Fox, 2016; Ross et al., 2019; Williams et al., 2023). A high-resolution aerial image is required to identify changes along a stream over a short time. While there was a detectable change during the 2021–2022 aerial imagery analysis, which used higher resolution images than the historical images analysed, the median bank retreat ranged from 0.02 m/yr at Sinking Creek to 0.1 m/yr at Rock Creek which is not much greater than the <0.02 m pixel size. Even with increased aerial image resolution, it is still better to apply this analysis to longer, multi-year time periods for lower-order streams to ensure the magnitude of change substantially exceeds the pixel size of the image. Applying aerial imagery analysis over a one-year period on lower-order streams is likely to underestimate erosion.
Applying DoD with LiDAR data allows for examining channel processes on larger spatial and temporal scales (Boothroyd et al., 2021; Gkiatas et al., 2022; Hohenthal et al., 2011; Schaffrath, Belmont, & Wheaton, 2015) and removes previous spatiotemporal limitations on fluvial geomorphology studies set by traditional field methods and desktop computing (Boothroyd et al., 2021). The smallest change in erosion that the DoD would be able to accurately capture is based on the spatial resolution of the DEM created from LiDAR data. The smallest average bank retreat measured along cross-sections from field surveys was 0.04 m/yr which is only 0.01 m larger than the 0.03 m resolution of our DEM. When examining the performance of applying this method on second-order streams over a one-year period, we found that this method consistently underestimated streambank erosion, relative to the other methods. Like aerial imagery analysis, this method is likely better suited for larger streams over longer periods of time where the magnitude of change would be greater.
4.6 DoD compounding errors
The DoD analysis estimates lower erosion volumes compared to all methods even when accounting for the error (Figure 9). The DoD analysis had the greatest error compared to the surveys and aerial imagery analysis. The maximum error for surveys, aerial imagery and DoD analysis are 7.5%, 22% and 44%, respectively. The maximum DoD error in this study was substantially less than the error reported by Schaffrath, Belmont, & Wheaton (2015) (91%) for DoD from LiDAR data. Because their error encompasses zero, Schaffrath, Belmont, & Wheaton (2015) were not able to state significant change occurred which was not the case in this study.
The high percentage of error for DoD is the result of the DEM error relative to the magnitude of year-to-year changes in the LiDAR-derived DEMs. The GCD software calculates the range of uncertainty based on the error associated with each DEM. The DEM error was the difference between the LiDAR-derived DEM elevations and the ground control point elevations. The DoD error is propagated as there is an error associated with the DEM for each year.
Overall, there are multiple sources of error associated with collecting and processing LiDAR and creating a surface from the data. Some sources of error can include weather conditions, dense vegetation, shadows and terrain-shading and georeferencing among others (Gkiatas et al., 2022; Hohenthal et al., 2011; James et al., 2012; Ludwig et al., 2020; Schaffrath, Belmont, & Wheaton, 2015). James et al. (2012) further discusses the uncertainties with geomorphometry and DEM differencing. It is important to note that DoD is subject to both horizontal and vertical error for the difference between ground control points and the generated surface. These differences can stem from changes in vegetation density or coverage which can impact the LiDAR results by reducing/increasing point density, thereby impacting the accuracy and resolution of the topographic surface. The grass was dense at Turkey and Sinking Creek, which decreased the chance the laser penetrated all the way to the ground. In addition, like any survey, settling or other changes to the control points would impact the accuracy of the results. For our study, the vertical difference between the ground control points and the generated surface was relatively small ranging from 1.5 to 5.5 cm. However, this error compounds across the entire reach.
A drawback to DoD is that errors in topographic data are incorporated into the analysis and assumed to represent geomorphic changes. An example of this seen in our study was dealing with overhanging or undercut banks. The conversion of the LiDAR-derived TIN to a DEM adopts a single elevation for each spatial coordinate. These areas create voids in the DEM that must be interpolated, which reduces the detail of the topography along the banks, effectively eliminating any undercut banks (Myers, Rediske, & McNair, 2019).
All three streams had fairly steep banks with angles close to 90° or greater. Elevation errors tend to be greater on steeper banks for airborne collected LiDAR due to greater horizontal errors and a decrease in the point density (Hohenthal et al., 2011). Collecting LiDAR data with a TLS could have improved the point density along the banks and decreased the error. The size of the river, length of the study and methods for processing the data and creating a surface are important factors in determining if DoD is appropriate.
Schaffrath, Belmont, & Wheaton (2015) explore the uncertainty associated with DEMs and DoD, emphasizing the importance of knowing the limitations of the technology for data collection, how post-processing the raw data influences the results and how systematic errors can propagate through the georeferencing process. It is difficult to understand where the errors in the DoD analysis come from if the errors for each step of the process are not well documented. In addition, standard methods are needed for processing each LiDAR survey as differences can render comparisons less meaningful.
4.7 Recommended methods
Table 4 summarizes when it is most appropriate to use each method for small, low-order streams. Based on our findings, more labour-intensive physical surveys are likely the most accurate approach to quantify streambank erosion rates and potential benefits of restoration efforts at a particular location. Cross-section surveys are best for quantifying streambank retreat rates. The most appropriate method to estimate reachwide erosion volumes depends on the monitoring period and site conditions. For sites with substantial undercutting, extrapolation of cross-section surveys to other eroding banks is the only way to capture undercut banks. This method remains the best option for short-term studies, provided all eroding banks have been identified along the reach and the selection and spacing of cross-sections appropriately represent the study reach. Sites with extensive vegetation will require field surveys. It is recommended that field-based and aerial imagery TOB surveys be conducted over multi-year periods. However, a single year of TOB data collection is acceptable if the amount of change measured is greater than the error or image resolution. Aerial imagery analysis is the least labour-intensive and most economical method for sites with minimal vegetation. Estimating reach erosion volumes from TOB analysis, however, still requires field measurements or desktop estimates of streambank height.
| Method | Resolution | Spatial scale | Temporal scale | Limitations |
|---|---|---|---|---|
| Total Stations/RTK | ≥ 0.02 m | Reaches | Months or years | Accuracy affected by point density; better at capturing specific locations; extensive manual labour; XS captures undercut banks, but TOB does not |
| Aerial Imagery | Dependent on imagery resolution | Reaches, Watersheds | Years | Requires moderate to no vegetation cover; migration rates must be greater than photo resolution; bars should be excluded; assumes vertical bank |
| UAS-LiDAR | ≥ 0.1 m | Reaches, Watershed | Years | Requires little to no vegetation cover; potential systematic bias due to different geoid models; account for vertical, horizontal, & vegetation uncertainty; cannot capture undercut banks |
- Utilize UAS for higher-resolution (<0.3 m) aerial images.
- Capture images during winter to reduce vegetation interference.
- Appropriately time image collection to minimize shadows.
- Place field markers along the TOB lines in the field prior to the image collection to guide the TOB tracing in GIS.
Although we identified erosion along reaches using DoD with GCD software, the method's large error and consistent underestimation created concern for its application along small, low-order streams over one year. DoD analysis with UAS LiDAR is recommended for use when the volume of erosion and deposition is relatively large compared to the error.
5 CONCLUSIONS
Accurate quantification of streambank erosion is crucial for effective stream restoration and management decisions. We quantified streambank erosion for three stream reaches in the Blue Ridge and Ridge and Valley regions of Viriginia using field surveys with total stations/GNSS RTK systems, aerial images and UAS LiDAR surveys. Bank retreat rates were measured with three methods: 1) cross-section surveys, 2) field survey of TOB and 3) aerial imagery analysis of TOB. Reachwide erosion volumes were also estimated with DoD using LiDAR data collected with a UAS. The volume of streambank erosion ranged from 0.18 to 1.26 m3/m/yr across all sites and methods excluding the DoD analysis. DoD analysis consistently underestimated erosion volumes across all sites with values from 0.06 to 0.12 m3/m/yr.
In the context of stream restoration, there is a need for site-specific and short-term methods to quantify sediment loads both before and after restoration projects. The BANCS model is commonly used to predict sediment loads that will be averted by restoration projects (Altland et al., 2020). The BANCS erosion curves often use a few sites with limited data to predict erosion across an entire region (Altland et al., 2020; Bigham et al., 2018). Success has been highly variable in developing BANCS erosion curves (Bigham et al., 2018; Ghosh, Pal, & Mukhopadhyay, 2016; McMillan, Liebens, & Metcalf, 2017), and they can produce a wide range of erosion prediction results depending on which curve is used (Altland et al., 2020). The methods presented in the paper, excluding DoD analysis, are preferable to using BANCS erosion curves because they represent current, site-specific erosion rates. Ultimately, the method selected depends on the purpose of the effort, available time, required resolution and stream conditions.
AUTHOR CONTRIBUTIONS
Conceptualization: Barbara Doll, Jack Kurki-Fox, Layla El-Khoury; Funding Acquisition: Barbara Doll; Methodology and Investigation: Layla El-Khoury, Barbara Doll, Jack Kurki-Fox; Resources: Barbara Doll; Software: Barbara Doll, Jack Kurki-Fox; Writing – initial draft: Layla El-Khoury; Writing – reviewing and editing: Layla El-Khoury, Barbara Doll, Jack Kurki-Fox.
ACKNOWLEDGEMENTS
Funding for this study was provided by the US Department of Agriculture - Natural Resources Conservation Service through a contract with Pheasants Forever (USDA Award # 69-3A75-17–438). The authors would like to thank Dr. Melanie Carter, Zach Edwards, and the other field staff at USDA-NRCS, and Seth Swaim and other members at Withers & Ravenel for helping with data collection and processing.
CONFLICT OF INTEREST STATEMENT
All authors declare that they have no conflicts of interest to disclose.
Open Research
DATA AVAILABILITY STATEMENT
The data that support the findings of this study are available from the co-author, Barbara Doll, upon reasonable request.


