Hypoxia inducible factor-1 activator munc-18-interacting protein 3 promotes tumour progression in urothelial carcinoma
Abstract
Background
Although the introduction of multiple agents targeting immune and oncogenic signaling pathways has substantially changed the treatment strategies for urothelial carcinoma (UC), these drugs still have some limitations, such as adverse effects and limited responses depending on the molecular subtype of UC. Therefore, the development of novel molecular-targeted therapies is required. Munc18-1-interacting protein 3 (Mint3), which specifically activates hypoxia inducible factor-1 (HIF-1) during normoxia in cancer and some stromal cells, might be a good target for UC treatment without severe adverse effects. However, the expression and function of Mint3 in UC remain unclear.
Methods
We prepared bladder cancer (n = 117) and upper tract UC (n = 207) cohorts and analyzed the correlation between Mint3 expression in the tissue microarray and the clinicopathological factors/prognosis. To clarify the function of Mint3 in UC cells, control and Mint3-depleted UC cells were analyzed for HIF-1 activity, HIF-1 target gene expression, cell proliferation, glycolysis, motility and invasion in vitro. Tumorigenicity and angiogenesis in control and Mint3-depleted UC cells were analyzed in mouse xenograft models. A Mint3 inhibitor, naphthofluorescein and gemcitabine were administrated into UC xenograft-bearing mice.
Results
Mint3 was expressed at various levels in UC cells; high expression was correlated with a poor prognosis but not with the molecular subtype of UC in two independent UC cohorts. Mint3 depletion did not affect cell proliferation but attenuated HIF-1 activity, HIF-1 target gene expression, glycolysis and motility/invasion in both luminal- and basal-molecular-subtype UC cells in vitro. Mint3 depletion in UC cells also attenuated tumour growth and angiogenesis in xenograft models. In addition, pharmacological inhibition of Mint3 sensitized chemo-resistant UC xenografts to gemcitabine.
Conclusions
Our findings indicate that Mint3 is a potential target for UC therapy with or without chemotherapy, independent of the molecular subtype of UC.
1 INTRODUCTION
Bladder cancer (BC) is a common urologic disease with 573 000 cases and 210 000 deaths reported in 2020.1 Urothelial carcinoma (UC) is the most frequent type among BC; less than 10% of UC cases originate in the upper urinary tract, including renal calyces, renal pelvis and ureters.2 The standard regimen for advanced UC has been chemotherapy using cytotoxic agents such as cisplatin and gemcitabine over the last 30 years. However, recently, the introduction of multiple agents targeting immune and oncogenic signalling pathways has changed substantially the treatment strategies for UC. For example, immune checkpoint inhibitors (ICIs), programmed cell death protein 1 inhibitors or programmed death-ligand 1 inhibitor, have been administered as frontline, second-line, or maintenance therapies,3 demonstrating better outcomes than chemotherapy.4 However, the median objective response rate of ICIs remains approximately 21%.5 Recently, molecular-targeted agents such as fibroblast growth factor receptor (FGFR) tyrosine kinase inhibitors and as an advanced type of agent, anti-nectin 4 antibody-drug conjugates (ADC), have been approved for UC.6, 7 However, these drugs still have some limitations: the use of FGFR tyrosine kinase inhibitors is limited to advanced BC cases because the FGFR3 mutation is frequently expressed in non-muscle invasive BC8; enfortumab vedotin, an ADC directed against nectin-4, has a similar incidence of adverse effects as chemotherapy.7 In addition, the effects of these ICIs and molecular-target drugs depend on the molecular subtype of UC.6, 9-11 Therefore, the development of novel molecular-targeted therapies characterized as the most effective with minimal toxicities is required.
Hypoxia-inducible factor-1 (HIF-1) is a transcriptional factor that has a critical role in adaptation to hypoxia by upregulating the gene expressions involved in glycolysis, angiogenesis, invasion and chemoresistance.12-16 HIF-1 consists of a regulatory α-subunit and a constitutive β-subunit and in the presence of sufficient oxygen, HIF-1α is negatively regulated by two types of hydroxylases, HIF prolyl hydroxylase domain-containing proteins (PHDs) and factor inhibiting HIF-1 (FIH-1). While PHDs hydroxylate proline residues and stimulate the degradation of HIF-1α, FIH-1 hydroxylates an asparagine residue of HIF-1α and restricts its transcriptional activity under normoxia.12-16 Oncogenic signals such as the MAPK, PI3K/AKT and mTOR pathways alleviate this oxygen-dependent regulation of HIF-1α, resulting in HIF-1 activation independent of oxygen conditions in cancer cells.16, 17 HIF-1 overexpression is correlated to poor prognoses in many cancers, including UC,18 and the potential efficacy of cancer treatment by targeting HIF-1 has been demonstrated by several studies with various experimental models.16, 18 Contrary to these expectations, the development of a HIF-1 inhibitor has still been a challenging task, probably due to the fact that HIF-1 is essential for both cancer as well as body homeostasis.19-23
Munc18-1-interacting protein 3 (Mint3; also known as amyloid beta precursor protein binding family A member 3, or APBA3) activates HIF-1 in the presence or absence of oxygen by binding to and suspending FIH-1, which hydroxylates an asparagine residue of HIF-1α in an oxygen-dependent manner, thereby, inactivating its transcriptional activity.24 Membrane-type 1 matrix metalloproteinase (MT1-MMP)/MMP14 is required for Mint3 to inhibit FIH-1.17, 25, 26 Therefore, HIF-1 activation through Mint3 activity is limited to cells where MT1-MMP is overexpressed, such as invasive cancer cells, activated macrophages and cancer-associated fibroblasts. Further, a study reports that Mint3 depletion leads to the downregulation of HIF-1 target gene expressions and attenuates tumourigenicity in breast cancer, pancreatic cancer and fibrosarcoma cell lines.17, 25-31 Mint3-deficient mice do not show apparent abnormalities32-34 and administration of Mint3 inhibitors attenuates the tumour growth of breast and pancreatic cancer cells without loss of body weight (b.w.) and tissue damage in mice.35 Thus, Mint3 inhibition may be a good strategy to decrease HIF-1 activity and attenuate tumour progression in various cancers, including UC. Although the attenuation of HIF-1 itself and the PHD-mediated degradation of HIF-1α is well characterized, the relationship between Mint3 expression and prognosis in UC (and other types of cancer) and the role of Mint3-mediated HIF-1 activation in the malignant properties of UC cells remain unclear. To address these questions, we evaluated the correlation between Mint3 expression and clinicopathological factors in two independent UC cohorts derived from BC and upper tract UC (UTUC). Additionally, the influence of Mint3 depletion on the malignant properties of UC cell lines was determined.
2 MATERIALS AND METHODS
2.1 Clinical samples
This study was conducted under appropriate approval by the Institutional Review Board of Kansai Medical University (Nos. 2018036 and 2019209). The medical records of 141 patients who received radical cystectomy for BC and 222 patients who received radical nephroureterectomy for UTUC from 2006 through 2017 were retrospectively reviewed. Cases including non-urothelial histology, synchronous bilateral tumours, presence of metastasis, simultaneous radical nephroureterectomy and radical cystectomy and insufficient pathological materials for immunohistochemistry were excluded from this study. Ultimately, data from 117 BC and 207 UTUC patients were utilized for analysis in this study.
2.2 Clinical data collection
The clinical data retrieved from the medical records of the patients were as follows: age at the time of surgery, sex, treatment information (neoadjuvant or adjuvant chemotherapy) and prognostic data. The definition of recurrence-free survival (RFS) is the duration between surgery and relapse on imaging; bladder relapse was not defined as recurrence in the UTUC cohort. The definition of cancer-specific survival (CSS) is the duration between surgery and death due to UC and overall survival (OS) is surgery and any cause of death.
2.3 Histological evaluation
Hematoxylin and eosin-stained slides were re-evaluated by a urologic pathologist (Chisato Ohe) who was blinded to the clinical outcomes. Histological features, including grade, pathological stage, lymphovascular invasion, surgical margin and divergent differentiation/variant, were assessed according to the 2016 World Health Organisation classification36 and the 2017 UICC TNM staging system.37
2.4 Tissue microarray construction and immunohistochemistry of Mint3
Tissue microarray (TMA) from 2.0-mm cores of a formalin-fixed, paraffin-embedded tissue block was performed with an instrument for tissue arraying (Azumaya Corporation, Tokyo, Japan). Two representative invasive tumour locations also including any areas with variants) were sampled from each case. Immunohistochemistry (IHC) staining was performed on TMA sections (4-μm thick) using Leica Bond-III (Leica Biosystems, Melbourne, Australia). Primary antibodies against Mint3 (1:200; 611380, BD Biosciences, Franklin Lakes, NJ, USA) were visualized using BOND Polymer Refine Detection (Leica Biosystems). Mint3 cytoplasmic staining of tumour cells was semi-quantitatively assessed using the H-score calculated by multiplication of the staining intensity (0 = none; 1 = weak; 2 = moderate; 3 = strong) with the percentage of positive cells (range: 0–300), as previously described.38 The final scores (average H-score for the two cores) were classified into two categories: low, H-score < 20; high, H-score ≥ 20. IHC evaluation was performed by two pathologists (Junichi Ikeda and Chisato Ohe) and discordant patterns were resolved by consensus.
2.5 Immunohistochemical-based molecular subtyping
Molecular subtyping was performed using five primary antibodies that recognize CK5/6, CK14, CK20, GATA3 and UPK2 based on a previous report.38 Sources, dilutions and detection modes of the antibodies are described in Table S1. IHC staining from the TMA was performed using the Ventana Discovery Ultra Autostainer (Roche Diagnostics K.K, Tokyo, Japan), the Dako Autostainer Link 48 (Agilent Technology, Santa Clara, USA) or Leica Bond-III (Leica Biosystems). IHC analysis was performed using the H-score. Hierarchical clustering was conducted to determine molecular subtypes using Heatmapper (http://www.heatmapper.ca/).39
2.6 Cell culture
Human BC T24 and 5637 cells were obtained from the Riken BioResource Center (Tsukuba, Japan). RT4 and RT112 cells were obtained from the American Type Culture Collection (Manassas, VA, USA). Cells were cultured in Dulbecco's modified Eagle medium (DMEM; FUJIFILM Wako, Osaka, Japan) containing 10% fetal bovine serum (FBS), 100 units/ml penicillin and 100 μg/ml streptomycin at 37°C in a humidified incubator with 5% CO2. All cell lines were routinely tested to exclude mycoplasma contamination.
2.7 Vector construction
The sequences of short hairpin RNA (shRNA) targeting each gene were as follows: LacZ: 5′-gcuacacaaaucagcgauuucgaaaaaucgcugauuuguguagc-3′. Mint3: 5′-gccaccgcaucauugagaucacgaaugaucucaaugaugcgguggc-3′ (#1) and 5′- gcgguucuugguccuguaugacgaaucauacaggaccaagaaccgc-3′ (#2). The corresponding DNA sequences were subcloned into a pENTR/U6 TOPO vector (Thermo Fisher Scientific, Waltham, MA, USA) then transferred via recombination into the lentivirus vector, pLenti6 BLOCK iT (Thermo Fisher Scientific). The lentiviral vectors were generated and used according to the manufacturer's instructions.
2.8 Reagents
Naphthofluorescein was synthesized by Sundia MediTech Company (Shanghai, China) at a purity > 95%. Gemcitabine was purchased from Tokyo Chemical Industry (Tokyo, Japan). Dimethyl sulfoxide (DMSO) and 3-(4,5-dimethyl-2-thiazolyl)-2,5-diphenyl-2H-tetrazolium bromide (MTT) were purchased from FUJIFILM Wako.
2.9 Western blotting analysis
After lysing cells with lysis buffer (150 mM NaCl, 50 mM Tris pH 8.0, 1% NP-40) and centrifugation at 20 000 × g for 15 min at 4°C, the supernatants were collected and the total protein content was measured using a Bradford assay (Bio-Rad, Hercules, CA, USA) according to the manufacturer's instructions. Lysates were subjected to sodium dodecyl sulfate-polyacrylamide gel electrophoresis, transferred to polyvinylidene fluoride membrane filters and analyzed by western blotting using a mouse anti-Mint3 antibody (611380; BD Biosciences), mouse anti-HIF-1α antibody (610598; BD Biosciences), mouse anti-β-actin antibody (clone C4; Merck Millipore, Burlington, MA) and horse anti-mouse IgG HRP-linked antibody (7076; Cell Signalling Technology, Danvers, MA, USA).
2.10 Luciferase assay
HIF-1 activity was measured using reporter plasmids pGL4.42 vectors (Promega), which possess hypoxia response elements and express firefly luciferase upon binding with HIF-1. Along with pGL4.42, pRL vectors that express Renilla luciferase (Promega) were used as an internal control. Cells (1 × 10⁵ per well) were seeded in 24-well plates and co-transfected with a reporter plasmid (100 ng) and the internal control pRL vector (10 ng) using Lipofectamine 3000 (Thermo Fisher Scientific). After obtaining the cell lysates, the intensities of luminescence were measured using GloMax 20/20 Luminometer (Promega) to analyze the luciferase activity following the instructions of Dual-Luciferase Reporter Assay System (Promega).
2.11 RNA isolation, reverse transcription and quantitative polymerase chain reaction
Total RNA extracted from cells or tumours with the RNeasy Plus Mini Kit (Qiagen) was subjected to reverse transcription (RT) using the ReverTra Ace quantitative polymerase chain reaction (qPCR) RT Master Mix (TOYOBO, Osaka, Japan). The RT products were analyzed by real-time PCR in a 7300 Real-Time PCR System (Applied Biosystems, Foster City, CA, USA) using KOD SYBR qPCR (TOYOBO) and specific primers (Table S2) as previously described.40, 41 The expression levels of individual mRNAs were normalized to those of ACTB mRNA.
2.12 MTT assay
Cells were seeded in 96-well microplates at (1 × 10³ cells per well) and incubated for 120 h. MTT substrates (final 0.5 mg/ml) were added and the cells were incubated at 37°C for another 4 h. Culturing media were discarded and the generated formazan was dissolved in DMSO before measuring the absorbance at 595 nm using an iMark microplate reader (Bio-Rad).
2.13 Anchorage-independent cell growth assay
Anchorage-independent cell growth assay was performed using the CytoSelect 96-well Cell Transformation Kit (Cell Biolabs, San Diego, CA, USA) according to the manufacturer's instructions. Cells were seeded in 96-well plates (5 × 10³ cells per well) in triplicates, cultured in a semisolid agar media for 8 days and detected in an EnSpire fluorescence plate reader (PerkinElmer, Waltham, MA, USA).
2.14 Measurement of glucose and lactate
Cells were seeded in 24-well plates (2.5 × 10⁴ and 1 × 10⁵ cells per well for T24 and RT112 cells, respectively) in triplicate and cultured for 24 h. Glucose and lactate contents were measured using Glucose-Glo and Lactate-Glo assay kits (Promega) respectively.
2.15 Transwell migration and Matrigel invasion assay
Transwell migration and Matrigel invasion assays were performed as previously described,29, 42 with some modifications. Briefly, 24-well plates were loaded with transwells with 8-μm pore size filters (Corning Inc., Corning, NY, USA) or those coated with 20 μg/well of Matrigel (Corning). DMEM (500 μl) supplemented with 10% FBS was applied to the lower chamber while a 200-μl cell suspension (1 × 10⁴ cells for T24 cells and 5 × 10⁴ cells for RT112 and 5637 cells) was applied to the upper chamber. The plates were incubated at 37°C in a 5% CO2 atmosphere for 8 h or 24 h for the migration assays or the invasion assays, respectively. Cells in the lower chamber were then stained with 0.1% crystal violet solution (Sigma-Aldrich, St. Louis, MO, USA) and counted.
2.16 Tumor growth assay
Mice were maintained under specific pathogen-free conditions. The experiments were conducted following approved protocols by the Animal Care and Use Committees of Kansai Medical University (Nos. 21–131 and 22-007) and also in accordance with the institutional ethical guidelines for animal experiments and the safety guidelines for gene manipulation experiments. The sample size was decided using the statistical analysis of variance and exploratory experiments. BALB/c nude mice were purchased from Clea Japan (Tokyo, Japan). Eight-week-old male BALB/c nude mice were used for examining the tumourigenicity of the cells as previously described.41, 43 Briefly, 1 × 10⁶ RT112 cells suspended in 0.2 ml 50% Matrigel/phosphate buffer saline was injected subcutaneously into the dorsal side of mice. Subsequently, the implanted tumours were measured with callipers on the indicated days and their volumes were calculated using the formula V = (L × W2) / 2, where V is the volume (mm3), L is the largest tumour diameter (mm) and W is the smallest tumour diameter (mm). For the combination therapy with naphthofluorescein and gemcitabine, tumour-inoculated mice were randomly assigned to each experimental group on day 7. Vehicle (saline containing 1% Cremophor EL [Sigma-Aldrich] and 8 mM Na2CO3) or naphthofluorescein (100 mg/kg b.w.) was intraperitoneally injected into mice once daily for five consecutive days, followed by two days off treatment, while vehicle (saline) or gemcitabine (20 mg/kg b.w.) was intraperitoneally injected into mice twice a week. At the end point of tumour growth assays, tumours were collected, weighed by scales and photographed.
2.17 Immunostaining
After preparing sliced specimens from frozen tumour tissues, they were subjected to immunostaining using a rat anti-CD31 antibody (550274; BD Biosciences), rabbit anti-cleaved caspase 3 antibody (9665; Cell Signalling Technology), rabbit anti-Ki67 antibody (RM-9106-S0; Thermo Fischer Scientific), goat anti-rat IgG Alexa Fluor 555 antibody (A-21434; Thermo Fischer Scientific) and goat anti-rabbit IgG Alexa Fluor 488 antibody (A-11034; Thermo Fischer Scientific) as previously described.28, 41 The nuclei were counterstained with Hoechst 33342 and the sections were observed by fluorescence microscopy (BZ-X800; Keyence, Osaka, Japan). The quantification of the positive areas of indicated antibodies was performed using the ImageJ software (National Institutes of Health, Bethesda, MD, USA).
2.18 Statistics
For clinical samples, continuous data are presented as the median and interquartile range. For comparisons of the two groups, Fisher's exact test and Mann–Whitney U test were utilized. RFS, CSS and OS were assessed using the Kaplan–Meier method and a univariate Cox proportional hazards model. All values were calculated using EZR version 1.55 software (Jichi Medical University Saitama Medical Center; Saitama, Japan).44 For all analyses, significance was determined as a p-value < 0.05. For cell and mouse experiments, the two-sided unpaired Student's t-test with Welch's correction and the Dunn's multiple comparison test were used for statistical evaluations using GraphPad Prism software (GraphPad Software Inc., La Jolla, CA, USA), as indicated in each experiment. p-Values defined as significant in this study were <0.05. The A size of the samples was decided by statistical analysis of variance and exploratory experiments.
3 RESULTS
3.1 High Mint3 expression is associated with poor prognoses in UC patients
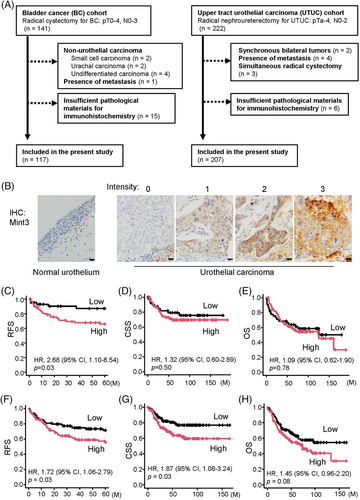
To address whether Mint3 contributes to the progression of UC, we prepared two independent cohorts of UC: the BC (n = 117) and UTUC cohorts (n = 207) (Figure 1A). IHC analyses showed that Mint3 was not expressed in normal urothelial cells at a detectable level but expressed at various levels in UC cells (Figure 1B). We classified the cohorts into high and low Mint3 groups based on the H-score of immunostaining and examined the correlation between Mint3 expression and clinicopathological factors. High Mint3 expression was significantly associated with high pT stage (p = 0.04) in the BC cohort (Table 1) and with high grade (p < 0.001), high pN stage (p = 0.03) and administration of neoadjuvant chemotherapy (p = 0.007) in the UTUC cohort (Table 2). In our exploratory analysis of basal and luminal molecular subtypes using immunohistochemical surrogates,38, 45 Mint3 expression was not associated with any molecular subtype in either cohort (Figure S1A–D), indicating that it is independent of the molecular subtype in UC. Subsequently, we analyzed the association between Mint3 expression and prognosis in the BC and UTUC cohorts. In the BC cohort, a high risk of recurrence was associated with high Mint3 expression (hazard ratio [HR] = 2.68, p = 0.03; Figure 1C), whereas the CSS and OS rates were not significantly different (HR = 1.32, p = 0.50; and HR = 1.09, p = 0.78, respectively; Figure 1D,E). In the UTUC cohort, a high risk of recurrence and cancer-specific mortality was associated with high Mint3 expression (HR = 1.72, p = 0.03 and HR = 1.87, p = 0.03, respectively; Figure 1F,G), whereas the OS rate was not significantly different (HR = 1.45, p = 0.08; Figure 1H). Taken together, our results indicate that a high Mint3 expression is associated with a poor prognosis in two independent UC cohorts, at least to some extent.
| Characteristics | Mint3 Low (n = 45) | Mint3 High (n = 72) | p-Value |
|---|---|---|---|
| Age, year | 72 (68.0–79.0) | 71 (66.0–76.25) | 0.10 |
| Sex | 0.13 | ||
| Female | 11 (24.4) | 9 (12.5) | |
| Male | 34 (75.6) | 63 (87.5) | |
| Grade | 1 | ||
| Low | 0 (0.0) | 1 (1.4) | |
| High | 44 (100.0) | 70 (98.6) | |
| pT stage | 0.04 | ||
| pT0 | 0 (0.0) | 1 (1.4) | |
| pTa | 0 (0.0) | 1 (1.4) | |
| pTis | 1 (2.2) | 2 (2.8) | |
| pT1 | 5 (11.1) | 4 (5.6) | |
| pT2 | 8 (17.8) | 30 (41.7) | |
| pT3 | 26 (57.8) | 24 (33.3) | |
| pT4 | 5 (11.1) | 10 (13.9) | |
| pN stage | 0.81 | ||
| pNx | 2 (4.4) | 7 (9.7) | |
| pN0 | 28 (62.2) | 45 (62.5) | |
| pN1 | 6 (13.3) | 6 (8.3) | |
| pN2 | 8 (17.8) | 12 (16.7) | |
| pN3 | 1 (2.2) | 2 (2.8) | |
| Lymphovascular invasion | 0.07 | ||
| Absent | 6 (13.3) | 21 (29.6) | |
| Present | 39 (86.7) | 50 (70.4) | |
| Surgical Margin | 0.72 | ||
| X | 0 (0.0) | 1 (1.4) | |
| Absent | 39 (86.7) | 64 (90.1) | |
| Present | 6 (13.3) | 6 (8.5) | |
| Divergent differentiation/variant | 0.07 | ||
| Pure UC | 27 (60.0) | 51 (70.8) | |
| UC with squamous differentiation | 9 (20.0) | 13 (18.1) | |
| UC with glandular differentiation | 1 (2.2) | 2 (2.8) | |
| Micropapillary variant | 3 (6.7) | 5 (6.9) | |
| Plasmacytoid variant | 0 (0.0) | 1 (1.4) | |
| Sarcomatoid variant | 5 (11.1) | 0 (0.0) | |
| Neoadjuvant chemotherapy | 0.51 | ||
| No | 40 (88.9) | 67 (93.1) | |
| Yes | 5 (11.1) | 5 (6.9) | |
| Adjuvant chemotherapy | 0.24 | ||
| No | 27 (60.0) | 51 (70.8) | |
| Yes | 18 (40.0) | 21 (29.2) | |
| Median follow-up months | 100.72 (79.9–124.3) | 83.3 (62.5–119.6) | 0.25 |
- Data are presented as n (%) or median (interquartile range).
- UC: urothelial carcinoma.
| Characteristics | Mint3 Low (n = 94) | Mint3 High (n = 113) | p-Value |
|---|---|---|---|
| Age, year | 71 (68.0–75.8) | 73 (67.0–79.0) | 0.09 |
| Sex | 0.23 | ||
| Female | 25 (26.6) | 39 (34.5) | |
| Male | 69 (73.4) | 74 (65.5) | |
| Grade | <0.001 | ||
| Low | 22 (23.4) | 7 (6.2) | |
| High | 72 (76.6) | 106 (93.8) | |
| pT stage | 0.11 | ||
| pTa | 25 (26.6) | 21 (18.6) | |
| pTis | 2 (2.1) | 0 (0.0) | |
| pT1 | 19 (20.2) | 18 (15.9) | |
| pT2 | 7 (7.4) | 17 (15.0) | |
| pT3 | 37 (39.4) | 46 (40.7) | |
| pT4 | 4 (4.3) | 11 (9.7) | |
| pN stage | 0.03 | ||
| pNx | 1 (1.1) | 3 (2.7) | |
| pN0 | 83 (88.3) | 83 (73.5) | |
| pN1 | 3 (3.2) | 14 (12.4) | |
| pN2 | 7 (7.4) | 13 (11.5) | |
| Lymphovascular invasion | 0.12 | ||
| Absent | 46 (48.9) | 43 (38.1) | |
| Present | 48 (51.1) | 70 (61.9) | |
| Surgical Margin | 0.15 | ||
| Absent | 91 (96.8) | 103 (91.2) | |
| Present | 3 (3.2) | 10 (8.8) | |
| Divergent differentiation/variant | 0.63 | ||
| Pure UC | 87 (92.6) | 98 (86.7) | |
| UC with squamous differentiation | 4 (4.3) | 9 (8.0) | |
| UC with glandular differentiation | 2 (2.1) | 4 (3.5) | |
| Sarcomatoid variant | 1 (1.1) | 2 (1.8) | |
| Neoadjuvant chemotherapy | 0.007 | ||
| No | 93 (98.9) | 102 (90.3) | |
| Yes | 1 (1.1) | 11 (9.7) | |
| Adjuvant chemotherapy | 0.39 | ||
| No | 77 (81.9) | 86 (76.1) | |
| Yes | 17 (18.1) | 27 (23.9) | |
| Median follow-up months | 79.8 (51.7–98.7) | 65.4 (45.9–84.0) | 0.08 |
- Data are presented as n (%) or median (interquartile range).
- UC: urothelial carcinoma.
3.2 Mint3 depletion attenuates HIF-1 activity in UC cells
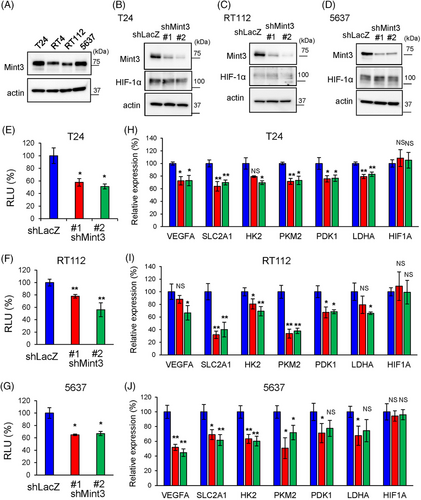
Based on the association between high Mint3 expression and poor prognosis in two independent UC cohorts, we examined whether Mint3 depletion can attenuate the malignant features of UC cells in vitro. We confirmed the comparable expression in human BC cell lines, T24, RT4, RT112 and 5637 cells, by western blot (Figure 2A). According to the molecular subtypes previously reported,46 T24 cells are classified as the non-type, RT4 and RT112 cells as the luminal and 5637 cell as the basal subtype, respectively. Thus, we chose T24, RT112 and 5637 cells for further analyses and Mint3 was stably depleted in these cell lines by shRNA-expressing lentiviral vectors. We first addressed the relationship between Mint3 depletion and HIF-1 in UC cells. Mint3 depletion did not affect HIF-1α protein levels (Figure 2B–D). In contrast, reporter assays showed that Mint3 depletion attenuated HIF-1 activity in T24, RT112 and 5637 cells (Figure 2E–G). These results agree with previous studies using other cells, such as pancreatic and breast cancer cells, which reported that Mint3 attenuates HIF-1 transcriptional activity but not HIF-1α protein levels.25, 29, 31, 40 Subsequently, the expression levels of HIF-1 target genes were analyzed by RT-qPCR. Mint3 depletion attenuated mRNA levels of HIF-1 target genes (VEGFA, SLC2A1, HK2, PKM2, PDK1 and LDHA) but not of HIF-1α itself (HIF1A) in T24, RT112 and 5637 cells (Figure 2H–J). Taken together, our results show that Mint3 depletion attenuates HIF-1 activity in UC cells.
3.3 Mint3 depletion attenuates glycolysis in UC cells
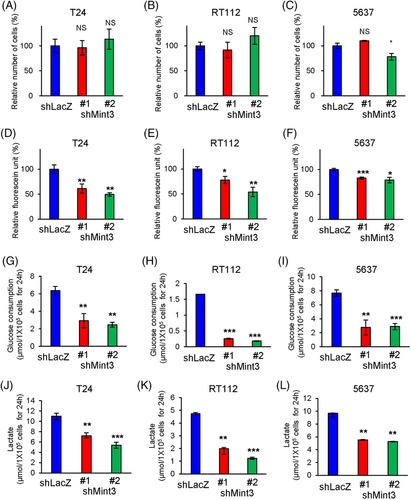
The effects of Mint3 depletion on cell proliferation depend on cancer type: it attenuates cell proliferation in pancreatic cancer but not in breast cancer and fibrosarcoma.25, 29, 31, 40 We examined whether Mint3 depletion affects cell functions in UC cells. We analyzed proliferation in T24, RT112 and 5637 cells and found that Mint3 depletion did not affect the proliferation of these cells except 5637 shMint3#2 cells (Figure 3A–C). Thus, Mint3 depletion did not affect UC cell proliferation. We further analyzed whether Mint3 depletion affects anchorage-independent growth in UC cells. Interestingly, Mint3 depletion attenuated anchorage-independent growth in T24, RT112 and 5637 cells (Figure 3D–F). HIF-1 promotes the expression of glycolysis-related genes,13, 15, 16 and Mint3 depletion attenuated their expression in T24, RT112 and 5637 cells (Figure 2H–J). This prompted us to examine the glycolytic activities in control and Mint3-depleted UC cells. Mint3 depletion attenuated glucose consumption (Figure 3G–I) and lactate production (Figure 3J–L) in T24, RT112 and 5637 cells. Thus, Mint3 depletion attenuates glycolytic activity in UC cells.
3.4 Mint3 depletion attenuates motility and invasion in UC cells
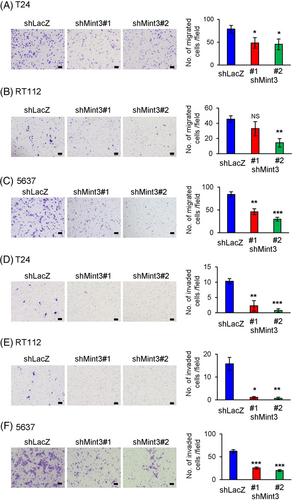
In the UTUC cohort, high Mint3 expression correlated with lymph node metastasis (Table 2). While Mint3 promotes metastasis in inflammatory monocytes,28, 47 it remains unclear whether it promotes invasive activity in cancer cells, especially UC cells. Transwell migration assays showed that Mint3 depletion decreased the motility of T24, RT112 and 5637 cells (Figure 4A–C). Interestingly, Mint3 depletion more strikingly attenuated the invasion into Matrigel than the motility (Figure 4D–F). Thus, Mint3 depletion attenuates invasive activity in UC cells. Importantly, HIF-1 depletion by siRNA decreased HIF-1 target gene expression and malignant properties such as anchorage-independent growth, glucose consumption, lactate production, migration and invasion comparable to Mint3 depletion. The difference between control and Mint3-depleted cells became negligible when HIF-1 was depleted in UC cells (Figures S2–S5). These results indicate that Mint3 enhances malignant properties via HIF-1 in UC cells.
3.5 Mint3 depletion attenuates tumourigenicity in RT112 cells
The observations that Mint3 depletion attenuates the expression of HIF-1 target genes and malignant properties, such as glycolytic activity, motility and invasion, of T24, RT112 and 5637 cells prompted us to examine whether it affects tumourigenicity in UC cells. Preliminary experiments showed that, under our experimental conditions, RT112 cells form growing tumours, while T24 and 5637 cells form small tumours that remain dormant for more than 6 weeks in nude mice. Thus, we focused on RT112 cells for further in vivo experiments. Compared to control cells, Mint3-depleted RT112 cells showed decreased tumour growth and weight at the end point (Figure 5A,B). Histological analyses showed that RT112 cells formed tumour nests surrounded by the stroma in nude mice and Mint3 depletion did not affect their histology (Figure 5C). Then, the expression levels of HIF-1 target genes in tumours from control and Mint3-depleted RT112 cells were analyzed. Mint3 depletion attenuated the expression levels of HIF-1 target genes but not HIF-1α mRNA levels (Figure 5D). Decreased mRNA expression of VEGFA in tumours from Mint3-depleted RT112 cells prompted us to examine tumour angiogenesis. CD31+ endothelial cells were present in the stroma surrounding tumour nests; Mint3 depletion decreased the CD31+ areas in tumours from RT112 cells (Figure 5E). Thus, Mint3 depletion attenuates tumour angiogenesis in RT112 cells. We further analyzed apoptosis and proliferation in tumours from RT112 cells. Mint3 depletion increased the levels of cleaved caspase 3, an apoptotic cell marker, while decreasing the levels of Ki67, a proliferation marker, in tumours from RT112 cells (Figure 5F,G). Taken together, Mint3 depletion affects both apoptosis and proliferation in tumours from RT112 cells.

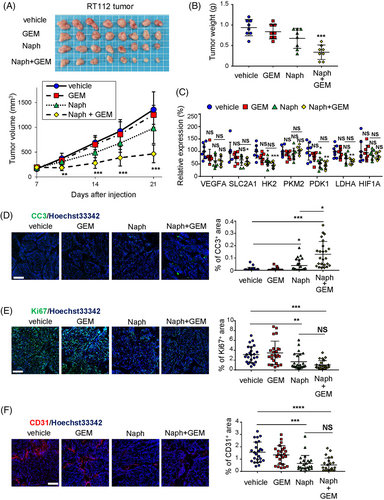
3.6 Pharmacological inhibition of Mint3 sensitizes tumours from RT112 cells to gemcitabine
UC can be divided into two molecular subtypes, basal and luminal. The luminal subtype is less sensitive to chemotherapy than the basal subtype.10 RT112 cells are classified as a luminal subtype.46 Thus, we examined whether pharmacological inhibition of Mint3 elicited additional/additive effects to gemcitabine treatment in tumours derived from RT112 cells. Gemcitabine treatment did not decrease tumour growth, reflecting a characteristic phenotype of the luminal subtype (Figure 6A,B). Administration of naphthofluorescein, a Mint3 inhibitor with no apparent toxicity in vivo,35 partially decreased tumour growth, although this was not statistically significant (Figure 6A,B). Intriguingly, when naphthofluorescein was administered, gemcitabine treatment suppressed tumour growth (Figure 6A,B). Administration of naphthofluorescein, gemcitabine, or both, in mice did not show apparent adverse effects such as weight loss (Figure S6). Administration of naphthofluorescein attenuated the expression of HIF-1 target genes less efficiently than Mint3 depletion and gemcitabine administration did not affect expression of these genes in tumours from RT112 cells (Figure 6C). Then, we analyzed apoptosis, proliferation and angiogenesis in tumours of RT112 cells from treated mice. The administration of naphthofluorescein alone slightly increased the area of cleaved caspase 3, an apoptotic cell marker, whereas the combined administration of naphthofluorescein and gemcitabine strikingly increased it (Figure 6D). In turn, administration of naphthofluorescein alone moderately attenuated proliferation and angiogenesis, but the combined administration of naphthofluorescein and gemcitabine did not enhance these effects (Figure 6E,F). Taken together, our results show that pharmacological inhibition of Mint3 sensitizes tumours derived from RT112 cells to gemcitabine.
4 DISCUSSION
Mint3 activates HIF-1 transcriptional activity in both normoxic and hypoxic conditions in cancer cells and some tumour stromal cells.25, 26, 28-30 Previously, Mint3-mediated malignant properties of breast cancer, pancreatic cancer and fibrosarcoma have been characterized in cancer cell lines and mouse xenograft models.25, 29, 31, 40 Although co-expression of Mint3 and Skp2 was analyzed in pancreatic cancer specimens,29 the association between Mint3 expression and the clinicopathological factors/prognosis has not been addressed in any clinical cancer samples. Therefore, we addressed the association between Mint3 protein expression in BC and UTUC cohorts for the first time. Compared with BC, UTUC is a relatively rare tumour, which comprises only 5%–6% of all UCs.2, 48 Because of the smaller number of UTUC cohorts, most clinical decisions regarding UTUCs derive from the evidence from BC cohorts.48 In fact, among the major urological or oncological societies, such as the European Association of Urology (EAU), National Cancer Network, American Urological Association and International Congress of Urology, only EAU has published UTUC guidelines.48 Practical, anatomical, biological and molecular differences between UTUC and BC have been shown in a previous study.49 In the present study, we demonstrated a similar trend in the association between Mint3 expression and clinicopathological factors and prognosis in BC and UTUC cohorts. Therefore, validation in the two UC cohorts allowed us to demonstrate the clinical significance of Mint3 regardless of the urothelial origin. As a limitation of the present study, Mint3 expression was evaluated in the UC cohorts from a single centre. Future multicenter studies will strengthen the importance of Mint3 expression in UC.
Recently, six consensus molecular subtypes of UC have been identified using sequencing: luminal papillary, luminal unstable, luminal non-specified, stroma-rich, basal/squamous and neuroendocrine-like.50 The clinical relevance of these molecular subtypes based on mRNA signatures differs for each classification. Neoadjuvant chemotherapy and ICIs are more effective in the basal than in the luminal subtype.10, 11 In contrast, FGFR inhibition and enfortumab vedotin targeting nectin-4 may have therapeutic effects on the luminal subtype.6, 9 Despite the availability of information for personalized therapy, gene expression analyses for molecular classification cannot be routinely applied owing to financial and technical issues. Thus, we utilized molecular classification based on IHC, which is easy to use in daily clinical practice.45 In the current study, we showed that Mint3 expression was independent of the IHC-based molecular subtype in two independent UC cohorts (Figure S1A–D). In addition, Mint3 depletion attenuated HIF-1 activity, glycolysis and motility/invasion in both basal-type 5637 and luminal-type RT112 cells.46 Thus, Mint3 inhibitors display a unique property, as they could potentially be effective interventions for UC independently of the molecular subtype. Even though Mint3 depletion by stable shRNA expression attenuated the tumour growth of RT112 cells, the Mint3 inhibitor naphthofluorescein alone could not significantly decrease the progression of the tumour. This discrepancy might be attributed to the insufficient inhibition of Mint3 by naphthofluorescein compared to the stable Mint3 knockdown by shRNA. Thus, more effective and durable Mint3 inhibitors must be developed for clinical use.
Although Mint3 activates HIF-1, thereby promoting tumour malignancy in various cancer, the target genes of the Mint3–HIF-1 axis depend on the cancer type, probably because epigenetic alterations define the accessibility of HIF-1 to its binding sites on target genes. For example, the Mint3–HIF-1 axis promotes Skp2 expression specifically in pancreatic cancer and Mint3-mediated malignant properties in pancreatic cancer mainly depend on Skp2.29 Skp2 is a proto-oncogene that controls cell cycle and epithelial-mesenchymal transition.51 Mint3 depletion attenuates cell proliferation, motility and chemoresistance by decreasing Skp2 expression in pancreatic cancer cells.29 Mint3 depletion also attenuated motility but did not affect proliferation in UC cells except 5637 shMint3#2 cells, indicating that these cells take advantage of the Mint3–HIF-1 axis in a different manner from pancreatic cancer cells. In addition, Mint3 depletion affected invasion more severely than motility in UC cells. HIF-1 promotes the expression of not only motility-related but also invasion-specific genes, such as adhesion molecules and degradation enzymes of the extracellular matrix.12, 13, 15, 16 Thus, various HIF-1 target genes contribute to the Mint3-mediated malignant properties in UC. Interestingly, pharmacological inhibition of Mint3-sensitized tumours derived from RT112 cells to gemcitabine. The combination of gemcitabine and naphthofluorescein enhanced the effects of naphthofluorescein on apoptosis but not on HIF-1 target gene expression, proliferation and tumour angiogenesis in tumours from RT112 cells. These imply that naphthofluorescein might attenuate the expression of some HIF-1 target genes involved in chemoresistance and thereby enhance the effect of gemcitabine on tumour growth rather than the possibility that gemcitabine would enhance the HIF-1 suppression activity of naphthofluorescein. In addition, although in the present study we focused on the function of Mint3 in UC cells, systemic inhibition of Mint3 can as well affect tumour stromal cells, such as cancer-associated fibroblasts and macrophages; in cancer-associated fibroblasts, Mint3 promotes tumour growth in breast cancer; in macrophages, it promotes metastasis in melanoma, breast cancer and lung cancer.28, 30, 47 Thus, we cannot exclude the possibility that Mint3 in stromal cells also contributes to chemoresistance in UC. Future studies will unveil the roles of Mint3 in the stromal cells of UC.
5 CONCLUSION
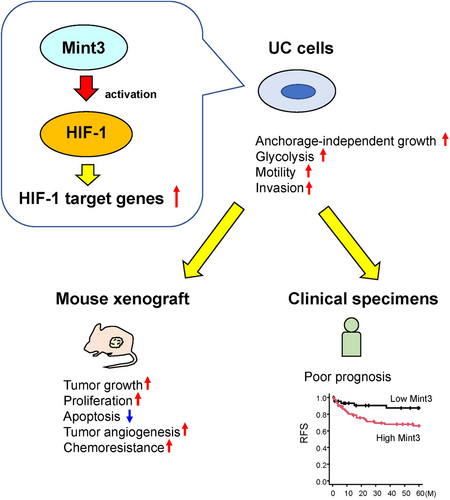
In this study, we showed that high Mint3 expression correlates with poor prognoses in patients with UC in two independent cohorts. Mint3 depletion in T24, RT112 and 5637 BC cell lines attenuated malignant features such as anchorage-independent growth, glycolysis, motility and invasion along with decreased HIF-1 target gene expression in vitro. Mint3 depletion attenuated tumour growth in RT112 cells and its pharmacological inhibition sensitized RT112 tumours to gemcitabine (Figure 7). Altogether, our findings indicate that Mint3 is a possible target for UC therapy with or without chemotherapy.
ACKNOWLEDGEMENT
The authors acknowledge the assistance provided by Ryosuke Yamaka in tissue microarray construction.
CONFLICT OF INTEREST
The authors declare that they have no conflict of interest.


