Measurement of Dissolved Gas Content in a Hydrocarbon-Based Liquid Using Gas Chromatography
Abstract
The content of dissolved gases in a working liquid can influence outgassing and system properties. A method is presented for determining the dissolved gas content of oxygen, nitrogen, and carbon dioxide in a hydrocarbon-based liquid using gas chromatography. The sampling facility and routine is presented. Various factors influence the gas content such as the sampling position, the preheating time, and the constancy of liquid temperature. Reaching equilibrium between dissolved gases and atmospheric gases is a slow process, requiring sufficient heating and stirring.
1 Introduction
In many technical systems, liquids are used to transport mass or energy, for example in the form of enthalpy. Usually, if no special treatments are provided, the liquid contains dissolved gas depending on the conditions in the system. Here, the working liquid can be in direct contact with gases, e.g., in a tank, which is also partially filled with air. Then, interaction at the interface can occur by gas dissolving in the liquid if not already in an equilibrium state.
The dissolution of gas in water was studied in the early work of Henry [1] and was found to be dependent on pressure and temperature. Later, Pollak conducted experiments for liquids, other than water [2]. Still, the dissolution of gas in real systems is hard to predict, because it depends on multiple factors, for example the molecular structure. The dissolved gas can outgas in cases with changed temperatures or pressure conditions inside the system which results in dispersed gas in the form of bubbles. Because the absorption of gas from the bubbles back into the liquids occurs on large timescales, bubbles can remain in the pipes [3]. To this end, dissolved and undissolved gas can influence the behavior of a system and is mostly undesirable.
Dissolved gas does not influence the thermodynamic properties of the liquid like density or viscosity. However, dissolved oxygen, e.g., induces corrosion of metal surfaces in a piping system [4, 5]. Therefore, for the design of technical systems, the gas content can be of interest. Since the prediction of the gas content dissolved in the liquid is not straightforward for complex situations found in technical applications, the measurement of the gas content becomes necessary. Moreover, obtaining the gas content allows to estimate the potential of outgassing in a system due to gas cavitation [6, 7]. This, and additional effects, are important not only for water, but also in systems where hydrocarbon-based liquids are used as a working fluid. The database on the measurement of gas content in those liquids is poor. In this work, an approach to measure the gas content for a hydrocarbon-based liquid using gas chromatography (GC) is presented. The sampling process is described and some influences of the sampling procedure on the results are discussed.
This work is laid out as follows. In Sect. 2, the investigated test facility, from which the sample was taken, is briefly introduced before describing the sampling process in detail. Moreover, the setup of the GC device is presented and the measurement principle explained. Factors with impact on the results of the sampling process are discussed in Sect. 3. Finally, in Sect. 4, the conclusions are stated together with the perspectives.
2 Test Facility and Gas Chromatography Setup
The test facility was designed for fundamental investigations of multiphase flow phenomena in a hydrocarbon-based liquid. A detailed description of the facility was given by Frense et al. [8]. For this work, only parts of the setup are presented which are assumed to influence the gas content of the liquid. The hydraulic scheme is sketched in Fig. 1.
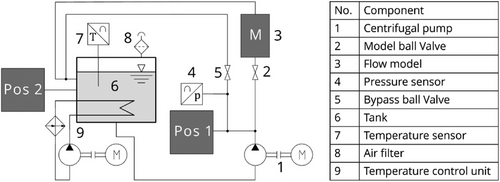
Liquid flow is driven by a centrifugal pump (1). If the ball valve (2) is open, the liquid gets transported to the model geometry (3). Here, air bubbles with a diameter of db = 500 µm are injected into the flow to study their behavior. The presence of small number of air bubbles has no influence on the gas content, which is discussed in Sect. 3. No significant pressure drop over the model geometry is observed during experiments so that the gas solubility is unchanged.
A bypass with a directional control valve, which is not shown in the hydraulic setup, was installed to control the volume flow rate through the model. The pressure in the bypass is measured with a pressure sensor (4). The flow through the bypass can be controlled by a ball valve (5). The first sampling position (Pos. 1 in Fig. 1) is provided in the bypass branch. To collect a liquid sample, the pressure in the bypass is set higher than the pressure in the sampling container by adjusting the ball valve (5). More details on the sampling process are provided below.
The liquid from the model or the bypass reaches the tank (6), where the liquid is stored. A temperature sensor (7) is installed in the tank to measure the temperature. Ambient pressure in the tank is ensured by installing an open filter unit (8) at the lid of the tank. Therefore, the tank is technically open with a liquid-gas interface, where gas diffusion into the liquid occurs until reaching a state of equilibrium with the surrounding air. The tank is equipped with an internal heat exchanger connected to a water-based heating circuit (9). The temperature of the liquid equals T = 50 °C and can be kept constant in a range of ±3 K during experiments. The tank outlet is located at the bottom of the tank to prevent bubbles from re-entering the pipe system. No manual stirring is carried out but due to the design of the tank inlet enough momentum is provided for the mixing of the liquid in the tank. The second sampling position (Pos. 2 in Fig. 1) is directly connected to the tank wall. Details on the sampling process at this position are described below, as well.
For sampling in liquid circuits, a sampling board is required as the connection between the system and the sampling cylinder. In Fig. 2 the setup of the sampling board is shown connected to the tank.
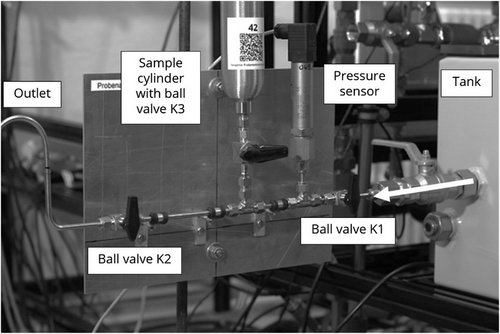
The mobile sampling board consists of the following components, which are listed in the direction of flow. First, the ball valve K1 is used to shut off the sampling board. Next, the pressure sensor is required to fill the bottle to the desired level. This is followed by the T-junction fitting to connect the ball valve K3 and the sampling cylinder. Finally, the through-going branch of the T-junction fitting is connected to the outlet for draining the system medium via the ball valve K2. This is used to flush the sampling board and to allow the helium to escape in a controlled manner until ambient pressure is reached in the cylinder.
Sampling is carried out at three different sampling positions to determine the effect of these: bypass (see Pos. 1 in Fig. 1), tank of the test facility (see Pos. 2 in Fig. 1) and, third, fresh liquid from the barrel (not shown in Fig. 1). Due to the different pressure at the three points, an adapted sampling procedure is necessary in each case. At the bypass it is possible to set the absolute pressure to at least 2 bar, which is required for the standard sampling procedure. Sampling at the open tank and of fresh fluid from the barrel is carried out at ambient pressure. For this reason, the new method of low-vacuum sampling was developed for sampling under these conditions.
The following sampling procedure was applied. The first step is the conditioning of the sample cylinder to remove residual gases from the inside. To achieve this, the sample cylinder is evacuated several times and flushed with helium. Then, a test measurement is carried out to check whether the measured values of oxygen/argon and nitrogen do not exceed a specific value, which is 30 ppm for N2 and 10 ppm for O2/Ar. If this is the case, the cylinder is filled with helium for the standard procedure to an absolute pressure of 2.2 bar or for the low-vacuum sampling to 0.4 bar.
The second step is the sampling itself. This requires a gas-tight connection of the sampling board to the liquid and sufficient flushing of the sampling board pipes. For the standard sampling procedure, the helium is released in several small pulses via the ball valve K2 through the pipes immersed in a spare liquid bath to ambient pressure. The ball valves K1 and K2 are then closed. Next, the sample cylinder is filled to approximately 50–67 % with sample liquid, whereby the sampling liquid flows into the cylinder due to the higher pressure of the system. The sampling yields the compression of helium in the sampling cylinder. Filling the sample cylinder to two thirds results in a sample pressure of approximately 3 bar. For low-vacuum sampling the sample cylinder is filled until ambient pressure is reached, whereby the sampling liquid flows into the bottle due to the lower pressure in the cylinder and compresses the helium. The cylinder is then filled to approximately 60 % with sample liquid.
The most important step is establishing the thermodynamic equilibrium. During transport, most of the dissolved gases desorb from the liquid into the helium gas phase, as the partial pressure there is zero for all other gases at the beginning.
Finally, the determination of the gas content in the liquid sample using GC is carried out. A GC system is employed to determine the mass fraction of specific gases in the gas phase of liquid samples or in pure gas samples. Tab. 1 lists the most important technical data of the hereby used GC system.
| Parameter | Specifications |
|---|---|
| Manufacturer | Teckso (Gas chromatograph: Agilent) |
| Carrier gas | Helium |
| Columns | Hayesep Q, Hayesep QQ, Molsieb 5 Å |
| Analyzed gases | H2, O2/Ar, N2, CO2, CH4, CO |
| Acquisition time | 4.7–8.8 min |
| Detector | Thermal conductivity detector |
| Sample loop volume | 200 µL |
Fig. 3 shows the setup of the GC system. It includes the gas chromatograph itself, which is used to determine the substance proportions. Moreover, the system is equipped with two vacuum pumps and a back pressure regulator with a helium connection. These enable the sample bottle and pipes to be evacuated and flushed during conditioning.

In a GC measurement, the only manual step is to connect the sample cylinder to the 6-mm Swagelok fitting. All subsequent processes in the GC system are semi-automated and are divided into the following steps.
As a first step, the pipe is flushed. The analyzed gases oxygen and nitrogen are the main components of the ambient air which can enter the GC system when the cylinders are connected and disconnected and via diffusion through the screw connections. Therefore, flushing the pipes with helium is an essential step before every measurement. This ensures that the pipes only contain residues of a maximum of 10 ppm oxygen and 20 ppm nitrogen to guarantee that the measurements are not falsified by residual gas components. When flushing the pipes, they are first evacuated to below 10 mbar by means of two vacuum pumps and then pressurize with helium. This is usually repeated about five times.
Next, the liquid from the ball valve is removed. After flushing (see the first step), the pipe is filled with helium to a pressure pP that is approximately 0.5 bar above the cylinder pressure pS. The ball valve of the sample cylinder is then opened briefly causing the helium to flow into the cylinder due to the lower pressure inside and forcing any solvent in the ball valve into the cylinder. As soon as the pressure pS,P is equalized in the sample cylinder and in the pipes, the ball valve is closed again.
After purging the ball valve, there is a waiting time of half an hour to ensure a sufficient mixing of the helium with the gas phase in the sample cylinder. During this waiting time, the GC pipes are flushed again. This is followed by evacuation to approximately 4 mbar. When the minimum pressure is reached, a signal tone sounds indicating that the sample can be loaded. This is realized by slowly opening the ball valve of the cylinder until a constant pressure is reached in the pipe. As the first sample often does not yet reflect the actual gas content of the gas phase, it is discarded. This is done by flushing the pipes again and then evacuating them, so that a new part of the gas phase of the sample can be loaded and analyzed.
In order to ensure that the GC measurements are reproducible and calibration is possible, all measurements must be carried out at a constant pressure in the sample loop. For this, the GC uses a vacuum pump to reduce the pressure in the sample loop to approximately 800 mbar. Once this pressure is reached, a valve is switched to transport the gas in the sample loop to the separation columns using the carrier gas helium. The core part of the gas chromatograph contains three separation columns, which are responsible for separating the gases into individual peaks. First, there is the precolumn Hayesep Q. The precolumn is switched to backflush after all the analyzed gases flowed through the column, i.e., it flows backwards. This serves to prevent water vapor contained in the gas sample from reaching the two connected separation columns Hayesep QQ and Molsieb 5A. These are used to separate the individual gases. The thermal conductivity detector is connected to the columns. Helium and the gases coming from the columns flow through this alternately. If a gas other than helium flows through the detector, the conductivity changes. This is captured as a differential voltage, which is shown in the chromatogram.
Then, the proportions of the substances can be calculated by the evaluation software of the GC system. Using a calibration function, the corresponding proportions of the individual gases are determined from the areas under the recorded curves and the results are then output in a conventional file format. The calculated integral indicates the amount of gas in the gas phase of the sampling cylinder. Because no solubility coefficients are known for the measured hydrocarbon-based liquid, it is not possible to calculate the quantity of remaining gas in the liquid phase. For this reason, the values calculated in this work must be interpreted as the minimum gas content.
3 Investigated Influences on Gas Content Measurement
Different influences on the dissolved gas content measurement in the hydrocarbon-based liquid for the present case were investigated. These are the temperature, ageing of the hydrocarbon-based liquid, sampling position, and heating time. Tab. 2 displays temperature and pressure conditions for the nine different samples resulting from the three sample positions.
| Sample | Temp. [°C] | Absolute pressure [bar] |
|---|---|---|
| Bypass 1 | 53 | 2.5 |
| Bypass 2 | 56 | 2.51 |
| Bypass 3 | 54 | 3.0 |
| Tank 1 | 52 | 0.97 |
| Tank 2 | 55 | 0.99 |
| Tank 3 | 28 | 0.98 |
| Storage container 1 | 47.7 | 0.96 |
| Storage container 2 | 50.4 | 0.96 |
| Storage container 3 | 24.6 | 0.96 |
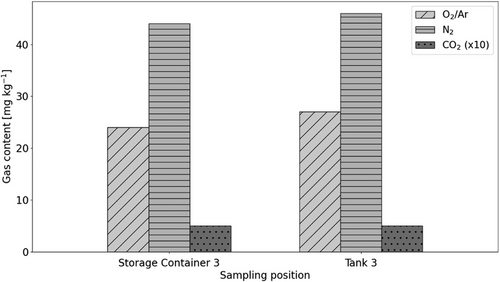
As the first influence, ageing was investigated by measuring the gas content of both, liquid from the storage container, which is considered as new, and liquid from the tank, which was in use for approximately 300 operation hours. Ageing depends on multiple factors. Here, it results from the relatively long operation time. Other effects like cavitation or increased content of particles due to abrasion of components do not occur at the experiments. Fig. 4 displays the results of the storage container and the tank at approximately 25 °C. As the liquid was in contact with the atmosphere for a sufficiently long time in each case, it can be assumed that a state of equilibrium was established in both cases. Slightly higher oxygen and nitrogen contents were measured in the tank compared to the storage container, which can be attributed to the slightly higher temperature in the tank. It can therefore be concluded that no significant ageing occurs under the specific conditions of the experiments carried out.
Samples at higher temperatures and all positions were taken to determine the influence of the sampling position, the temperature, and to demonstrate reproducibility. Fig. 5 shows the sampling results from bypass and tank at approximately 50 °C. Three samples were taken from the bypass and two samples from the tank. The third sampling from the bypass was preceded by a significantly longer operation time of the test facility at 50 °C compared to the previous samples.
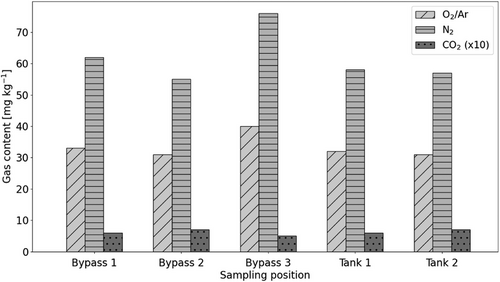
Compared to the sample at 25 °C, which is depicted in Fig. 4 for the tank, significantly higher oxygen and nitrogen gas contents were measured. This demonstrates that the solubility of the analyzed liquid increases with higher temperature. All samples show a very low carbon dioxide content in the range of 0.5–0.7 mg kg−1.
The two samples from the tank, as seen in Fig. 5, have almost the same oxygen and nitrogen content. Therefore, reproducibility can be assumed. If only the first two samples from the bypass and the two samples from the tank are compared, the gas content of the two tank samples lies between the results of the two bypass samples with deviations of up to 8 %. That is approximately the accuracy of the measuring method of 10 %. It can therefore be assumed that the sampling position has only a minor influence on the result. More uniform results are obtained from the tank. It is possible that influences such as different pressures at the bypass affect the results.
The three samples from the bypass show a clear deviation of the gas content. The first two samples feature lower oxygen and nitrogen contents than the third sample. For the third sample, the test facility was operated for a significantly longer time. This indicates that the dissolution process occurs relatively slow and therefore a long time is required to establish a state of equilibrium. It is known that this is also the case with water and water-glycol mixtures (see, e.g., [10]). It is not clear whether equilibrium has already been reached in sample 3.
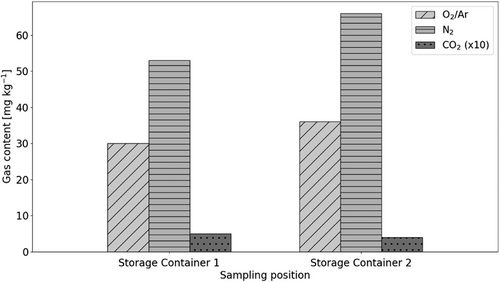
The influence of the heating time at 50 °C on the gas content was also analyzed using liquid from the storage container. Fig. 6 compares the results for a short heating time with little stirring (Storage Container 1) and a long heating time with much stirring (Storage Container 2). The investigation shows that the oxygen and nitrogen content increase significantly with a longer establishing time to reach the state of equilibrium. The oxygen content increases by 19 %, while the nitrogen content increases by 24 %. This proves once again that the dissolution process occurs on a relatively large time scale.
4 Conclusions and Perspectives
The test facility, of which liquid samples were taken, and a method for determining the dissolved gas content in a hydrocarbon-based liquid were presented. This requires a sampling board to take samples and a gas chromatograph system to analyze them. The characteristics and the sampling procedure were explained [9]. It should be noted that due to the unknown solubility coefficients for the hydrocarbon-based liquid with the analyses only a minimum value of the gas content is determined because the amount of gas remaining in the liquid is not known.
A method for sampling at atmospheric pressure was developed and presented. Due to the gas-tight design of the sampling board, the possibility of gas leaking into the pressurized cylinder can be neglected. Various influences on the gas content of the investigated hydrocarbon-based liquid were analyzed. Samples were taken at temperatures of approximately 25 °C and 50 °C at three different sampling positions. The results indicate that the gas solubility for oxygen and nitrogen increases with higher temperatures, while the carbon dioxide content remains constant at a low level. Reproducibility of the results can be assumed. Furthermore, no difference between the results of fresh and used oil, which was in operation for 300 h, was found. However, it was shown for the storage container that it takes a relatively long time to reach equilibrium with the atmosphere. Consequently, a long heating time and much stirring of the liquid before the sampling is essential for accurate results.
Possible actions to improve the accuracy of the results include heating up the test facility with the tank lid open to ensure a constant air atmosphere and ensure constant stirring in the tank during this time. It is assumed that air bubbles, which were injected during the samplings, did not enter the sample cylinder, because the bubbles were transported directly into the tank and separated there. The results demonstrate that very large quantities of nitrogen and oxygen are dissolved in the hydrocarbon-based liquid used here, particularly at high temperatures. In situations where the solubility limit is reached but the temperature decreases, nitrogen and oxygen can be desorbed, if the pressure remains constant. The desorbed gases can then cause issues in the system. In order to fully characterize different hydrocarbon-based liquids, solubility coefficients are required to determine the total amount of gas in the liquid. This can be achieved, e.g., by using a solubility test stand as used by Panitz [10].
Acknowledgements
Open access funding enabled and organized by Projekt DEAL.
Symbols used
-
- m
-
- [kg]
-
- p
-
- [bar]
-
- T
-
- [°C]
-
- V
-
- [m3]
Greek letters
-
- ρ
-
- [kg m−3]
Sub- and superscripts
-
- A
-
- ambient
-
- a
-
- actual
-
- E
-
- evaluation
-
- G
-
- gas
-
- L
-
- liquid
-
- P
-
- pipe
-
- S
-
- sample
Abbreviations
-
- GC
-
- gas chromatograph/gas chromatography


