Comment on “Synthesis, Characterization, and Structures of a Persistent Aniline Radical Cation”: A New Interpretation Is Necessary†
Corresponding Author
Dr. Hans-Gert Korth
Institut für Organische Chemie, Universität Duisburg-Essen, Universitätsstrasse 5, 45117 Essen (Germany)
Institut für Organische Chemie, Universität Duisburg-Essen, Universitätsstrasse 5, 45117 Essen (Germany)Search for more papers by this authorCorresponding Author
Dr. Hans-Gert Korth
Institut für Organische Chemie, Universität Duisburg-Essen, Universitätsstrasse 5, 45117 Essen (Germany)
Institut für Organische Chemie, Universität Duisburg-Essen, Universitätsstrasse 5, 45117 Essen (Germany)Search for more papers by this authorHelpful discussions with Prof. Georg Jansen, Institut für Theoretische Chemie, and Dr. Christoph Wölper, Institut für Anorganische Chemie, Universität Duisburg-Essen, are gratefully acknowledged.
Graphical Abstract
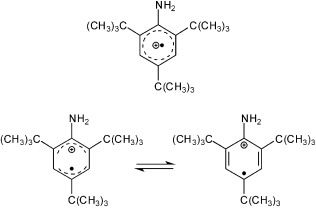
Further scrutiny for the aniline radical cation: The author of this Correspondence claims that the original spectrometric data for 2,4,6-tri-tert-butylaniline (TBA) reported in 2012 do not correspond to a stoichiometrically pure TBA.+SbF6− salt, the quantum-chemical data do not support the reported structural data, and the interpretation of the apparent temperature-dependent structural changes in the solid state is open to interpretations other than the Jahn–Teller effect.
Supporting Information
As a service to our authors and readers, this journal provides supporting information supplied by the authors. Such materials are peer reviewed and may be re-organized for online delivery, but are not copy-edited or typeset. Technical support issues arising from supporting information (other than missing files) should be addressed to the authors.
| Filename | Description |
|---|---|
| anie_201303991_sm_miscellaneous_information.pdf455.5 KB | miscellaneous_information |
Please note: The publisher is not responsible for the content or functionality of any supporting information supplied by the authors. Any queries (other than missing content) should be directed to the corresponding author for the article.
References
- 1X. Chen, X. Wang, Y. Sui, Y. Li, J. Ma, J. Zuo, X. Wang, Angew. Chem. 2012, 124, 12048–12051; Angew. Chem. Int. Ed. 2012, 51, 11878–11881.
- 2The spin concentration can be estimated in a straightforward fashion by recording the solution ESR spectra of a stable radical like TEMPO or diphenylpicrylhydrazl (DPPH) and that of the sample at equimolar concentrations under identical conditions and double integration of both spectra. In our experience, the relative error of this method is about 5–10 %.
- 3No magnetic field scale is shown in Figure 2 of Ref. [1]. It seems that the experimental and simulated spectra were reproduced on somewhat different scales. Otherwise, the simulated spectrum (overall width at line centers, 30.0 G) would not satisfactorily match the size of the experimental one.
- 4F. A. Neugebauer, S. Bamberger, W. R. Groh, Tetrahedron Lett. 1973, 14, 2247–2248.
10.1016/S0040-4039(01)87606-1 Google Scholar
- 5G. Cauquis, M. Genies, C. R. Hebd. Seances Acad. Sci. Ser. C 1967, 265, 1340–1343.
- 6F. A. Neugebauer, S. Bamberger, W. R. Groh, Chem. Ber. 1975, 108, 2406–2415.
- 7S. F. Nelsen in Landolt-Börnstein—New Series, Numerical Data and Functional Relationships in Science and Technology, Group II Molecules and Radicals, Vol. 9d2 (Ed.: ), Springer, Berlin, 1980, p. 28.
- 8S. F. Nelsen in Landolt-Börnstein—New Series, Numerical Data and Functional Relationships in Science and Technology, Group II Molecules and Radicals, Vol. 17h (Ed.: ), Springer, Berlin, 1990, p. 161.
- 9L. Hermosilla, J. M. Garcia de La Vega, C. Sieiro, P. Calle, J. Chem. Theory Comput. 2011, 7, 169–179.
- 10G. Cauquis, G. Fauvelot, J. Rigaudy, Bull. Soc. Chim. Fr. 1968, 4928–4937.
- 11B. Speiser, A. Rieker, S. Pons, J. Electroanal. Chem. Interfacial Electrochem. 1983, 147, 205–222.
- 12D. Griller, L. R. C. Barclay, K. U. Ingold, J. Am. Chem. Soc. 1975, 97, 6151–6154.
- 13A. R. Forrester, F. A. Neugebauer in Landolt-Börnstein—New Series, Numerical Data and Functional Relationships in Science and Technology, Group II Molecules and Radicals, Vol. 9c1 (Eds.: ), Springer, Berlin, 1979.
- 14F. A. Neugebauer in Landolt-Börnstein—New Series, Numerical Data and Functional Relationships in Science and Technology, Group II Molecules and Radicals, Vol. 17c (Ed.: ), Springer, Berlin, 1989, p. 387.
- 15F. A. Neugebauer in Landolt-Börnstein—New Series, Numerical Data and Functional Relationships in Science and Technology, Group II Molecules and Radicals, Vol. 26c (Ed.: ), Springer, Berlin, 2004.
- 16Judging from the relative intensities of the three spectra in Figure S2 of Ref. [1], it seems that the labels “293 K” and “330 K” have accidentally been exchanged. Otherwise, the signal intensities would have increased with increasing temperature. In addition, there are obviously inconsistencies in the scaling of the spectra.
- 17A. M. Brouwer, P. G. Wiering, J. M. Zwier, F. W. Langkilde, R. Wilbrandt, Acta Chem. Scand. 1997, 51, 217–219.
- 18Other compounds might contribute to the 430 nm absorption in Figure 1 b of Ref. [1]. For instance, aminyl radical 2, which has been reported to have a pink color, absorbs weakly at 410 nm,[20] in accord with TDDFT data (Figure S2). From the data of Figure 1 b of Ref. [1], the maximum percentage of TBA.+ is roughly estimated to about 20 %, assuming that the 430 nm band is entirely due to TBA.+ and that the UV/Vis measurements have been performed in standard 1 cm cuvettes (no details given).
- 19Since the ESR and UV/Vis spectra indicate a low concentration of radical species, the presence of nonradical decomposition products, for example, 2,4,6-tri-tert-butylanilinium cation (TBAH+) or hydrazine 3, could have easily been established by 1H NMR spectrometry.
- 20E. J. Land, G. Porter, J. Chem. Soc. 1961, 3540–3542.
- 21D. Jacquemin, V. Wathelet, E. A. Perpete, C. Adamo, J. Chem. Theory Comput. 2009, 5, 2420–2435.
- 22F. H. Allen, O. Kennard, D. G. Watson, L. Brammer, A. G. Orpen, J. Chem. Soc. Perkin Trans. 2 1987, S 1–S19.
- 23Although it is difficult to distinguish by elemental analysis between compounds of molecular weight around 500 that differ by just one hydrogen atom, it should be noted that the C,H percentages given for the green compound (Ref. [1], p. 11881: found C 43.42, H 6.46) are closer to those for TBAH+ SbF6− (calcd C 43.39, H 6.47) than to those for TBA.+ SbF6− (calcd C 43.48, H 6.28).
- 24Possible reasons for unusually short carbon–carbon bond lengths apparently detected in X-ray structures have been discussed, see e.g.: J. D. Dunitz, Chem. Commun. 1999, 2547; M. B. Hall, S. Niu, J. H. Reibenspies, Polyhedron 1999, 18, 1717–1724; S. K. Nayak, S. Chandrasekhar, T. N. G. Row, Acta Crystallogr. Sect. C 2009, 65, o 222–o225; S. N. Balasubrahmanyam, G. U. Kulkarni, R. S. Gopalan, A. S. Kumar, U. S. Hiremath, J. Mol. Struct. 2003, 645, 159–169.
- 25Gaussian 09, Revision A.02, M. J. Frisch, et al., Gaussian, Inc., Wallingford CT, 2009.
- 26F. Neese, ORCA—An Ab Initio, DFT and Semiempirical Electronic Structure Package, Version 2.9.1, Max Planck Institute for Bioinorganic Chemistry, Mülheim a.d. Ruhr, 2012.
- 27A. R. Allouche, Gabedit—A graphical user interface for computational chemistry softwares, Version 2.4.3, 2012; J. Comput. Chem. 2011, 32, 174–182.


