Quantitative path to deep phenotyping: Possible importance of reduced hepatic insulin degradation to type 2 diabetes mellitus pathogenesis
深度表型的定量途径:对于2型糖尿病发病机制来说减少肝脏胰岛素降解可能具有意义
Diabetes is often thought of as one of two diseases: type 1 diabetes mellitus (T1DM), which is caused by immunological destruction of the β-cells, and type 2 diabetes mellitus (T2DM), which is due to a combination of insulin resistance and relative failure of the β-cells to compensate for the resistance. However, it is becoming clear that even within these two definitions there may be considerable heterogeneity.1 There are several approaches to examine the heterogeneity of T2DM, including the use of biomarkers to categorize the disease or examination of variants in the genome. A third approach, the one we have been using in our laboratory, is to identify specific phenotypes that may contribute to failure to regulate glucose levels. We have identified a small group of such phenotypes that can be distinguished and measured using clinical protocols and/or mathematical modeling.
Insulin resistance and β-cell function
The concept of insulin resistance emerged in the 1930s to describe those subjects who apparently did not respond to insulin injections.2 It was eventually determined that virtually all individuals will respond to some dose of insulin, which will increase glucose disposal and suppress endogenous glucose production.2 However, there is a wide range of insulin sensitivities, even in normal individuals.3 In patients with impaired glucose tolerance or T2DM, insulin resistance is usually substantial. This realization came from several methods designed to measure insulin resistance, including the glucose clamp, introduced by Andres et al.4 and extended by DeFronzo et al.5 and the pancreatic suppression test.6 These methods, along with molecular studies demonstrating insulin resistance in particular tissues, including skeletal muscle, led to the hypothesis that T2DM was caused in particular by insulin resistance, which stressed the β-cells and ultimately exhausted them. However, an alternative hypothesis was put forth, namely that T2DM, like T1DM, is mostly a pancreatic disease. In particular, Porte and Kahn7 clearly showed, for the intravenous glucose tolerance test, that there was an impaired ability of β-cells to respond to glucose in patients with T2DM.
 (1)
(1)
where DI is the disposition index.
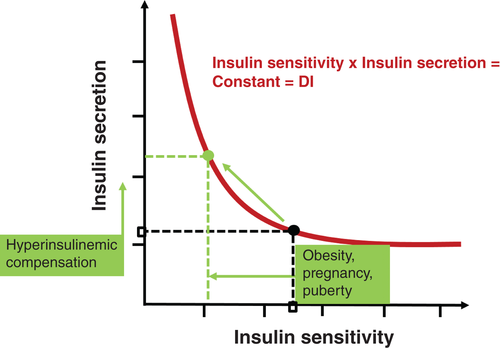
Imagine an individual with normal pancreatic function. Using common techniques (e.g. frequently sampled intravenous glucose tolerance test [FSIGT], glucose clamp), insulin response and insulin sensitivity can be measured. The DI is then the product of these two variables (see Eqn 1). If such an individual becomes insulin resistant (due, for example, to excessive fat in the diet, pregnancy, puberty), insulin sensitivity is decreased and there is a reflexive increase in β-cell function, thus maintaining normal carbohydrate metabolism. The underlying concept is that a primary function of the β-cells of the pancreas is to compensate for changes in insulin resistance. The latter can be expressed as the DI, and reflects β-cell compensation. Individuals with reduced or inappropriately low β-cell function will have a reduced DI, and will exhibit inadequate compensation.
The “hyperbolic law of glucose tolerance”, captured in Eqn 1, has been well documented in a large number of studies (for a review, see Kodama et al.9). It has also been shown that DI is not only a strong predictor of conversion from impaired glucose tolerance to T2DM, but also has a genetic basis.10 It is presently possibly the strongest known predictor of conversion from impaired glucose tolerance to T2DM, even exceeding all known predictive T2DM variants taken together. It would be of great clinical benefit to assess DI in individual subjects, to understand their risk for T2DM. Clearly, the use of complex protocols such as the FSIGT or clamp is not useful for clinical purposes, and our laboratory and others are searching for simpler protocols that will be available for routine clinical use.
Other factors determining glucose tolerance
Glucose effectiveness
The turnover of glucose in the body is not only dependent upon insulin release and insulin action. In fact, it is possible to demonstrate that significant glucose utilization by tissues in response to elevated glucose levels will occur even at basal insulin levels. We have termed this phenomenon (i.e. the effect of glucose per se to enhance net glucose utilization) “glucose effectiveness”.11 The latter includes glucose effect to increase utilization, as well as its effect to suppress endogenous glucose release. Ader et al.12, 13 have shown that during carbohydrate administration, even if endogenous insulin release is suppressed, elevated glucose will renormalize due to glucose effectiveness mechanisms.
Glucose effectiveness is difficult to assess in patients, therefore we have searched for a surrogate measurement. In a resting subject exposed to elevated glycemia, if insulin release is maintained at basal levels, glucose uptake will occur primarily in tissues that use glucose independent of hyperinsulinemia. One of the most important tissues to take up glucose acutely is the liver. In fact, transport of glucose into liver is insulin independent, via the glucose transporter GLUT2, after which glucose is phosphorylated via glucokinase and metabolized via the glycolytic pathway. In the liver, glucokinase activity is sequestered in the nucleus, only to be released into the cytoplasm via glucokinase regulatory protein (GKRP). After glucose is phosphorylated to glucose-6-phosphate, the 6-carbon moiety is split to reach the triose phosphate stage. The 3-carbon intermediate is either stored as glycogen, metabolized vie the tricarboxylic acid cycle, or exported as lactate.14 We hypothesized that under conscious but non-active conditions, lactate production could be dominant, and therefore lactate release could be a surrogate for glucose phosphorylation. If so, then during the FSIGT, we may observe an acute increase in plasma lactate levels. In fact, we did observe such an effect.14 We produced a simple mathematical model to represent glucose phosphorylation and conversion to lactate by the liver during the FSIGT.14 Using this model, we are able to use the time changes in glucose and lactate during the FSIGT to estimate glucose phosphorylation. This model was confirmed in two ways. First, we predicted those individuals in a Finnish population with a GKRP defect who would overproduce lactate during the FSIGT; second, we were able to assess the effect of fibroblast growth factor (FGF) 1 on hepatic glucose phosphorylation in a rodent model produced by Scarlett et al.15 This modeling tool will allow us to examine, in human patients, the importance of glucose effectiveness (i.e. hepatic glucose phosphorylation) in the pathogenesis of diabetes and other metabolic diseases to exacerbate limitations of glucose utilization and reductions in glucose tolerance.
Hepatic insulin clearance
Insulin concentrations in the bloodstream are determined by a balance between insulin release from the β-cells of the pancreatic islets, and degradation of the protein by liver and other tissues (kidneys, muscle, heart). Of particular interest is that insulin released from the β-cells immediately enters the liver, via the portal vein, where a large fraction (~50%) is degraded, leaving the remaining half to exit the liver and enter the systemic circulation.16 From a teleological point of view, it is of interest to ask why evolution “decided” to allow such a large fraction of insulin to be degraded before entering the systemic circulation. Recently, we have been studying insulin degradation to gain an insight into the possible evolutionary advantages of large degradation of insulin on its first pass through the hepatic circulation.
Variability of hepatic insulin extraction
Several well-accepted methods exist for measurement of insulin clearance. Because insulin and C-peptide are cosecreted by the β-cells of the pancreas in equimolar amounts, insulin extraction is often assessed by calculating the secretion with C-peptide kinetics during FSIGT16 or oral tests,17, 18 and insulin extraction is then calculated using an insulin kinetics description. Alternatively, the increase in plasma insulin during euglycemic clamps can be used.5 However, all these methods calculate total insulin clearance and do not differentiate between hepatic and extrahepatic clearance.
Therefore, we developed a new methodology to assess hepatic insulin clearance per se. This method, used in animals, requires comparison of increments in plasma insulin concentrations during systemic versus intraportal insulin infusion.19 Comparing the dose–response relationships, it is straightforward to calculate hepatic insulin extraction directly. Using this approach, we were able to demonstrate in a population of normal animals that there is wide variation in insulin extraction.19 In fact, in a population of canines, first-pass insulin extraction varied from 22% to 77%. The corollary question arises: why is there such a wide variance in accurately measured hepatic insulin extraction? One answer emerged from a second set of experiments20 in which we measured first-pass hepatic insulin extraction before and after administration of a modestly elevated fat diet. After 12 weeks of this diet, insulin clearance was reduced from 60% to 44%. The decrease in clearance meant that a larger fraction of newly secreted insulin would reach the systemic circulation.
What is the significance of the results that hepatic insulin extraction is widely variable, even in normal animals, and that insulin degradation by liver can be changed by environmental factors such as an elevated-fat diet? From these results, it can be concluded that the first-pass degradation of insulin by liver is a highly regulated process, and that the teleogic “reason” that a large fraction of secreted insulin can be degraded by the liver before it reaches the systemic circulation is that the liver can act as a “gateway” controlling the ability of insulin to reach insulin-sensitive tissues beyond the liver. Our results19, 20 support the proposition that lower values of hepatic insulin degradation can contribute to hyperinsulinemic compensation for insulin resistance, which may not be due solely to increased insulin release from the β-cells.
Insulin signaling
A question that is rarely addressed is “How can insulin signal the liver effectively when there is such a large amount of the hormone degraded by the organ?” In fact, it can be estimated that approximately 245 000 pmol insulin is secreted into the portal vein per day,21 of which approximately half (~125 000 pmol) is bound to liver insulin receptors and thereby degraded.16 It has been commonly believed that glucose production by the liver is primarily controlled by portal insulin levels. Is it possible that the liver could detect small changes in inflow insulin in the face of such large fluxes of receptor binding and internalization? Is there a separate mechanism by which the liver controls glucose output independent of the insulin levels in the portal vein?
Single gateway hypothesis
Some years ago, we proposed that the control of glucose production by liver is not by direct insulin binding to the organ, but via a separate indirect pathway.22 In fact, a series of experiments in our laboratory identified this indirect pathway as insulin suppression of lipolysis by white adipose tissue.22 After nutrient ingestion, elevated systemic insulin would act directly on the liver to appropriately suppress liver glucose production. The pathway is then insulin secretion → elevated insulin → reduced adipocyte lipolysis → lowered plasma free fatty acids (FFAs) → appropriately reduced glucose output. This concept has recently been strongly supported by independent work in the laboratories of Morris Birnbaum23, 24 and Gerald Shulman25 Thus, the “gateway” for the control of liver glucose production is the ability of insulin to enter the adipocyte, after which FFAs are reduced and liver glucose output can be modulated. The uptake of insulin by the adipocyte is due to transport across the capillary endothelium. The existence of this mechanism explains the ability of glucose production to be controlled by insulin via FFA suppression, independent of massive degradation of insulin in the liver.26 In addition, the effect of insulin to enhance glucose uptake by skeletal muscle is limited in time by transport across the capillary endothelium in that tissue. Therefore, transport across the capillary endothelium is rate limiting for glucose uptake and the suppression of lipolysis (and thus suppression of hepatic glucose production).
Importance of controllable liver insulin degradation in the pathogenesis of T2DM
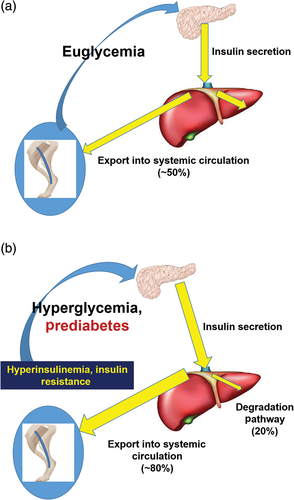
The realization that hepatic insulin clearance is variable among normal individuals and that it can be changed by environmental factors raised the question of the role of hepatic insulin degradation in T2DM. Working with David Polidori of Janssen Pharmaceuticals, we have developed a new approach to measure hepatic versus extrahepatic insulin clearance that can be used in human volunteers.27 Using this model to analyze data from the laboratory of Barbara Gower and colleagues, we were able to show that insulin degradation by the liver is significantly reduced in African American subjects compared with European American individuals.28 We have also shown recently that this ethnic difference applies to children aged 7–13 years,29 suggesting that reduced hepatic clearance may be a progenitor of T2DM diabetes, knowing that risk for T2DM is higher in African Americans. In fact, one may suggest a pathogenic factor in which lower hepatic insulin extraction leads to peripheral hyperinsulinemia; the latter could result in peripheral insulin resistance,30 thereby stressing the β-cells to compensate (Fig. 2). The importance of this proposed mechanisms remains to be tested experimentally.

Deep phenotyping revisited
It appears that T2DM is not a single entity. Although this has long been recognized for certain rather obscure types of the disease, it is now becoming clear that the heterogeneity of the disease may be more important than previously recognized.1 The question arises, how do we differentiate the various types of the disorder? The purpose of this treatise is to demonstrate that it is possible to differentiate individual metabolic characteristics into those with alterations in a finite number of clinical characteristics (Table 1), and that these characteristics may be easier to assess than previously realized. It is hoped that use of the methods discussed herein will lead to better differentiation of different classes of disease, as well as improved prediction of disease and consequent therapies.
| Index | Symbol | Physiologic meaning |
|---|---|---|
| Insulin sensitivity | SI | Insulin effect to enhance glucose disposal and suppress endogenous production. |
| β-Cell response | AIRg | First-phase response to glucose |
| Disposition index | DI = SI × AIRg | β-Cell compensation for increase in insulin resistance; strong predictor of diabetes |
| Glucose effectiveness | SG | Effect of glucose per se to enhance net glucose utilization; may represent glucokinase or glucokinase regulatory protein |
| Insulin clearance by the liver | MCRILiver | Fractional first-pass extraction; may be a major factor in the cause of diabetes in some ethnic groups |
| Extrahepatic insulin clearance | MCRIeh | Does not vary with ethnicity |
- AIRg, post-glucose acute insulin response; MCRI, metabolic clearance rate of insulin.
Acknowledgements
RNB is supported by grants from the National Institute of Diabetes and Digestive and Kidney Diseases (DK27619, DK29867), Astra Zeneca, and Janssen Research.
Disclosure
None declared.
糖尿病常被分为两种类型:1型糖尿病(T1DM),它是由于β细胞被免疫破坏后所导致的, 以及2型糖尿病(T2DM),它是由于胰岛素抵抗以及β细胞为了代偿胰岛素抵抗出现相对功能衰竭所导致的。然而, 目前有越来越多的证据表明即使是在这两个定义范畴内可能还存在着相当大的异质性1。有几种方法可以用来检测T2DM的异质性, 包括使用生物标志物来分类疾病或检测基因组中存在的变异。第三种方法, 也就是我们在实验室中所使用的, 要鉴定出特定的可能导致自身血糖水平无法调节的表型。我们已经鉴定出了一小部分这样的表型, 可以使用临床常规诊疗方法和/或数学建模进行区分与测量。
胰岛素抵抗与β细胞功能
胰岛素抵抗的概念出现在20世纪30年代, 当时是用来描述那些注射胰岛素后没有明显应答的受试者2。最终我们已经很清楚, 实际上几乎所有的人对某种剂量的胰岛素都会产生一些应答2,胰岛素会增强人体对葡萄糖的处理能力并且会抑制内源性葡萄糖的产生。然而, 即使在正常人当中, 胰岛素敏感性也有一个广泛的范畴3。在糖耐量受损或者T2DM患者中, 胰岛素抵抗通常很明显。这种认识来源于几种设计用来衡量胰岛素抵抗的方法, 包括葡萄糖钳夹试验, 由Andres等4首创并且DeFronzo等5对这种方法进行了扩展, 还包括了胰腺抑制试验6。这些方法与分子学研究结果一起都证实了在特定的组织中存在胰岛素抵抗, 包括骨骼肌, 由此得出了T2DM主要是因为胰岛素抵抗所导致的假说, 胰岛素抵抗不但增加β细胞的分泌压力而且最终可使得它们耗竭。然而, 有人提出了另外一种假说, 亦即T2DM与T1DM一样, 主要是一种胰腺疾病。尤其是Porte与Kahn7都明确指出, 若使用静脉葡萄糖耐量试验可发现T2DM患者β细胞对葡萄糖的应答能力减弱。
在T2DM的发病机制中究竟是以胰岛素抵抗本身还是以β细胞功能障碍为主的相关争论已经持续了很多年。为了解决这场争论我们特地研究了胰岛素抵抗与β细胞应答之间的关系。我们假设有一条典型的双曲线可以用来描述胰岛素敏感性(胰岛素抵抗的倒数)与β细胞应答之间的关系(图1),例如这样8:
胰岛素敏感性×β-细胞应答=DI (1)
其中DI为处置指数。
想象一下胰腺功能正常的人。使用常用的技术(如, 频繁采样的静脉葡萄糖耐量试验[FSIGT]、葡萄糖钳夹试验),都可以测量胰岛素应答与胰岛素敏感性。那么DI就是这两个变量的乘积(参见方程式1)。如果这样的个体变成胰岛素抵抗(如, 因为饮食中脂肪过多、怀孕、青春期),胰岛素敏感性下降, 并且β细胞功能反应性增强, 从而使得碳水化合物的代谢保持正常。基本概念就是胰岛β细胞的主要功能是能够代偿胰岛素抵抗所带来的变化。后者可以表示为DI,反映了β细胞的代偿能力。个体的β细胞功能降低或者处于不适当低值会导致DI下降, 并且会出现代偿能力不足。
从方程式1中得出的“葡萄糖耐量双曲线定律”目前已经在大量的研究文献中记载下来(参见Kodama等9的综述)。DI不仅是一个强力的可预测糖耐量受损转化为T2DM的指标, 而且也有遗传学基础10。目前它可能是已知的糖耐量受损转化为T2DM的最强预测因子, 甚至超过了所有已知的可用来预测T2DM的变量合在一起的效应。在每个受试者中评估DI具有很大的临床益处, 可以了解他们罹患T2DM的风险。显然, 使用诸如FSIGT或者钳夹试验之类的复杂方法对于临床来说是没有作用的, 我们的实验室和其他人正在寻找更为简单的并且可以在常规临床中使用的方法。
影响葡萄糖耐量的其他因素
葡萄糖效应
葡萄糖在体内的转换不仅取决于胰岛素的释放以及胰岛素的作用。实际上, 它可能也证实了即使在基础胰岛素水平下, 因为葡萄糖水平的升高, 也可以展示组织对葡萄糖的利用率也会显著升高了。我们称这种现象(亦即在葡萄糖本身的影响下会导致葡萄糖净利用增加)为“葡萄糖效应”11。后者包括提高葡萄糖利用率的葡萄糖效应, 以及抑制内源性葡萄糖释放的作用。Ader等12,13已证实, 在进食碳水化合物期间, 即使内源性胰岛素释放被抑制了, 葡萄糖效应机制也可导致升高的葡萄糖水平重新正常化。
很难直接评估患者的葡萄糖效应, 因此我们要寻找替代的测量方法。将休息状态下的受试者暴露于高血糖环境中, 如果将胰岛素释放维持在基础水平, 葡萄糖摄取主要发生在组织中, 在这里利用葡萄糖不依赖于高胰岛素血症。其中肝脏是摄取葡萄糖最重要的组织。实际上, 葡萄糖如何转运到肝脏与胰岛素无关, 它是通过葡萄糖转运蛋白GLUT2进行的, 在这之后, 葡萄糖通过葡萄糖激酶磷酸化, 并通过糖酵解途径代谢。在肝脏细胞核中, 葡萄糖激酶的活性被隔绝了, 只能通过葡萄糖激酶调节蛋白(glucokinase regulatory protein,GKRP)被释放到细胞质中起作用。当葡萄糖被磷酸化成为葡萄糖-6-磷酸之后,6-碳部分分裂后进入磷酸丙糖阶段。3-碳中间体或以糖原形式储存, 与三羧酸循环竞争代谢, 或者作为乳酸输出14。我们假设在有知觉的但不活跃的情况下, 可能是以产生乳酸为主, 因此释放乳酸可能是葡萄糖磷酸化的替代产物。如果是这样, 那么在FSIGT期间, 我们可以观察到血浆乳酸水平急剧升高。实际上, 我们确实观察到这样的效应14。我们建立了一个简单的数学模型来模拟葡萄糖磷酸化并且在FSIGT期间被肝脏转化为乳酸14。使用这个模型, 我们可以使用葡萄糖与乳酸在FSIGT期间随时间的变化情况来评估葡萄糖磷酸化。这个模型通过两种途径得到了证实。首先, 我们在具有GKRP缺陷的芬兰人群中预测谁会在FSIGT期间产生过多的乳酸;其次, 我们在Scarlett等15创造的啮齿动物模型中评估成纤维细胞生长因子(FGF)-1对肝脏葡萄糖磷酸化的影响。这种建模方法让我们能够在患者中明确葡萄糖效应(亦即肝脏葡萄糖磷酸化)在糖尿病以及其他代谢疾病发病机制中的地位如何, 以调查它对葡萄糖利用受限以及葡萄糖耐量降低的加重有何影响。
肝脏胰岛素清除率
血液中的胰岛素浓度取决于从胰岛β细胞释放的胰岛素与肝脏及其他组织(肾脏、肌肉、心脏)降解胰岛素之间获得的平衡。其中特别令人感兴趣的是, 从β细胞释放的胰岛素经过门静脉立即进入肝脏, 在这里有一大部分(约50%)被降解了, 剩下一半离开肝脏进入全身循环16。从目的论观点来看, 有人可能会感兴趣地问, 为什么进化的结果“决定了”人体允许如此大比例的胰岛素在进入全身循环之前就被降解了。胰岛素在其第一次通过肝循环时就被大量降解, 为了深入了解其中可能存在的进化优势, 最近我们一直在研究胰岛素的降解情况。
肝脏胰岛素降解的变异性
有几种公认的方法可以用于测量胰岛素的清除率。因为胰岛素与C肽是由胰岛β细胞以等摩尔量一起分泌的, 因此在FSIGT16或者口服葡萄糖耐量试验17,18期间经常通过计算C肽分泌动力学来评估胰岛素的分泌, 然后使用胰岛素动力学描述来计算胰岛素的分泌。或者, 在正糖葡萄糖钳夹试验期间使用增加的血浆胰岛素来评估胰岛素的分泌5。然而, 所有的这些方法计算的都是总的胰岛素清除率, 并没有区分肝内与肝外清除率。
因此, 我们研究出了一种新的用来评估肝脏本身的胰岛素清除率的方法。这种方法用于动物时, 需要在全身或者门静脉输注胰岛素期间比较血浆胰岛素浓度的增量19。比较了剂量-应答关系, 直截了当地计算了肝脏本身的胰岛素降解情况。使用这种方法, 我们能够证实, 在正常的动物群体中胰岛素的降解也存在很大的差异19。实际上, 在一群犬科动物中, 胰岛素的首次降解率变化范围为22%-77%。推论的问题出现了:为什么精确测量的肝脏胰岛素降解情况会出现如此大的差异?第二组实验20给出了一个答案, 我们在适度高脂饮食之前以及之后都测量了肝脏胰岛素的首次降解情况。给予这种饮食12周之后, 胰岛素清除率从60%降到了44%。清除率的降低意味着新分泌的胰岛素更大部分都将进入全身循环。
甚至在正常的动物中, 肝脏的胰岛素降解率也会出现大幅度的变化, 并且肝脏胰岛素的降解还会受到环境因素的影响, 例如高脂饮食, 这个结果意味着什么?从这些结果中, 我们可以得出一个结论, 那就是肝脏内的胰岛素首次降解是一个受到高度调节的过程, 这是一个感应遗传的“影响因素”, 胰岛细胞分泌的胰岛素在进入全身循环之前大部分都被肝脏降解了, 因此肝脏可作为一个“门户”具有控制胰岛素到达肝外胰岛素敏感组织的能力。我们的研究结果19,20支持这一命题, 那就是肝脏胰岛素降解减少可导致为了代偿胰岛素抵抗而出现的高胰岛素血症, 这可能不单纯是由于β细胞释放胰岛素的增加。
胰岛素信号转导
有一个很少被提及的问题, 那就是“当如此大量的激素被肝脏降解时, 胰岛素如何能够有效地给肝脏发出信号”?实际上, 据估计每天大约有245000 pmol的胰岛素被分泌到门静脉中21, 其中大约有一半(约125000 pmol)与肝脏内的胰岛素受体相结合, 从而被降解16。人们普遍认为, 肝脏产生的葡萄糖数量主要是受门静脉中胰岛素水平的控制。面对如此大量的受体结合以及内化作用, 肝脏能够检测到胰岛素的流入出现了微小变化吗?肝脏控制葡萄糖输出是否还存在不依赖于门静脉胰岛素水平的其他机制?
单一途径假说
几年前, 我们就提出了肝脏控制葡萄糖生成并不是通过直接的胰岛素与肝脏结合, 而是通过单独的间接途径22。实际上, 在我们的实验室中已经有一系列的实验证实了这一间接途径, 亦即通过胰岛素抑制白色脂肪组织脂解的途径22。人体摄取营养之后, 全身胰岛素水平都会升高, 这将直接作用于肝脏, 适当地抑制肝脏葡萄糖的生成。那么作用途径就是胰岛素分泌 胰岛素水平升高 减少脂肪细胞脂解 降低血浆游离脂肪酸(FFAs)水平适当减少葡萄糖生成。最近, 这个概念得到了Morris Birnbaum23,24与Gerald Shulman25实验室的独立研究的强有力支持。因此, 肝脏控制葡萄糖生成的“途径”就是胰岛素进入脂肪细胞的能力, 在这之后FFAs水平开始下降, 因此肝脏葡萄糖生成得到了调节。脂肪细胞对胰岛素的摄取要通过毛细血管内皮的转运。存在的这种机制可以用来解释胰岛素是通过抑制FFA来控制葡萄糖的生成能力, 与肝脏中胰岛素被大量降解无关26。另外, 在骨骼肌中胰岛素增强葡萄糖摄取能力的效果受到了这个组织中毛细血管内皮转运胰岛素所需时间的限制。因此, 对于葡萄糖的摄取以及抑制脂肪分解(从而抑制肝脏葡萄糖的生成)来说胰岛素在毛细血管内皮中的转运是个限速步骤。
可控性肝脏胰岛素降解在T2DM发病机制中的作用
在正常个体中肝脏胰岛素清除率是不断变化的, 并且它可以因环境因素而改变, 这让我们关注在T2DM中肝脏胰岛素降解的作用。与杨森制药的David Polidori一起合作, 我们已经研究出了一种新的方法用于人类志愿者中来测量比较肝内与肝外胰岛素清除率27。利用该模型对Barbara Gower及其同事的实验室所取得数据进行分析, 让我们发现, 与欧裔美国人相比较, 非裔美国受试者肝脏中的胰岛素降解显著减少28。我们最近还发现在7-13岁的儿童中也存在这种种族差异29,提示肝脏胰岛素清除率降低可能是T2DM的先兆, 并且目前已知非裔美国人的T2DM风险较高。实际上, 有人提出了这可能是一个致病因素, 因为肝脏胰岛素降解减少可导致外周高胰岛素血症;后者可能导致外周胰岛素抵抗30,因为代偿作用增加了β细胞的负担(图2)。所提出的这种机制的重要性目前仍然有待于实验验证。
重新审视深度表型
看来T2DM并不是一个单独存在的疾病。虽然这种疾病长期以来都被公认为是一种相当不明确的疾病类型, 现在变得越来越清楚的是, 这种疾病的异质性可能要比我们先前所认识到的更为重要1。问题是, 我们要如何区分这种疾病的各种分型?这篇文章的目的是为了说明有可能将个别的代谢特征区分出那些已变化有限量的临床特征(表1),而这些特征与以前认识到的相比可能更容易评估。我们希望使用本文所讨论的方法可以更好地区分不同类型的疾病, 并能改善疾病的预测以及随后的治疗。
图1 葡萄糖耐量双曲线定律。Bergman等8假设在正常个体中胰岛素分泌量与胰岛素敏感性的乘积是一个常数, 称之为处置指数(DI)。这表明环境因素可以降低胰岛素敏感性, 如肥胖、怀孕或者青春期诱导的胰岛素敏感性下降, 胰岛素分泌增加会抵消这种效应, 从而防止葡萄糖耐量受损。
图2 我们假设, 至少在某些种族中, 肝脏胰岛素降解减少(亦即减少降解)在2型糖尿病(T2DM)的发病机制中可能是一种致病因素。(a)在非糖尿病的正常个体中, β细胞分泌的胰岛素直接进入肝脏, 在这里有一半被降解, 而另外一半进入全身循环, 用来调节葡萄糖的利用以及脂肪组织脂解作用。(b)在某些具有T2DM风险的患者中, 发现他们的肝脏胰岛素降解受到了抑制(例如在非裔美国人中)。因此, β细胞分泌出来的胰岛素有更大一部分进入全身循环当中。高胰岛素血症接着可能会导致肌肉中产生胰岛素抵抗, 增加β细胞分泌压力, 而在脂肪组织中会导致脂解作用并且不适当地增加内源性葡萄糖生成。
表1 描述葡萄糖代谢的代谢指标
| 指标 | 符号 | 生理学意义 |
| 胰岛素敏感性 | SI | 胰岛素的作用是增强葡萄糖的处置并抑制内源性葡萄糖的产生。 |
| β细胞应答 | AIRg | 对葡萄糖的第一时相应答 |
|
处置指数 |
DI=SI×AIRg | 因为胰岛素抵抗增加所以β细胞代偿性分泌增加;糖尿病的强力预测因子 |
| 葡萄糖效应 | SG | 葡萄糖本身就具有提高净葡萄糖利用率的作用;可能代表了葡萄糖激酶或者葡萄糖激酶调节蛋白的作用 |
| 肝脏胰岛素清除率 | MCRILiver | 部分首次降解;在某些种族中可能是糖尿病发病的主要因素 |
| 肝外胰岛素清除率 | MCRIeh | 各个种族之间没有差异 |
AIRg,负荷葡萄糖后的急性胰岛素应答;MCRI,胰岛素代谢清除率。


