Impacts of temporal/spatial rainfall heterogeneities on peak runoff distribution and intensities for an urban river basin of south China
Abstract
In this research, a modeling approach of rainfall generator coupled with high resolution rainfall products were proposed to generate designed rainfall events under multiple spatial and temporal distributions, which was then employed to analyze the impacts of spatial and temporal rainfall heterogeneities on peak runoff for watersheds. Three scenarios were developed under multiple degrees of impermeable underlying surface areas within an urban watershed in south China. Detailed runoff processes were analyzed through the adoption of a distributed hydrological model (GSSHA). A covariance analysis method combined with rainfall spatio-temporal heterogeneity characteristic were used to quantify heterogeneity effects on peak runoff. Results indicated that coupling short period (2008–2016) remotely rainfall data and RainyDay results could successfully reproduce designed rainfall events, spatio-temporal heterogeneity of rainfall contributed significantly to the peak runoff, which was greater than those by rainfall duration and capacity, and the increase in impermeable underlying surface enhanced the complexities of the effects. Over each rainfall duration with increasing rainfall return period, the indicator of rainfall peak coefficient (RWD) would decrease and then increase. Regarding the total rainfall center (tg), 25 mm/h threshold rainfall spatial coverage (A25) decreased with increasing imperviousness, 1-h maximum rainfall (Rmax) surged with increasing imperviousness at rainfall duration of 2 and 24 h. Innovations of this research lied in: combination of a rainfall generator model based on a stochastic storm transposition technique and remote-sensing rainfall data to generate designed rainfall events, a rainfall spatial and temporal heterogeneities index system was developed to reveal how the changing characteristics of rainfall distribution and the impacts on peak runoff, and in-depth analysis of the impacts on runoff peak under multiple urban development scenarios for increasing capability in flood control/prevention.
1 INTRODUCTION
Global urbanization has experienced a significantly expedite process in recent decades, with the worldwide urban population expanding from 751 million in 1950 to 4.2 billion in 2018. The expansion of urban built-up land is an irreversible consequence of urbanization and such expansion inevitably leads to an increase in the impervious area of the underlying ground surface (Gao & O'Neill, 2020; Nithila Devi et al., 2019; Wang et al., 2019). Specific watershed surface changes and local human activities may have significant impacts on hydrological cycle, such as a change in the distribution of rainfall at multiple temporal and spatial scales and an increase in the frequency of certain extreme rainfall events (Shakti et al., 2018; Sikorska et al., 2015; Zhu et al., 2019). Over urbanization, surface water infiltration will decrease and surface runoff will increase due to the growing impermeability of the underlying surface (Locatelli et al., 2017; Zhang et al., 2020). The previous studies have shown that the frequent occurrence of extreme rainfall events is the main causal factor for many water-related disasters such as landslides and flooding (Francipane et al., 2021; Malik et al., 2020; Mishra et al., 2018; Tazen et al., 2019; Zellou & Rahali, 2019). In the rapidly changing urban environment, Han et al. (2020) indicated that the global precipitation extremes might continue to intensify, which could greatly increase the risks of the occurrence of rainfall and flooding disasters.
In the past, data of certain rain gauges were employed as main rainfall inputs to hydrological models for runoff and flood forecasting (Terink et al., 2018; Van de Beek et al., 2012). Along with the rapid urban development, the applicability and rationality of such a way is becoming extremely inaccurate in the face of complex subsurface changes. Due to the lack of long time-series rainfall data with high spatial and temporal resolution, the induced rainfall spatial and temporal heterogeneities are frequently simplified or ignored in urban hydrological analysis and flooding studies. Therefore, it is necessary to investigate how the spatial and temporal heterogeneities of rainfall affects peak runoff under the change in underlying surface impermeability caused by rapid urbanization, which is becoming scientific significance to clarify the disaster-causing mechanism of rainfall and flooding. This can provide an important theoretical basis for flood prevention and disaster management in the context of urbanization. The variations in the spatial and temporal distribution characteristics of rainfall would inevitably lead to changes in flood characteristics such as the total floods and the corresponding peak values (Aryal et al., 2020; He et al., 2022; Peleg et al., 2017; Shah & Mishra, 2016). If the watershed hydrological processes still use rain gauge as primary data source for simulation modeling, which may probably reduce the accuracy and reliability of the simulation in a rapidly changing urban environment (Ochoa-Rodriguez et al., 2015). Peleg et al. (2017) indicated that current urban drainage systems require high spatial and temporal resolution rainfall data to reduce the uncertainty of simulation predictions. Petroselli et al. (2021) emphasized that capturing the temporal and spatial processes of rainfall is key to understanding the evolution of regional water production and sink patterns. Zhu et al. (2018) showed that through the influences of spatial and temporal heterogeneities of rainfall, relatively small rainfall volume (e.g., once per 20 years) may lead to floods of larger magnitude (e.g., once per 500 years).
As the cities continue to expand and the impermeable underlying surfaces increase, the spatial and temporal heterogeneities of rainfall is becoming pronounced in response to peak runoff. Ochoa-Rodriguez et al. (2015) pointed out that in the urban areas, high imperviousness and fast flow-out were particularly important for capturing the high spatial and temporal variability of rainfall. Cristiano et al. (2018) indicated that in a small-scale urban watershed with high impermeability, the hydrological response was sensitive to the spatial and temporal variability of rainfall, especially the temporal heterogeneity of rainfall has significant impacts. Regarding these studies of rainfall heterogeneity, researchers have used typical rainfall characteristics, such as rainfall coverage, intensity, movement patterns, and the spatial relative location of rainfall centers, to reflect variations in regional rainfall spatial and temporal distribution and to assess their effects on floods in the basin of interest (Tetzlaff & Uhlenbrook, 2005; Volpi et al., 2012). ten Veldhuis et al. (2018) pointed out that the spatial distribution of rainfall location and the direction of rainfall movement had a direct impact on flood runoff. Emmanuel et al. (2017) stated that heavy rainfall spatial coverage was an important factor for flood analysis, which was directly related to runoff and peak value prediction. Although the impact of rainfall spatial and temporal heterogeneities on flood runoff in the urban watershed attracted great attention, the responding mechanism of peak runoff to rainfall spatial and temporal heterogeneities still needs to be analyzed.
Therefore, in this research, the impact of rainfall spatial and temporal heterogeneities on peak runoff under multiple subsurface impermeability levels and rapid urbanization patterns will be investigated. Rain storm and remote-sensing data will be combined with high spatial and temporal resolution to generate a series of design rainfall events under a variety of rainfall return\duration periods. At the same time, a number of rainfall scenarios obtained with the same rainfall return periods\durations will be developed under the same rainfall totals and will be used as inputs into a distributed hydrological model. Multiple scenarios with diverse subsurface impermeability values and a rainfall spatio-temporal heterogeneity index system will be proposed through the adoption of a covariance analysis method to quantitatively reveal the impacts of rainfall temporal and spatial heterogeneities on peak runoff. Innovation of this research lies in: (1) combination of a rainfall generator model (i.e., RainyDay) based on a stochastic storm transposition (SST) technique and short time series remote-sensing rainfall data to generate designed rainfall events that will be similar to the actual rainfall spatial and temporal processes. This could improve the accuracy of designing rainfall calculation in the current rapidly changing urban environment, (2) a rainfall spatial and temporal heterogeneities index system will be developed which is beneficial to reveal how the changing characteristics of rainfall spatial and temporal distribution and the impacts on peak runoff, and (3) in-depth analysis of the impacts on runoff peak under multiple urban developed environments, helping understand mechanisms and changing rules of urban flooding and improve capability in flood control and prevention.
2 OVERVIEW OF THE STUDY
2.1 Data and information
In this research, rainfall temporal and spatial distribution under multiple rainfall frequencies were generated based on gridded meteorological data set (0.1° × 0.1°) of hourly precipitation from China National Meteorological Science Data Center (data source: http://www.cma.gov.cn/2011qxfw/2011qsjgx/, accessed on November 16, 2020). The data set is based on the hourly precipitation observations from over 30,000 ground-based automatic meteorological observation stations in China. The observation data is then optimized and validated through CMORPH (the Climate Prediction Center Morphing algorithm) satellite precipitation data. The total error is less than 10%, and the error for heavy precipitation and in sparse areas is less than 20%, which is more accurate than similar products and has been widely employed in many precipitation studies (Ma et al., 2020). The rainfall data from 2008 to 2016 were used to estimate the design rainfall events in this research. To support calibration and verification for the runoff model, we used the observed rainfall data from four hydrological stations (i.e., Guandong, Wanyao, Shangcun, Gaofeng, and Summit for measuring flow data from the Qiling hydrological stations). In addition, the hourly realistic rainfall data from 2001 to 2020 provided by GsMAp were used to verify the area design rainfall under different rainfall frequencies through estimating from the Rainyday.
2.2 Statement of problems
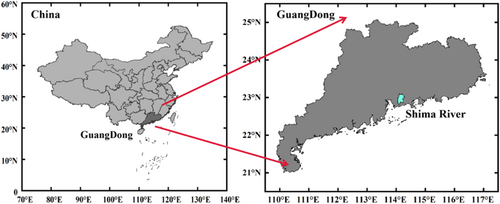
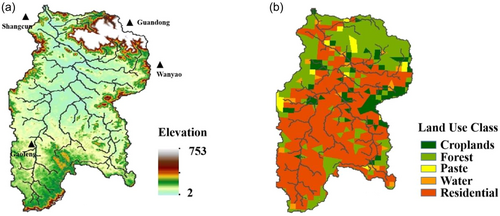
Shima River Basin (SMRB) in Guangdong Province of South China is employed as the demonstrative site, ranging from 22.58° N to 22.95° N in latitude, and from 114.00° E to 114.23° E in longitude (Figure 1). In the past 30 years, SMRB has experienced a complex urbanization process, leading to significant changes in land use patterns. In this basin, the urbanization ratio is up to 70% in 2020 and the proportion of built-up land areas has increased to 38% (Figure 2). The total area of the basin is 1249 km2. The length is 88 km. Geographically, SMRB belongs to a subtropical monsoon climate, and the rainfall has the characteristics of large quantity and high intensity, in which the annual average rainfall is 1300 to 2500 mm, and the rainfall seasons mainly concentrated on the period from April to September. Climate change and accelerating urbanization have great impact on regional hydrological cycle, which increase the flooding problems and also caused serious economic losses (Li et al., 2022). On May 11, 2014, the short duration of heavy rainfall in the Shima River basin, which had recorded 330 mm rainfall, caused the river and unicipal drainage to be poured back, resulting in direct economic losses of more than 56 million Yuan. On August 29, 2018, a heavy rain hit again, with 400.6 mm of rainfall in 24 h, resulting in direct economic losses of more than 8 million RMB.
3 METHODOLOGY
3.1 Rainfall event generation
RainyDay storm generator was developed by Wright et al. (2017) based on Python platform. It can combine with a technique known as stochastic storm transposition (SST) to produce a large number of intense rainfall events using gridded precipitation data (e.g., remotely sensed rainfall products). These rainfall events can be used to examine the extreme rainfall statistics for a basin of interest or to drive a rainfall-runoff model to analyze flooding frequency. Through defining a domain outside the study area with the same climatic characteristics and precipitation processes and transposing storms from the external domain to the study area that can increase the rainfall events and expand the sample capacity of the study area. Figure 3 shows two moving rainfall scenarios based on the SST technique. RainyDay rainfall generator merely changes the spatial location of rainfall scenarios, but not the temporal distribution (Wright et al., 2020; Zhu et al., 2018).
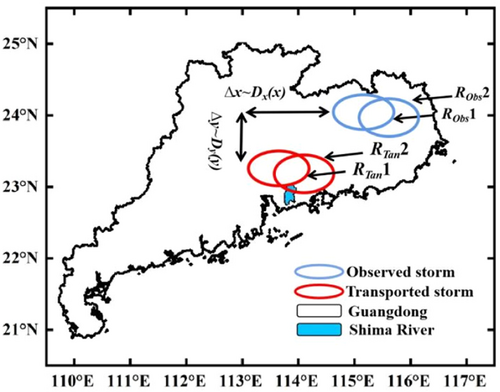
The RainyDay storm generator requires that the maximum rainfall transposition space has the same climatic conditions and similar rainfall characteristics as the study area, and also requires that the maximum transposition space covering the study area is more than 10 times larger than the area of the study area. In this research, SMRB was selected as the study area, and the maximum transposition space was chosen from Guangdong province, which has the same climatic characteristics and belongs to the same administrative region as the study area (i.e., Figure 1). Through building up a parental storm data set, this data set includes the m largest storms of t-hour duration in n synthetic years. The m storms are the largest storms randomly selected from any 24-h sustained raining. It should be paid attention that the size and shape of the calculating width of the parent storm data set must be consistent with the research domain, and the transported direction also roughly keep up with the direction of rainfall occurring in the research domain.
Repeat above to generate the largest storms with the return period (from −5 to −500 years) and t duration (t = 2, 6, 24 h) in Tmax times. Then these Tmax storms are assigned in i (i = 5…Tmax) and ranked in Reverse. Based on it, the exceedance probability () and the return period () are carried out. For some special return periods (such as −5, −10, −20, −50, −100, and −500 years) were made for an uncertainty analyzes by generating lots of different types Tmax maximal rainfall samples to find the uncertainty between different return periods.
3.2 Hydrological modeling
3.2.1 GSSHA model
Coping with complex environments, this research adopted GSSHA (Gridded Surface/Subsurface Hydrologic Analysis), a two-dimensional, physically based hydrological model that divides the watershed into each grid as a computational unit and assigns the geo-hydrological attributes to each grid. Previously, GSSHA has been effectively applied in flood studies in a number of cities or urban watershed, such as Little Sugar Creek in Charlotte of North Carolina (Wright et al., 2014), Ishigaki Island of Japan (Sith & Nadaoka, 2017), and Dead Run watershed of Maryland (Ogden et al., 2011; Smith et al., 2015). This modeling package has many functions including two-dimensional land surface flow, one-dimensional stream flow, one-dimensional infiltration, two-dimensional groundwater, and simulation of sediment transport in shallow soils, land surfaces, rivers, and open channels. The previous research demonstrated that GSSHA could adequately capture the urban flood response and obtain high simulation accuracy without the need of “significant calibration.” It is a suitable tool for solving problem of inadequate hydrological information in urban regions (Al-Areeq et al., 2021; Cristiano et al., 2019).
In this research, 30 m DEM elevation data were employed to develop the hydrographic base of the model and the river flow direction through setting the watershed outlet to determine the study basin. Also, the resolution of the basic grid cell in the GSSHA model was set to 800 m × 800 m and the time step of the simulation was set to 300 s. The infiltration process was selected from the Green-Ampt with redistribution equation. The infiltration parameters were determined based on soil types, which were obtained from the Harmonized World Soil Database (Nachtergaele et al., 2009). The specific infiltration parameters were based on the Rawls & Brakensiek soil infiltration parameters estimated values (Rawls & Brakensiek, 1989). The roughness coefficient and the imperviousness of watershed underlying surface were obtained from the 2018 Chinese land use type database (http://www.dsac.cn/DataDownLoad). The one-dimensional diffusion wave equation and Alternating Direction Explicit equation were used to calculate the river flood wave motion and surface runoff processes, respectively. We selected three rainfall events in the Shima River basin during the observing period in 2009 to calibrate and validate the GSSHA model.
3.2.2 Calibration and verification
GSSHA have an automatic calibration fraction, which should first define the relevant important hydrological parameters as changeable values, and then set their initial, minimum and maximum values so that each parameter can be randomly fluttered within the setting minimum and maximum values during each calibration. In each calibration process, the parameters values are randomly changed within the range of the set minimum and maximum values. The Multilevel Single Linkage calibration method was selected to compare the simulated runoff results with the measured runoff values for several times, and the parameter with the highest degree of fit is selected as the optimal parameter. Rainfall and flow measured data in 2009 was used in this research. The rainfall events from August 3 to 15 were used for the model calibration. The calibration values for a few important parameters are shown in Tables 1 and 2.
| Land use type | Surface roughness |
|---|---|
| Pasture | 0.11 |
| Cropland | 0.13 |
| Woodland | 0.11 |
| Urban built-up land | 0.014 |
| Stream | 0.067 |
| Soil type | ||||
|---|---|---|---|---|
| Sandy loam | Sandy clay loam | Silt clay loam | Sandy clay | |
| Hydraulic conductivity (cm/hr) | 0.218 | 0.0298 | 0.0207 | 0.010045 |
| Capillary head (cm) | 11.01 | 21.85 | 27.3 | 23.9 |
| Porosity (m3/m3) | 0.412 | 0.33 | 0.432 | 0.321 |
| Pore distribution index (cm/cm) | 0.378 | 0.319 | 0.177 | 0.223 |
| Residual saturation (m3/m3) | 0.041 | 0.068 | 0.04 | 0.109 |
| Field capacity (m3/m3) | 0.207 | 0.255 | 0.366 | 0.339 |
| Wilting point (m3/m3) | 0.095 | 0.148 | 0.208 | 0.239 |
| Inital moisture | 0.41 | 0.33 | 0.43 | 0.32 |
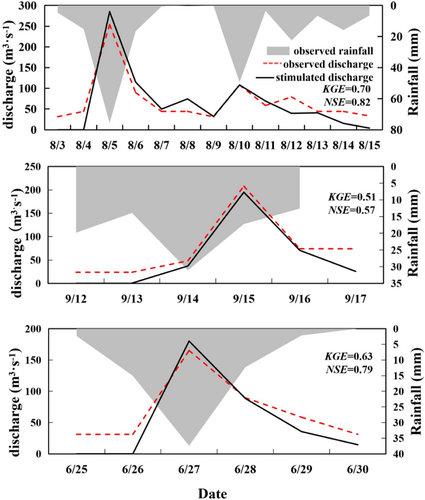
Many studies proposed that the simulated values can be regarded as satisfactory when NSE and KGE higher than 0.5 (Dechmi et al., 2012; Gupta et al., 2009; Moriasi et al., 2007). That means the model is feasible. From the simulation evaluation results in Table 3, it can be seen that the values of KGE and NSE for two events is higher than 0.5, the deviation between simulated and measured peak runoff (Dp) is less than 10%, and the deviation between simulated and measured total runoff volume (Dv) is less than 20%. The results indicate that the GSSHA model would be reasonable and reliable and it could be used in the subsequent studies.
| Date | Observed rainfall (mm) | Observed runoff (m3) | Observed peak runoff (m3 s−1) | Stimulated runoff (m3) | KGE | NSE | Dv | Dp | |
|---|---|---|---|---|---|---|---|---|---|
| Evnet1 | 08.03-15 | 210.96 | 7.54E+07 | 253.5 | 7.19E+07 | 0.70 | 0.82 | −4.77% | 9.46% |
| Evne2 | 09.12-17 | 94.66 | 3.38E+07 | 208.0 | 2.73E+07 | 0.51 | 0.57 | −19.20% | −6.69% |
| Evnet3 | 06.25-30 | 69.27 | 3.25E+07 | 165.1 | 2.69E+07 | 0.63 | 0.79 | −17.06% | 8.39% |
- Abbreviations: KGE, Kling–Gupta efficiency; NSE, Nash–Sutcliffe efficiency.
3.3 Spatial and temporal distribution of a rainfall index system
- 1.
RWD is the ratio of the time of peak rainfall occurrence to the total rainfall time:
()where is the total duration of rainfall (h) and is the duration of rainfall occurrence to the peak (h). - 2.
PCI (Michiels et al., 1992; Oliver, 1980) is widely used to characterize the concentration of rainfall and its temporal distribution changes (Cannarozzo et al., 2006; Luis et al., 2011). The specific formula is as follows:
()where is the rainfall volume in time. Internationally, the PCI index is divided into three levels (Oliver, 1980): (i) PCI ≤ 10 meaning that the precipitation is evenly distributed; (ii) 11 ≤ PCI < 20 meaning that the precipitation is seasonal and have a certain concentration; and (iii) i PCI ≥ 20 meaning that the precipitation distribution is abnormally concentrated and the temporal distribution of precipitation changes violently. - 3.
Rmax is considered the maximum average rainfall intensity in the study area:
()where means the average rainfall intensity per unit time (mm/h). - 4.
tg in this study we divide the design rainfall volume into each grid, so where the grid zone with the largest cumulative total rainfall in the T rainfall duration is denoted as the total rainfall center.
- 5.
A25 is defined as the area where the rainfall intensity exceeds 25 mm/h. The calculation formula is as follows:
()where is the area with the rainfall intensity of more than 25 mm/h, is the total area of the watershed.
3.4 The contribution of rainfall spatial and temporal heterogeneities on flood peak
Analysis of variance (ANOVA) is useful for estimating the variation of response due to different factors (Bosshard et al., 2013; Ma et al., 2018) including continuous, discrete, and mixed variables (Cardinal & Aitken, 2013). Yip et al. (2011) used ANOVA to partition sources of variability in global climate model simulations, while (Meresa & Romanowicz, 2017) apply it to hydrologic extremes. In this study, we use ANOVA to partition the contributions to simulate the flood peak variability of the rainfall spatial and temporal distribution index system including RWD, PCI, Rmax, tg, A25 and their interactions.
4 RESULT ANALYSIS
4.1 Estimating design rainfall with spatial and temporal heterogeneities
The RainyDay storm generator is used to generate design rainfall with return periods ranging from 5 to 500 years and rainfall durations of 2, 6, and 24 h. The design rainfall for each return period contains 20 realizations with different spatial and temporal distribution characteristics. Each realization value is unique, as shown in the shaded area of Figure 5 for different return periods and durations. It's worth noting that, unlike the design rainfall calculated by using traditional methods, the RainyDay-based design rainfall has the same temporal distribution o as the actual rainfall events occurring in the maximum transposition domain, and RainyDay just changes the spatial location of the rainfall, which indicates that the calculated temporal distribution of the design rainfall is more consistent with the actual rainfall.
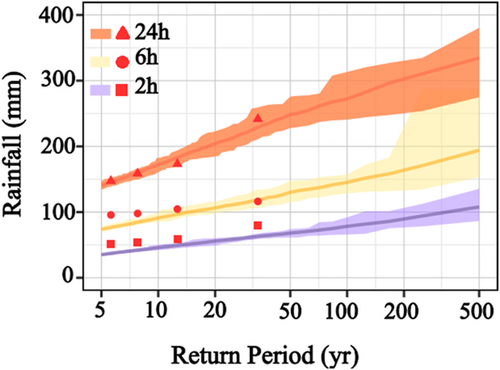
In general, the design rainfall intensity estimated based on RainyDay rainfall generator shows an increasing pattern with increasing rainfall duration or return period. In addition, the longer the rainfall duration and return period, the larger the range of the design rainfall variation interval. The minimum, maximum, and mean values of the design rainfall calculated by RainyDay are compared with the 50-year observed rainfall data, and are found to be similar (Figure 5). Although RainyDay generally underestimates the realistic design rainfall at a low rainfall duration of 2 h, this underestimation would decrease as the return period increases. The overall relative error between the RainyDay-based design rainfall and the observed rainfall is reduced to 2%–14% when the rainfall duration is 6 h. When the rainfall duration is 24 h, the relative error is less than 3%, and the observed design rainfall falls within the range estimated based on RainyDay. It is indicated that the design rainfall estimated by RainyDay can basically estimate the same design rainfall as the observed rainfall (Figure 5). The design rainfall estimated based on RainyDay has credibility and scientific validity to a certain extent and can be used as rainfall input data for further analyzing the response of urban watershed peak runoff to the rainfall spatial and temporal heterogeneities.
4.2 The analysis of spatial and temporal distribution of rainfall index system
To assess the influence of rainfall spatial and temporal heterogeneities on the peak runoff, in this section we would reconstruct the 20 realizations under each return period in rainfall duration into new rainfall scenario with the same rainfall intensity and without changing their rainfall temporal and spatial structures. In particular, take the ratio of each design rainfall scenario to the mean value that the above-mean rainfall realization is scaled down, and the rainfall of the realizations with below-average rainfall is scaled up, so that all 20 realizations have the same rainfall intensity. Finally, the reconstructed rainfall scenarios were used as the rainfall input to the watershed runoff model to analyze the response of peak runoff to the spatial and temporal heterogeneities of rainfall.
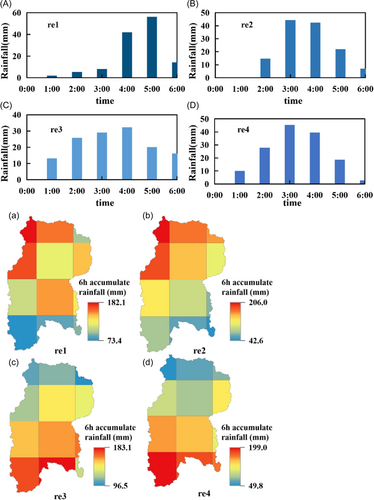
To further demonstrate better spatio-temporal heterogeneity of rainfall, here we select four rainfall events (re1, re2, re3, re4) with a rainfall duration of 6 h and rainfall return period of 50-year for illustration. From Table 4, we can find that the rainfall events of re1, re2, re3, and re4 all have a total rainfall of 130.10 mm, but there are significant differences in the spatial and temporal structures. Figure 6 shows visible disparities in the temporal distribution of rainfall in different rainfall scenarios. The earliest rainfall peaks occur in re2 and re4, while the latest occurs in re1. There is also a diversity in rainfall concentration, for example, the highest concentration in re1 and the lowest in re3, where the aberration rate is about 18%. In addition, from the spatial distribution of the four rainfall events, there are significant differences in the rainfall totals of each grid (Figure 6). The spatial rainfall centers of scenarios re1 and re2 are near the drainage outlet of the basin, while those of scenarios re3 and re4 are in the upper part of the basin. In particular, even though the spatial rainfall centers of rainfall scenarios re1 and re2 are in the same location, they are not evenly distributed in terms of rainfall amount. Specifically, the rainfall intensity of rainfall event re2 is greater than that of rainfall event re1 for spatial coverage greater than 25 mm/h.
| Rainfall event | Rainfall (mm) | RWD | PCI | Rmax (mm/h) | tg | A25 |
|---|---|---|---|---|---|---|
| re1 | 130.1 | 0.83 | 32.03 | 56.24 | 1 | 0.298 |
| re2 | 130.1 | 0.50 | 26.48 | 44.40 | 1 | 0.341 |
| re3 | 130.1 | 0.67 | 18.17 | 32.38 | 11 | 0.377 |
| re4 | 130.1 | 0.50 | 23.31 | 45.46 | 10 | 0.408 |
4.3 The variability of peak runoff in different impermeable urban watersheds
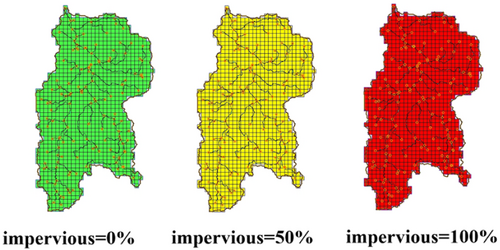
Cristiano et al. (2017) state that the impermeability of the subsurface must increase with the urbanization process, Alfonso et al. (2016) indicate that the increase of impermeability makes the runoff process in the watershed more dramatically. To gain more insight into how the peak runoff is affected by the spatial and temporal heterogeneities of rainfall during urbanization, in this study we would construct three different urban environments, such as a original undeveloped urban environment, an urban environment with the current level of development, and a highest developed urban environment with imperviousness of 0%, 50%, 100%, respectively (Figure 7).
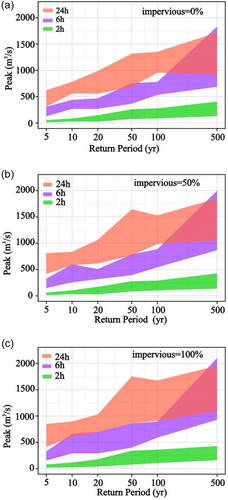
As shown in Figure 8, the peak runoff from a smaller rainfall return period or a shorter rainfall duration can be larger than that of a larger rainfall return period (longer rainfall duration). This is mainly because the spatial and temporal heterogeneities of rainfall has a significant effect on the peak runoff. For example, under the urban scenario with impervious = 50%, the peak runoff for a rainfall return period of 10-year is larger for the rainfall duration of 6 h rainfall event than for the rainfall duration of 24 h rainfall event. In the rainfall duration of 6 h, the peak runoff for rainfall events with a 50-year rainfall return period is larger than that for the 100-year rainfall event. This discrepancy becomes more apparent with the increase of rainfall duration and return period. Otherwise, it is exacerbated by the increase in urban subsurface imperviousness, with more runoff peaks for small rainfall return periods or short rainfall durations than for large rainfall return periods or long rainfall durations. For example, for a rainfall return period of 500-year, more rainfall scenarios with a rainfall duration of 6 h produce larger peak runoff than those with a rainfall duration of 24 h in an urban environment scenarios with impervious = 100% than in an urban scenarios with impervious = 0%. Similarly, at a rainfall duration of 6 h, the urban environment with impervious = 100% can produce larger peak runoff than in the impervious = 50% urban environment with a rainfall return period of 20-year than that with a rainfall return period of 50-year. This indicates that the underlying surface's imperviousness has a higher impact on peak runoff heterogeneity. It can be seen that the effect of rainfall spatial and temporal heterogeneities on peak runoff is sometimes greater than the effect of rainfall duration and volume, that is, the larger rainfall volume or duration does not always imply a larger peak runoff, but the smaller the rainfall volume or shorter the rainfall duration, the larger the peak runoff can be, especially in urban watersheds coupled with changes in subsurface impermeability.
4.4 The impact of rainfall spatial and temporal heterogeneities on peak runoff
Analysis of covariance was used to quantitatively reveal the contribution effects of each indicator of rainfall spatial and temporal heterogeneities index system including RWD, PCI, Rmax, tg, A25 and their interactions on peak runoff variability in urban watersheds under different underlying surface imperviousness. Figure 9 shows that in our already built different urban developed environment scenarios, the contribution of RWD and PCI to peak runoff is the largest, where the effect of rainfall peak coefficient (RWD) on peak runoff decreases with an increase in rainfall duration and rainfall return period. For example, such effect can reach 50% at a 2-h rainfall duration, but decreases to less than 1% at 24-h rainfall duration. The contribution of PCI on the peak runoff surges with the increase of rainfall duration and rainfall return period, and its contribution can reach up to 80% or more. Rmax shows a pattern in which the contribution increases with the increase of rainfall return period and decreases with the increase of rainfall duration, with the contribution ranging between 10% and 40%. The contribution of tg on the peak runoff is relatively greater at short return periods and it would decrease as the return period increases. The contribution of tg on the peak runoff is greater at long rainfall duration than at short rainfall duration, that is, at long rainfall duration with short return period, the influence of the total rainfall center on the peak runoff is greatest up to 40%. A25 also shows the same contribution variation rule on the peak runoff. These two rules indicate that the spatial distribution of rainfall has a certain non-negligible influence on the peak runoff.
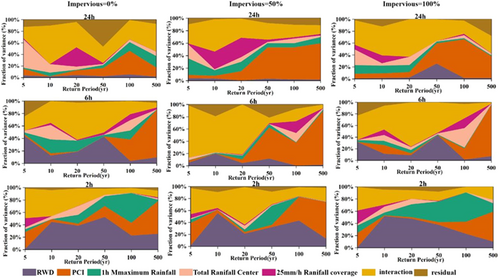
In contrast, the impact of each indicator on the peak runoff is tremendous in different imperviousness urban environments for the same rainfall duration (Figure 9). Although RWD and PCI still have the strongest contribution on the peak runoff, the two indicators show different rules with increasing the imperviousness of subsurface watershed at each rainfall duration. Specifically, the contribution of rainfall peak coefficient (RWD) on peak runoff increases with increasing the imperviousness of underlying surface during rainfall durations of 2 and 24 h, while the effect of r on peak runoff increases with increasing imperviousness of the underlying surface at 6-h rainfall duration, but the overall effect of rainfall peak coefficient (RWD) on peak runoff is greatest in the fully developed urban environment. The contribution of PCI to peak runoff does not increase with the increase of subsurface imperviousness, but the contribution to peak runoff is greater at 50% imperviousness than at 100% imperviousness in urban environment. The contribution of Rmax on the peak runoff is increased with the increase of imperviousness of underlying surface when the rainfall duration is 2 and 24 h, but the contribution on the peak runoff decreases with the increase of imperviousness when the rainfall duration is 6 h; that is, the effect of 1 h maximum rainfall on the peak runoff is greatest when the imperviousness of the short calendar time is 100%. The contribution of both total rainfall center (tg) and 25 mm/h rainfall coverage (A25) on peak runoff appear in a rule of decreasing with increasing imperviousness. It is worth mentioning that the interaction among the indicators in different subsurface scenarios also has a significant impact on each return period and rainfall duration, i.e., the influence of the interaction between the elements on the peak runoff cannot be ignored.
5 CONCLUSIONS
Spatial and temporal heterogeneities of rainfall has become prominent and has profoundly influenced the regional runoff processes. To investigate the responses of peak runoff to spatio-temporal heterogeneity of rainfall during urban development, a highly urbanized Shima River basin in south China was employed as a study area. RainyDay storm generator and the 0.1° × 0.1° grids rainfall database were used to generate the design rainfall under multiple spatio-temporal distribution scenarios. Urban development scenarios were developed under multiple impermeability of underlying surface in the Shima River basin, which were used as rainfall input to the distributed hydrological model GSSHA. Combining the constructed rainfall spatial and temporal heterogeneities index system and the covariance analysis method, we quantitatively revealed the influences of rainfall spatial and temporal heterogeneities on peak runoff under multiple imperviousness scenarios. The main conclusions are as follows: (i) By comparing the design rainfall calculated from the measured rainfall, the design rainfall estimated by RainyDay storm generator was basically similar to the measured design rainfall, although RainyDay underestimates to a certain extent when the rainfall duration was short, but this underestimation would improve significantly with the increase of the rainfall return period or the rainfall duration; (ii) The spatial and temporal heterogeneities of rainfall had a significant effect on the peak runoff. Such effect was greater when the rainfall return period was small or the rainfall duration was short. In addition, the spatial and temporal heterogeneities of rainfall would have a large influence on the peak runoff due to the change of impermeability of the coupled urban subsurface; and (iii) The contribution of each indicator of rainfall spatial and temporal heterogeneities index system to the peak runoff under different underlying surface scenario showed significant different. With the increasing rainfall duration or rainfall return period, RWD and Rmax would decrease; the rainfall concentration (PCI) and total rainfall center (tg), 25 mm/h threshold rainfall spatial coverage (A25) increased, for which the contribution of RWD could be up to 50% and PCI is up to 80%. The influence of rainfall spatial and temporal heterogeneities indicators on the peak runoff contribution would be complicated as the impermeability of urban underlying surface increases. As well tg, A25 were decreased with increasing imperviousness, Rmax is increased with increasing imperviousness at rainfall duration are 2 and 24 h, while the opposite is the case for 6 h rainfall duration.
ACKNOWLEDGMENTS
This research was supported by the Program for Guangdong Introducing Innovative and Entrepreneurial Teams (2021ZT09), the Key-Area Research and Development Program of Guangdong Province (2020B1111380003), and the National Natural Science Foundation of China (U20A20117). We would also like to express our gratitude to the anonymous reviewers and the editors for providing suggestions and comments that are extremely helpful in improving quality of this paper.
ETHICS STATEMENT
None declared.
Open Research
DATA AVAILABILITY STATEMENT
The data that support the findings of this study are available from the corresponding author upon reasonable request.


