Projection of future dry-wet evolution in Northwest China and its uncertainty attribution analysis
Abstract
Projection of future dry-wet evolution is essential for making long-term regional climate adaptation strategies. In this study, the projection of regional dry-wet evolution is conducted with a careful consideration on uncertainty attribution. The Evaporative Stress Index (ESI) is adopted due to its physical mechanisms for taking evaporative demand into account. A three-dimensional framework is constructed for quantifying the range of uncertainty of the ESI in which six Global Climate Models (GCMs) in Coupled Model Intercomparison Project 6 (CMIP6), three latest Shared Socioeconomic Pathway (SSP) scenarios, and six Potential Evapotranspiration Models (PETMs) are used. The framework provides 108 different ESI simulations for two future periods: 2041–2070 (mid-future) and 2071–2100 (far-future). An agglomerative-hierarchical clustering method and the Analysis of Variance methodology are employed to evaluate the relative contribution of each uncertainty source. The region of Northwest China is used as a case to illustrate the effectiveness of the proposed framework. The results indicate that most of the parts in Northwest China would experience dry mitigation in both mid-future and far-future periods. Projected ESI by PM[CO2] model and ACCESS-ESM1-5 suggestes a higher tendency for dry mitigation. Hierarchical clustering analysis of the 108 sets of ESI predictions indicate that most clusters are dominated by GCM forcing, and one cluster is dominated by the SSP1-2.6 scenario. Furthermore, GCM-related uncertainty′s relative contribution to the total projection uncertainty is the greatest, with an average value of 49.98% in the far future (i.e., 2071–2100 s). Although the contribution of SSP uncertainty is smaller (21.68%−28.43%), it increases in far-future over mid-future. The case study indicates that the large scale ensemble prediction of ESI and its uncertainty analysis provide a more comprehensive data set on climate change and help water managers to gain in-depth understanding of future trends of drought projections.
1 INTRODUCTION
The scale of human activity has begun to cause significant disruption to complex natural systems such as the global climate. The Sixth Assessment Report of the Intergovernmental Panel on Climate Change (IPCC) shows that the assertion that human activities have caused global warming with a high degree of confidence (IPCC, 2021). For every 1°C increase in temperature, the water vapor content of the atmosphere will increase by 7%, resulting in an increase in the intensity and frequency of precipitation (Held & Soden, 2006; Wentz et al., 2007). Meanwhile, the increase in temperature will cause a significant increase in atmospheric evaporation demand, and these changes will affect the dry-wet conditions and has implications for regional food security and ecological safety. Northwest China (NWC) is an important base for commercial grain and cotton, but it is also an ecologically fragile arid area and is extremely sensitive to changes in climate and water resources (Y. Shi et al., 2007). Water resource is the basic guaranteed natural resources and strategic economic resources of the region, and is the most critical factors restricting economic and social development and ecological environment construction (Qin et al., 2021). With the construction of the Silk Road Economic Belt and the implementation of the Evolutionary Path of Eco-Conservation and High-Quality Development in the Yellow River Basin, the sustainable development of NWC is increasingly appreciated (Gao & Zhang, 2021; Li et al., 2015). To address possible risks of climate change, it is necessary to develop predictions of dry-wet conditions in NWC under future scenarios from the perspective of water supply and demand.
Drought indices are powerful tools for assessing dry-wet conditions and are generally developed based on one or more meteorological or hydrological factors (Zuo et al., 2019). It has been shown that drought indices that consider the combined effects of precipitation and PET perform more effectively than single-factor indices, and the indices that considering both actual evapotranspiration (AET) and PET are more effective in monitoring drought than those derived from a single evapotranspiration factor (W. Wang et al., 2018). For predicting dry-wet conditions in the 21st century, the widely used method is to input future meteorological data simulated by Global Climate Models (GCMs) into PET models (PETMs) under future climate scenarios, and hence calculates drought index. However, future climate scenarios (Shared Socioeconomic Pathways, SSPs) cannot be accurately predicted (O'Neill et al., 2016), and the actual generalized optimal GCMs and PETMs cannot be determined (L. Shi et al., 2020; H. M. Wang et al., 2020), so there is inevitable uncertainty in the prediction of dry-wet conditions arising from SSPs, GCMs, and PETMs. Approaches based on a single SSP, GCM, or PETM cannot reach reliable conclusions.
Presently there are two approaches to deal with uncertainty. One approach is to reduce uncertainty by improving simulation techniques and correcting model bias, however, uncertainty is an internal property of the physical process and cannot be completely eliminated (Howe et al., 2019). The other approach is to use multiple representative PETMs, SSPs, and GCMs for ensemble prediction, and then obtain a data set consisting of multiple sets of predictions, thus incorporating uncertainties that cannot be eliminated at the present stage into the final decision-making process. In recent years, both of the above approaches for dealing with uncertainty have been widely used in various fields (Tian et al., 2015). Sun et al. (2019) used a downscaling approach to improve the accuracy of GCM simulations before performing climate prediction.
To reduce the uncertainty of future climate prediction in a targeted manner, the study of identifying and quantifying the relative importance of each uncertainty source has become a new research spotlight. Morim et al. (2019) applied an agglomerative-hierarchical clustering (AHC) analysis to a large ensemble of global wave climate projections. This approach enables the clustering of projections with high similarity in terms of spatial pattern and magnitude, and the identification of the factor or model that plays a dominant role in the clustering to ferret out the main source of uncertainty. Many researchers adopted the analysis of variance (ANOVA) methodology, which has been widely applied in many fields, such as prediction of biology, agriculture, and hydrology, to further quantify the relative importance of each uncertainty source (L. Shi et al., 2022; Tao et al., 2018; Yuan et al., 2022). For example, Lai et al. (2022) compared the relative importance of the uncertainty from GCM, RCP, and statistical downscaling approaches in reference crop evapotranspiration predictions, and found that GCM is the major source of uncertainty. Senatore et al. (2022) quantified the uncertainty of the climate models and correction methods in the projections of available water resources and suggest the primary source of uncertainty is the driving GCM. The above studies provided useful references for the exploration of uncertainty in future climate prediction, however, research on multiple sources of uncertainty in future drought prediction is still quite limited, and it is necessary to redescribe and quantify the impact of each uncertainty source based on the latest meteorological simulation data provided by Coupled Model Intercomparison Project 6 (CMIP6).
The purpose of this study is to objectively analyze the future evolution of dry-wet conditions in NWC, and to understand the impact of multiple uncertainty sources on the prediction results. In this study, we first improves the accuracy of the GCMs through statistical downscaling methods and the performance of the PETMs by regression correction to minimize the uncertainty in the prediction. A three-dimensional ESI estimation framework is constructed based on three SSP scenarios, six GCMs, and six PETMs (including the Penman–Monteith model (Penman, 1948) recommended by the Food and Agriculture Organization of the United Nations, the PM[CO2] model which takes into account the effect of carbon dioxide (Yang et al., 2019), the regression-corrected empirical PETM, and machine learning-based PETM), to obtain 108 sets of Evaporative Stress Index (ESI) prediction results in NWC. Finally, an AHC method and the three-factor ANOVA method are applied to describe and quantify the relative importance of each main uncertainty source and their nonlinear interactions. This study could help researchers to identify priorities for further reducing uncertainty in the prediction under changing environments, and provide useful information for developing adaptive climate control strategy in NWC.
2 STUDY AREA AND DATASETS
2.1 Study area
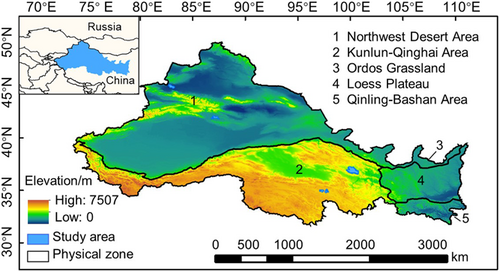
NWC spans the Yellow River Basin, Yangtze River Basin, and the Inland River Basin, including the Xinjiang Uyghur Autonomous Region, Qinghai Province, Gansu Province, Ningxia Hui Autonomous Region, and Shaanxi Province. The climate of NWC is influenced by the combined effects of East Asian monsoon circulation, westerly circulation, and plateau monsoon over the Tibetan Plateau, and is geographically complex (including plateaus, basins, and mountains), so this paper divides the study area into Northwest Desert Area, Kunlun-Qinghai Area, Ordos Grassland, Loess Plateau and Qinling-Bashan Area (Figure 1), according to the comprehensive physical geographic zoning scheme of China proposed by Zhao (1983). Meanwhile, the water resource system in NWC based on mountain precipitation and snow melt recharge is fragile and relatively weak in adaptive capacity to climate change, and NWC has produced large quantities of water-intensive agricultural products for a long time, therefore, NWC is extremely sensitive to changes in dry and wet conditions.
2.2 Climate data and future climate scenarios
Climate data adopted in this study include historical period observations and future simulated data. Observations of monthly mean temperature, maximum temperature, minimum temperature, and relative humidity for the historical period (1985–2014) were obtained from the CN05.1 data set developed by J. Wu et al. (2017). CN05.1 data set was interpolated from observations at 2416 stations of China Meteorological Administration. Wind speed and net radiation observations were obtained from the ERA5 reanalysis data set established by the European Centre for Medium-Range Weather Forecasts (https://cds.climate.copernicus.eu/#!/home). AET data were acquired from the National Tibetan Plateau Scientific Data Center (D. Ma et al., 2019; Ma & Szilagyi, 2019).
Projections of dry-wet conditions in future periods are based on simulated meteorological data from GCMs participating in CMIP6. CMIP6 is the latest coupled model intercomparison project organized by the World Climate Research Programme's Working Group on Coupled Modelling (Eyring et al., 2016), and the projections of GCMs have been extensively used in many fields. However, the actual generalized unique optimal GCM does not exist, therefore, we selected six GCMs of CMIP6 to estimate uncertainties arising from imperfections in physical and numerical formulations from the actual climate system. The research institutions and resolutions of six GCMs (ACCESS-ESM1-5, EC-Earth3, GFDL-ESM4, MIROC6, MRI-ESM2-0, and NorESM2- MM) are shown in Table 1.
| Name of GCMs | Research Institutions | Resolution (Lat/Lon°) |
|---|---|---|
| ACCESS-ESM-1-5 | Commonwealth Scientific and Industrial Research Organization and Bureau of Meteorology | 1.2 × 1.8 |
| EC-EARTH3 | European Community Earth Consortium | 0.7 × 0.7 |
| GFDL-ESM4 | Geophysical Fluid Dynamics Laboratory | 1.0 × 1.3 |
| MIROC6 | Atmosphere and Ocean Research Institute, National Institute for Environmental Studies, Japan Agency for Marine-Earth Science and Technology | 1.4 × 1.4 |
| MRI-ESM2-0 | Meteorological Research Institute | 1.1 × 1.1 |
| NorESM2-MM | Norwegian Climate Centre | 1.9 × 2.5 |
- Abbreviations: CMIP6, sixth Phase of the Coupled Model Intercomparison Project; GCM, Global Climate Models.
The above GCMs can provide meteorological data required for the study during 1985–2100, including temperature, relative humidity, radiation, and wind speed prediction data. AET predictions during 1985–2100 were also obtained from the GCMs participating in CMIP6 (https://esgf-node.llnl.gov/search/cmip6/). Atmospheric carbon dioxide concentration data for future climate scenarios were obtained from the website of https://greenhousegases.science.unimelb.edu.edu.au/#!/view. In general, the simulation of meteorological factors from GCM output are not accurate in describing the regional-scale climate change due to insufficient resolution. Therefore, this study adopted the widely used Bias Correction and Spatial Disaggregation method (Wood et al., 2002, 2004) to correct the bias of GCM, and downscale the original grid to 0.25° × 0.25° resolution. It has been indicated that the BCSD downscaling method has good applicability in China and is a suitable method to reduce simulation errors (Wang & Chen, 2013; Yang & Tang, 2023). Additionally, the BCSD method is not model-dependent and has shown improvement in the simulation of various GCMs. To evaluate the performance of the BCSD downscaling method, we compared the accuracy of GCM simulations of the mean and standard deviation of meteorological elements before and after downscaling, and the results showed that BCSD effectively reduced the systematic errors of the simulated data. Taking AET as an example, the mean AET simulated by GCM was generally overestimated before downscaling, and after bias correction and spatial disaggregation, the simulated bias evenly distributed on both sides of “0,” and the absolute value of the simulated bias decreased.
Three SSPs selected in this study have been widely used in future climate studies. SSP1-2.6 represents a future scenario with low greenhouse gas emissions and follows a sustainable development pathway; SSP2-4.5 represents a scenario that maintains current economic and social development trends and follows a moderate development pathway; SSP5-8.5 represents a future scenario with high greenhouse gas emissions and follows a conventional development pathway.
3 METHODOLOGY
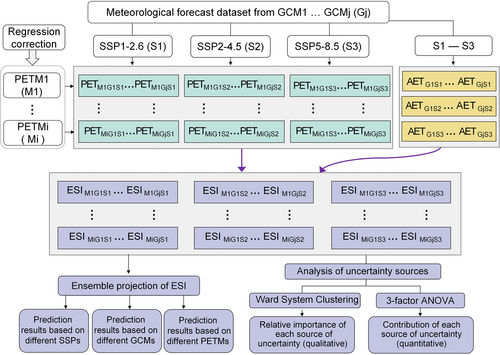
This section describes the methodology for forecasting and uncertainty attribution analysis of future dry-wet conditions in NWC. An overview of the datasets, approaches, and interdependence among different components of the methodology is provided in the flow diagram (Figure 2).
3.1 ESI
 ()
() denotes the i-th ratio of AET to PET. AET(i) is the i-th AET value. PET(i) is the i-th PET value, calculated according to the method described in Section 3.3.
 ()
() represents the i-th ESI,
  represents the mean value of
  ,
,  represents the standard deviation of
  , N is the length of the evapotranspiration series.
 ()
()3.2 PET model
PET and AET are the necessary parameters for ESI calculations. AET data in future periods are usually obtained directly from CMIP datasets, while PET needs to be simulated based on temperature, radiation, wind speed, and other basic meteorological data. However, the actual generalized optimal PET model does not exist for future PET predictions; similarly, the actual generalized optimal PET parameter does not exist for future wet and dry predictions. Therefore, two comprehensive PET models with reliable physical mechanisms and four simplified PET models (including three empirical temperature models and one machine learning model) with high input data accuracy were used for the prediction. Specifically, the two comprehensive models chosen for this study are Penman-Monteith model and PM[CO2] model (Penman, 1948; Yang et al., 2019), the three empirical temperature models are Hargreaves-Samani model, Romanenko model, and Makkink model (Hargreaves & Samani, 1985; Makkink, 1957; Seiller & Anctil, 2016), and the machine learning model is Random Forest model (M. Wu et al., 2020).
3.3 Analysis of uncertainty sources
3.3.1 AHC
AHC method was used to comprehensively classify the set of ESI spatio-temporal variation prediction results, highlighting the homogeneity within clusters and the differences between clusters. AHC is a well-established clustering method that is suitable for multifactor classification and can be used to classify a wide range of characteristics in a comprehensive manner. The clustering process is as follows, first, each sample in the set is formed into its own class; then the two classes with the smallest squared differences are combined, and then all the classes are combined step by step. In this study, the Euclidean distances between samples were calculated separately at each grid point, rather than calculating based on the spatial average values, so that the results within each cluster were highly similar in terms of magnitude and spatial distribution.
3.3.2 Three-factor analysis of variance
 ()
()4 RESULTS
4.1 Projected changes of AET and PET under future climate scenarios
AET and PET are the key factors affecting the regional dry-wet conditions, and uncertainties in AET and PET will propagate into dry-wet predictions, so this paper first analyzed the variation and uncertainties of AET and PET. The change rates of AET and PET in NWC in the mid-future (2041–2070) and far-future (2071–2100) relative to the historical period were shown in Tables 2 and 3.
| SSP | ACCESS-ESM-1-5 | EC-Earth3 | GFDL-ESM4 | MIROC6 | MRI-ESM2-0 | NorESM2-MM | ||||||
|---|---|---|---|---|---|---|---|---|---|---|---|---|
| Mid-future | Far-future | Mid-future | Far-future | Mid-future | Far-future | Mid-future | Far-future | Mid-future | Far-future | Mid-future | Far-future | |
| SSP1-2.6 | 10.27 | 10.86 | 16.13 | 17.11 | 10.34 | 10.70 | 13.39 | 14.56 | 17.62 | 16.15 | 16.05 | 13.84 |
| SSP2-4.5 | 12.66 | 13.23 | 15.58 | 19.87 | 12.86 | 17.45 | 9.46 | 15.03 | 10.36 | 17.03 | 17.09 | 20.18 |
| SSP5-8.5 | 12.16 | 21.33 | 19.29 | 29.53 | 11.34 | 20.37 | 15.18 | 22.97 | 15.46 | 21.76 | 20.87 | 24.15 |
- Abbreviations: AET, actual evapotranspiration; NWC, Northwest China.
| SSP | PETM | ACCESS-ESM-1-5 | EC-Earth3 | GFDL-ESM4 | MIROC6 | MRI-ESM2-0 | NorESM2-MM | ||||||
|---|---|---|---|---|---|---|---|---|---|---|---|---|---|
| Mid-future | Far-future | Mid-future | Far-future | Mid-future | Far-future | Mid-future | Far-future | Mid-future | Far-future | Mid-future | Far-future | ||
| SSP1-2.6 | PM[CO2] | 5.18 | 5.59 | 4.78 | 5.87 | 4.98 | 5.56 | 4.96 | 5.37 | 6.34 | 6.15 | 3.63 | 4.41 |
| Penman-Monteith | 6.38 | 6.64 | 5.93 | 6.90 | 6.19 | 6.64 | 6.14 | 6.42 | 7.52 | 7.23 | 4.85 | 5.49 | |
| Random Forest | 9.61 | 9.56 | 8.17 | 8.13 | 7.39 | 7.42 | 8.49 | 8.52 | 8.46 | 7.99 | 7.85 | 7.86 | |
| Hargreaves-Samani | 7.43 | 7.49 | 5.02 | 5.01 | 4.33 | 4.42 | 5.25 | 5.29 | 5.59 | 4.98 | 5.23 | 5.18 | |
| Makkink | 8.93 | 9.10 | 4.75 | 5.38 | 5.07 | 5.17 | 6.01 | 6.66 | 6.52 | 6.45 | 5.00 | 5.65 | |
| Romanenko | 7.32 | 7.36 | 4.82 | 4.85 | 4.18 | 4.38 | 4.85 | 4.91 | 5.32 | 4.79 | 5.08 | 5.04 | |
| SSP2-4.5 | PM[CO2] | 6.92 | 8.92 | 3.32 | 7.10 | 3.55 | 6.98 | 5.29 | 6.36 | 5.99 | 7.22 | 5.99 | 7.58 |
| Penman-Monteith | 8.71 | 11.33 | 5.16 | 9.54 | 5.45 | 9.51 | 7.13 | 8.91 | 7.80 | 9.74 | 7.80 | 10.08 | |
| Random Forest | 11.16 | 13.81 | 9.51 | 13.01 | 8.33 | 11.33 | 9.97 | 11.90 | 9.97 | 11.79 | 10.29 | 12.52 | |
| Hargreaves-Samani | 8.36 | 10.80 | 5.71 | 8.84 | 4.52 | 7.34 | 6.09 | 7.17 | 6.71 | 7.67 | 7.02 | 8.74 | |
| Makkink | 8.41 | 11.30 | 2.75 | 5.83 | 4.08 | 7.72 | 5.36 | 6.83 | 5.79 | 7.39 | 5.77 | 7.52 | |
| Romanenko | 8.20 | 10.71 | 5.36 | 8.61 | 4.33 | 7.26 | 5.73 | 6.73 | 6.41 | 7.39 | 6.91 | 8.70 | |
| SSP5-8.5 | PM[CO2] | 7.79 | 11.49 | 5.45 | 11.69 | 4.51 | 8.35 | 5.58 | 8.23 | 7.42 | 9.87 | 7.40 | 11.07 |
| Penman-Monteith | 10.56 | 17.13 | 8.19 | 17.05 | 7.43 | 14.39 | 8.44 | 14.12 | 10.21 | 15.74 | 10.18 | 16.74 | |
| Random Forest | 13.44 | 19.75 | 12.89 | 20.01 | 11.12 | 17.05 | 11.95 | 18.20 | 12.37 | 17.62 | 12.64 | 18.98 | |
| Hargreaves-Samani | 10.31 | 16.10 | 8.86 | 15.61 | 7.04 | 12.18 | 7.23 | 12.53 | 8.81 | 13.32 | 9.24 | 15.23 | |
| Makkink | 9.81 | 14.93 | 4.12 | 10.63 | 5.18 | 10.51 | 6.03 | 9.56 | 7.20 | 10.55 | 7.17 | 11.75 | |
| Romanenko | 10.18 | 16.24 | 8.55 | 15.51 | 6.92 | 12.26 | 6.83 | 12.36 | 8.59 | 13.19 | 9.17 | 15.59 | |
- Abbreviations: NWC, Northwest China; PETM; potential evapotranspiration model; SSP, Shared Socioeconomic Pathway.
Overall, pronounced increases were observed in AET and PET, but the change rate of AET was higher than that of PET. Specifically, the regional average AET growth rate under SSP1-2.6 is 10.27%–17.62% in 2041–2070 s and 10.70%–17.11% in 2071–2100 s, indicating that surface evapotranspiration is expected to increase faster in mid-future and remains stable in far-future under this scenario. Increasing trends of AET under SSP2-4.5 and SSP5-8.5 are relatively similar, with continued growth over time. The change of AET under SSP5-8.5 scenario is the highest, with increases of 20.37%–29.53% in the far-future. As shown in Table 3, the PET growth rate is lowest in the SSP1-2.6 scenario, medium in the SSP2-4.5 scenario and highest in the SSP5-8.5 scenario. In terms of the differences in predictions between PETMs, due to PM[CO2] model considered the effect of increasing atmospheric CO2 concentration on stomatal conductance, PET growth rate based on PM[CO2] is the lowest, which would be under 12% in the far-future. The change of PET based on Random Forest model is the highest, accounting for 17.05%–20.01% in the far-future (under SSP5-8.5 scenario). The uncertainty of GCMs also has an impact on the projections of AET and PET, such as under the SSP1-2.6 scenario in which positive climate policies slow down global warming, some GCMs projecting a slower growth of evapotranspiration in far-future relative to the mid-future, while MRI-ESM2-0 project a retreat in evapotranspiration in the far-future.
4.2 Projected changes of dry-wet conditions under future climate scenarios
Figure 3 reflects the uncertainty in the projections of dry-wet evolution caused by SSP, GCM, and PETM. On the whole, if the 108 ∆ESI projections are given the same weight, the regional mean values of ∆ESI in mid-future and far-future are 0.41 and 0.52, respectively, indicating that the drought situation would ease across most of NWC.
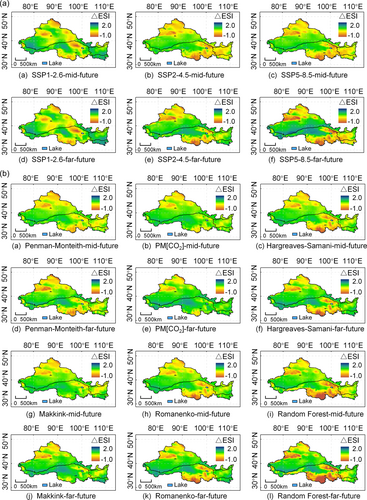
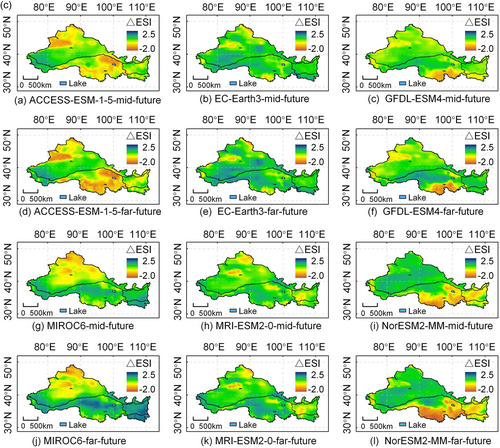
The predicted results under each scenario were different in terms of spatial distribution and magnitude (Figure 3a). Specifically, under the SSP1-2.6 scenario, the regional mean values of ∆ESI in the mid- and far-future would be 0.53 and 0.52, respectively, which shows that the ESI in this scenario grows faster in mid-future and remains stable in far-future. High-value area of ∆ESI under SSP1-2.6 is distributed in the southwestern part of the Northwest desert area, including the Qaidam Basin, the Loess Plateau, and the Qinling- Bashan Mountains; the low-value area is concentrated in the Qilian Mountains. Under the SSP5-8.5 scenario, ∆ESI in the two future periods would reach 0.36 and 0.52, respectively. The predicted spatial distribution under the SSP5-8.5 is similar to that under the SSP2-4.5 scenario, but the spatial heterogeneity would be more obvious under the SSP5-8.5 scenario. The ∆ESI in the southern Tianshan Mountains would be as low as −1.0, while that in the Kunlun Mountains would be up to 1.6.
Figure 3b shows the change in ESI predicted by the six different PET methods used in this study. The ΔESI predictions based on the combination models (Penman-Monteith and PM[CO2]) are somewhat similar in spatial distribution, with the southern Tianshan Mountains as the centre of low values. However, the ∆ESI based on the PM[CO2] would be higher due to the lower ∆PET based on PM[CO2], with changes of 0.54 and 0.69 in the mid- and far-future, respectively, while the ESI changes modelled by the Penman-Monteith would be lower, with changes of 0.41 and 0.46 in the two future periods, respectively. The predictions based on Hargreaves-Samani and Romanenko are consistent. Spatially, the low-value centres of the predictions based on the above two PETMs distributed along the Tanggula Mountains and the Zhaqu River valley, and the high-value centres are both located along the Kunlun Mountains—Qaidam Basin. The regional average ∆ESI based on the Random Forest model in the further two periods would be 0.14 and 0.22, respectively. Spatially, the high and low centres of ∆ESIRF are generally consistent with the results of other PETMs, but the long-term ∆ESI in the Zhaqu River valley would be as low as −0.9, due to the higher PET growth rate predicted by Random Forest model.
As can be seen in Figure 3c, there are considerable differences between the predictions based on different GCMs. The lowest ∆ESI is predicted by ACCESS-ESM1-5, with regional mean values of 0.08 and 0.04 in mid- and far-future, respectively. Specifically, the high-value centres would be located in the southwestern Tarim Basin and the southern part of the Kunlun Mountains, while the low centres would mainly be located in the southern Tianshan Mountains and the southeastern part of the Kunlun-Qinghai area. The ∆ESI predicted by EC-Earth3 is highest, which would reach 0.85 in far-future. The high-value centres would mainly be located in the southern part of the Northwestern desert and in the Turpan Basin. The spatial distribution of the predictions based on GFDL-ESM4 and NorESM2-MM is relatively similar, both predictions show that the southeastern part of the Kunlun-Qinghai region would be the low-value centre. The spatial distribution of the predicted results based on MIROC6 is characterized as higher on the south side and lower on the north side. The spatial differentiation of the prediction results based on MRI-ESM2-0 would be lower, with the low value areas located in the middle of the Kunlun-Qinghai area and the high-value areas relatively dispersed.
4.3 Analysis of uncertainty sources
The clustering analysis was performed on 108 sets of ∆ESI projections for the mid-future, and the results were presented in a circular tree diagram (Figure 4a). Predictions with similar spatial distribution and magnitudes of change are grouped into one cluster. The factor which dominated in the clustering process is the relatively important source of the total uncertainty. To further quantify the relative contribution of each major uncertainty source and their interactions to the total uncertainty in the projections (Figure 4b), a three-factor ANOVA was employed to the ensemble containing all three sources of uncertainty.
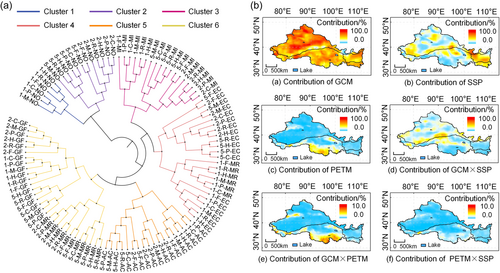
In the mid-future, six members (∆ESI predictions) depending on NorESM2-MM forcing (under SSP1-2.6) gathered into one cluster. Cluster 2 is dominated by NorESM2-MM, which included 12 results based on this GCM under SSP2-4.5 and SSP5-8.5 scenarios. Cluster 3 is composed of 18 members driving by MIROC6, the cluster is divided into two subclusters, one of which consisted of predictions under the SSP1-2.6 scenario and the other under the SSP2-4.5 and SSP5-8.5 scenarios. Cluster 4 consists of predictions based on EC-EARTH3 and MRI-ESM2-0, which included 24 members. The cluster is divided into two subclusters, one of which is the prediction results of the EC-EARTH3 under SSP2-4.5 and SSP5-8.5, and the other subcluster is dominated by SSP1-2.6, including the predictions based on EC-EARTH3 and MRI-ESM2-0. Cluster 5 is composed of 18 members driving by ACCESS-ESM-1-5, the cluster is divided into two subclusters, one of which is predictions under the SSP1-2.6 scenario and the other under the SSP2-4.5 and SSP5-8.5 scenarios. Cluster 6 consists of two subclusters, one of which is derived from GFDL-ESM4 forcing, and another is derived from MRI-ESM2-0 (under SSP2-4.5 and SSP5-8.5).
As shown in Figure 4b, the relative importance of each uncertainty source in the midterm future is ranked as GCM, SSP, PETM, the interaction of GCM and SSP, the interaction of GCM and PETM, the interaction of PETM and SSP, with contributions of 53.85%, 21.68%, 8.15%, 14.54%, 0.95%, and 0.55%, respectively. In terms of the spatial distribution of the three main sources of uncertainty, the high-value areas of GCM uncertainty contribution in the mid-future are mainly located in the north and central Northwest Desert Area, the northern part of Shaanxi Province and the central part of Kunlun-Qinghai Area, while the low-value areas are located in the southern part of the Northwest Desert Area and Qinling-Bashan Mountains. The high-value areas of SSP uncertainty's contribution in the mid-future are scattered in the Tengri Desert, Qilian Mountains, Loess Plateau, and the southwestern part of Northwest Desert, and the contribution of SSP uncertainty would reach 55% in the Tengri Desert. The high-value areas of the contribution of PETM uncertainty are mainly located in the southern Tianshan Mountains, Qilian Mountains, and Tanggula-Zhaqu River valley area. As for the minor uncertainty sources (interactions between major sources), GCM-SSP interaction would be more influential in the Kumutag Desert-Qaidam Basin; GCM-PETM interaction would have a larger contribution in the Southern Tianshan Mountains, the southern part of the Qaidam Basin and the southern part of the Kunlun-Qinghai area; and the PETM-SSP interaction would be slight (Figure 5).
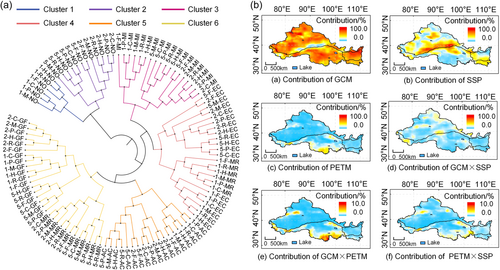
For the far-future, the projections derived from NorESM2-MM forcing (under SSP2-4.5 and SSP5-8.5) remain divide into one cluster (Cluster 1). Cluster 2 is dominated by ACCESS-ESM-1-5, which includes 12 results based on this GCM under SSP2-4.5 and SSP5-8.5 scenarios. Cluster 3 is dominated by SSP1-2.6, which includes 12 results depending on ACCESS-ESM-1-5 and NorESM2-MM. Cluster 4 includes 18 members based on the MIROC6. Cluster 5 is composed of 24 members, and is divided into two subclusters, one of which consists of predictions driving by EC-EARTH3 (under SSP2-4.5 and SSP5-8.5), and the other is dominated by SSP1-2.6 (depending on EC-EARTH3 and MRI-ESM2-0). Cluster 6 is composed of 30 members driving by GFDL-ESM4 and MRI-ESM2-0. It can be seen that most of the clusters are dominated by the GCM in the medium and long-term cluster analysis. The results also show that the prediction results under SSP1-2.6 scenario show very different features, so that SSP1-2.6 dominates a separate cluster in the far-future. The relative importance of each uncertainty source is in the order of GCM, SSP, PETM, GCM-SSP interaction, GCM-PETM interaction, PETM-SSP interaction, with contributions of 49.98%, 28.43%, 7.40%, 12.08%, 0.96%, and 0.93%, respectively. Compared to the mid-future, the contribution rate of SSP uncertainty in far-future has increased by 6.75%, GCM uncertainty has decreased by 3.87%, and PETM uncertainty has decreased by 0.75%. The spatial variation in the contribution of each source of uncertainty as the future projection time lengthens is as follows: the high-value area of SSP contribution expands to a wider area in far-future, with a higher contribution in the southeastern Tarim Basin-Kumutag Desert area and the Turpan Basin. Compared to the mid-future, the high-value area of PETM contribution shrinks to the Zhaqu River valley and the eastern part of Qilian Mountains. The high value area of GCM contribution in the long-term future shifts to the northern Northwest desert area, the southern Kunlun-Qinghai area, and the northern part of Loess Plateau. The contribution rate of PETM-SSP interaction increases and was more influential in the Tianshan Mountains and Qilian Mountains. Compared to the midterm, the spatial distribution of the GCM-PETM interaction does not change significantly, and the range of high-value areas of the GCM-SSP interaction decreases.
5 DISCUSSION
Under the three future climate scenarios considered, there is an increasing trend in future temperature and precipitation in NWC. The multi-GCM ensemble average results show that the warming degree and precipitation increase degree are the smallest under the SSP1-2.6 scenario, and the largest under the SSP5-8.5 scenario (Qin et al., 2021). Our results indicate that PET and AET show increasing trends under the three future scenarios, consistent with the trends in temperature and precipitation. On a global scale, Pan et al. (2015) used the Dynamic Land Ecosystem Model to project future evapotranspiration under the A2 and B1 emission scenarios. They found that global AET would increase by 30.7 mm/yr (5.6%) and 13.2 mm/yr (2.4%) in the 2090s relative to the 2000s under A2 and B1 scenarios. Berg and Sheffield (2018) predicted precipitation and AET under the RCP8.5 scenario based on CMIP5 models, and they found that at mid-high latitudes (including NWC), annual mean precipitation and AET increased in 2071-2100 compared to 1950-2005. D. Ma et al. (2019) predicted the changes of China's PET relative to the baseline period in 2040–2069 and 2070–2099 under the RCP 8.5 scenario, and the results from the multimodel average show that PET increases continuously in the whole country. Su et al. (2021) obtained multiple PET prediction results under seven future climate scenarios based on four GCMs, pointed out multiple possibilities of future PET changes, and found that the estimated PET under SSP5-8.5 scenario was higher than that under SSP1-2.6 and SSP2-4.5 scenarios. It was predicted that the average PET in China would reach 1200 mm in 2081–2100 under the SSP5-8.5 scenario. For the whole northern China, Lu et al. (2021) predicted the change of PET based on the Penman-Monteith model, and the results showed that relative to the reference period (1986–2005), by the middle of the 21st century, the mean PET increases about 8.7% and 11.0% form 20 CMIP5 multi-model ensemble under RCP4.5 and RCP8.5, respectively. Our projected results demonstrate a consistent PET variation trend with the aforementioned study.
Research has indicated that influencing factors of AET include solar radiation, precipitation, wind speed, temperature, vegetation, and so on (Yang et al., 2022). In areas where precipitation is the main source of water resources, AET is dominated by precipitation. Atmospheric CO2 concentration can also cause changes in AET, and the increase of the concentration promote plant growth and thus increase AET. On the other hand, the increase in CO2 concentration cause plants to partially close their stomata, weakening the transpiration. Pan et al. (2015) conducted a future AET evolution attribution study on a global scale, which showed that temperature rise and precipitation increase will lead to a significant increase in AET by the end of the 21st century. In addition, as the forest area will pronounced increase under the SSP1-2.6 scenario (Zhang et al., 2019), the increment of AET under this scenario will be greater.
Factors affecting PET include maximum temperature, minimum temperature, wind speed, solar radiation, and relative humidity. It has been shown that PET is most sensitive to perturbations in temperature (Liu et al., 2020). Zheng et al. (2022) projected the spatial and temporal trends of PET in China for 2030–2060 using the Peman-Monteith equation, and quantified the contribution of each element driving PET using partial differential methods, and the results indicated that maximum temperature is the dominant meteorological element for future PET changes. Before the 1990s, the effect of decreasing wind speed outweighs the effect of increasing temperature in NWC, resulting in a decrease in PET; and in the future period, although the sensitivity of PET to wind speed remains high, the warming magnitude is larger and the decrease in wind speed is relatively small, so the positive contribution of increasing temperature to PET will offset the negative contribution of the decreased wind speed, thereby increasing PET.
Based on the predictions of AET and PET, this paper obtained a predicted data set of future ESI, and assessed the dry-wet evolution in NWC based on ∆ESI. Many studies have shown that NWC is becoming warmer and wetter (H. Wang et al., 2022), and the conclusion that future drought conditions in NWC will ease is supported by a number of studies (Wang & Zhai, 2022). Lu et al. (2021) indicated that the contribution of precipitation was greater than that of PET, resulting in a wetting trend in the NWC. The drought area and severity predicted by Zhang et al. (2021) under the SSP scenario based on scPDSI and SSIS in NWC showed a clear trend of reduction in drought conditions. In addition, IPCC Sixth Assessment Report indicated that soil moisture content is decreasing and trending towards aridity in Mediterranean and southern Africa; however, the future shallow soil moisture content and deep soil moisture content are both increasing in NWC (IPCC, 2021). Soil moisture is often used to measure the degree of agricultural drought, which also validates that the ESI can effectively reflect future agricultural drought characteristics. The warming and wetting of the Northwest will cause changes to the climate and ecosystems, which will have significant impacts on agricultural production, peoples' lives, and the ecological environment. However, NWC is located in the hinterland of the Asian continent, far from ocean moisture; and extreme arid substrates (deserts and Gobi) are widely distributed, all of these circumstances increase the difficulty of climate transition, so the warming and wetting in NWC is limited and the influence should not be overstated.
Our results also indicated that although the regional mean ∆ESI is positive (indicating drought mitigation) in NWC under both the Sustainable Development Pathway (SSP1-2.6) and the Conventional Development Pathway (SSP5-8.5), the ∆ESI under the SSP5-8.5 scenario is more spatially heterogeneous, with the ∆ESI below −1.0 in some areas (e.g., southern Tianshan Mountains), which would cause greater drought risk. Therefore, we recommend that water resource managers in NWC continue to increase the reduction in carbon intensity, promote a comprehensive green transformation of economic and social development, and promote harmonious coexistence between humans and nature. In addition, an awareness of multihazard prevention should be developed, and in response to the increasing trend of climate extremes, the building of comprehensive disaster mitigation and prevention capacity should be stepped up, with emphasis on both drought and flood control.
This study found that differences in GCMs contributed the most to the uncertainty in the process of drought projection. Lu et al. (2019) found that differences in GCMs could account for more than 80% of the uncertainty in drought projection based on soil moisture anomalies. L. Shi et al. (2020) found that differences in GCMs and their interaction with RCPs contributed the most to the uncertainty in the process of drought projection (19.2%–53% and 17.2%–44.3%, respectively). Most of the existing studies only take one or two uncertainties into account, but the predictions provided in this paper, taking the uncertainties of SSP, GCM, and PETM into account, can provide a more scientific and comprehensive theoretical basis for predicting future wet and dry conditions. Uncertainty of the GCM downscaling method may also have some influence on the prediction results (Song et al., 2020). Therefore, the uncertainty of downscaling methods could be taken into account in further dry-wet prediction research, and extending the three-dimensional dry-wet prediction framework to higher dimensions.
6 CONCLUSION
- (1)
The change rates of AET and PET in NWC in the mid-future (2041–2070) and far-future (2071–2100) relative to the historical period show an increasing trend for both AET and PET in future periods, but the change rate of AET is higher than that of PET.
- (2)
The ensemble average values of the annual ∆ESI are 0.41 and 0.52 in the mid-and far-future, respectively, indicating that drought conditions in NWC will continue to ease in the future. In the ensemble projection, ∆ESI based on the random forest model and the EC-Earth3 climate model is higher, and the ∆ESI based on the PM[CO2] model and ACCESS-ESM1-5 is lower.
- (3)
The hierarchical clustering analysis of 108 sets of prediction results show that most of the prediction results are clustered dominated by GCMs, with one cluster dominated by the SSP1-2.6 scenario. Quantification results of the ANOVA indicated that the contribution rate of GCM uncertainty to the total uncertainty is the highest, with an average value of 53.85% and 49.98% in the mid-and far-future, respectively. In addition, the contribution rate of SSP uncertainty would be 21.68% and 28.43% in the future two periods. Research to further reduce the uncertainty in dry-wet projections may need to focus on improving the certainty of Global Climate Models by improving the understanding and computational ability of the geophysical system.
ACKNOWLEDGMENTS
The study was supported by the National Natural Science Foundation in China (Grants 52079111 and 51879222) and the Natural Science Foundation of Jiangsu Province (Grants no. BK20220590).
ETHICS STATEMENT
The authors confirm that this article does not contain any studies with animal or human subjects.
Open Research
DATA AVAILABILITY STATEMENT
The data that support the findings of this study are openly available in CMIP6 at https://esgf-node.llnl.gov/search/cmip6/.


