Vulnerability assessment of urban drainage network using relevance-based centrality metrics
Abstract
The analysis of urban drainage networks (UDNs) is one of the most important topics in the study of water systems. The interest in strategies aimed at analyzing the impacts of sewer pipes failure on the urban drainage system operation is growing, and the need of developing methodologies aimed at vulnerability assessment and system management is increasingly important. To this purpose, the present work shows and discusses the use of complex network theory. In particular, the recently developed relevance-based centrality metrics have been used to classify UDNs and to identify the most critical pipes. First, the relevance-based degree is applied to the direct graph of the drainage network to classify the systems. Afterward, the relevance-based edge betweenness is used for ranking the importance, that is, the criticality with respect to fluxes, for the pipes. The relevance-based metrics assign importance to the network elements (pipes and nodes), considering both the intrinsic relevance of nodes and the network connectivity structure. Results provide useful information to support pipe maintenance programs to be prepared for malfunctioning events by means of a criticality analysis in advance.The relevance-based metrics are presented by using the direct graph of a simple example network, and they are then applied both to a benchmark and a real urban drainage system to show the effectiveness even for real systems.
1 INTRODUCTION
The vulnerability assessment of urban drainage networks (UDNs) is a relevant topic in urban water systems management that generally informs on the behavior of the systems when one or more failures occur (Zhang et al., 2017). UDNs represent tree systems that, compared to meshed hydraulic systems, such as water distribution networks (WDNs), present a greater criticality. This condition is due to the limiting alternative paths between nodes, which make it impossible to reach specific nodes when one or more pipes fail. In fact, being the system generally branched, the failure event involves the unintended isolation of entire portions of the network located upstream of the failed element. In this perspective, the identification of the most critical elements for UDNs assumes crucial importance and can support specific and primary maintenance programs, for example, doubling of sewer pipes as temporary bypasses for supporting the system operation when repairing the broken element, planning emergency storage tanks, and so forth.
Although the vulnerability assessment of UDNs represents a very relevant issue, it has been investigated only recently. Chughtai and Zayed (2008) proposed a method based on historical data relating to physical, environmental, and operational factors of UDNs to identify the most critical elements of the system, also indicating appropriate inspections and rehabilitation interventions. Möderl et al. (2009) developed the VulNetUD method, capable of identifying the most vulnerable elements in UDNs based on simulations performed with United States Environmental Protection Agency Storm Water Management Model (SWMM). Vulnerability maps generated by VulNetUD, also viewable in the Geographic Information System interface, support risk management with planning or rehabilitation strategies. Mugume et al. (2015) proposed a new analytical approach based on global resilience analysis to evaluate the performance of UDNs when subjected to a wide range of structural failure scenarios resulting from random cumulative link failure. A new resilience index, that combines the failure magnitude and duration of the event, is utilized to quantify system residual functionality at each considered link failure level. Zhang et al. (2017) proposed an insight into the differences in the vulnerability of tree and loop systems, providing guidelines for developing measures aimed at reducing urban flooding. Yazdi (2018) proposed a resilience-based optimization model for the UDN rehabilitation and improvement of system performance under unexpected failure. The method suggests the optimal set of actions for flood mitigation under a significant number of failure scenarios, such as adding parallel conduits, particularly in critical points.
The vulnerability assessment of UDNs is increasingly analyzed also in relation to climate change taking place in recent years. These extreme events have not been considered during the planning phase of UDNs, and today, as a result, the increase in rainfall intensity leads to a further impact on drainage systems, which are unable to collect the flow volume. Flooding events are increasingly frequent, and the systems responsible for their disposal appear more and more vulnerable. Kleidorfer et al. (2009) proposed a Monte Carlo simulation to compare the behavior of different performance indicators of combined sewer systems considering environmental change effects. Neumann et al. (2015) proposed four different models to analyze the vulnerability, impacts and adaptation of various urban infrastructures, including UDNs, under different climate change scenarios. The results of their study indicate that the impacts of climate change will increasingly influence the behavior of such infrastructures. Xu et al. (2020) proposed a step-by-step optimization model (SOCU) for the design of UDNs that considers climate change-related uncertainty. The application of this model to a real network shows greater reliability than traditional models, due to the possibility of coupling both the imminent climate changes and the uncertainty of the hydrological model. Kourtis and Tsihrintzis (2021) proposed a review work on the main challenges that UDNs are facing in recent years due to climate change by analyzing and comparing 32 different drainage systems. Their goal was to identify and evaluate the approaches proposed so far to deal with this problem and to define a new approach for adapting UDNs to climate change.
In recent years the topic has also been addressed in a topological key, with tools proposed by the Complex Network Theory (CNT). CNT allows to analyze and classify real complex systems based on their connectivity structure,that is, on their topology. Several network models (Barabási & Albert, 1999; Erdos and Rényi, 1984; Watts & Strogatz, 1998) and metrics (Newman, 2010) have been introduced to associate real systems with predefined patterns and to facilitate their analysis and management. At the same time, the use of centrality metrics (Freeman, 1977; Giustolisi et al., 2017; Newman, 2010) supports the identification of the most important elements, corresponding with the most critical ones, with respect to different phenomena. Most of the studies conducted to date using CNT tools focus on immaterial networks, such as neurons for brain networks (Zhou, 2004), air routes for air transport networks (Van den Heuvel & Sporns, 2011), and so forth, for which, CNT metrics and models shown to be very useful and of immediate application. Furthermore, thanks to the increasing availability of data and increasingly advanced hydraulic modeling, the use of CNT tools for analysis and vulnerability assessment of UDNs is increasingly gaining interest. Zischg et al. (2017) investigated the historical data set of water distribution and UDNs of Innsbruck using a dual mapping approach (Hierarchical Intersection Continuity Negotiation method) and metrics of complex network analysis and stated that both systems evolve to exhibit scale-free properties. Krueger et al. (2017) analyzed the structure and the spatial and temporal evolution of urban infrastructure systems using a dual-mapping technique (Hierarchical Intersection Continuity Negotiation). They evaluated several network topological metrics and obtained that the power-low model approximates the node-degree distributions of both water infrastructure networks. Yang et al. (2017) investigated the scaling and topology of engineered UDNs in two cities, and further examined UDN evolution over decades. In general, the results demonstrated that the distribution of such systems evolves in time to resemble those of river networks. Meijer et al. (2018) used the graph theory and focused on the network connectivity structure to identify the most critical elements in UDNs with respect to the malfunctioning of the system. Hajiamoosha and Urich (2020) compared two different representations of UDNs and evaluated the UDN vulnerability using a range of topological metrics. Ganesan et al. (2020) proposed a vulnerability analysis of UDNs using the CNT centrality metrics. They identified the most important nodes with respect to more applications in the field of system monitoring. Zuluaga et al. (2020) proposed the use of CNT and differential equations to evaluate the contaminant spread in UDNs, particularly to model and simulate water quality parameters in a hydrological basin.
The usefulness of CNT tools is recognized as well as the limits they present in the analysis of infrastructural systems. The topological analysis provides results solely influenced by the connectivity structure, leaving out the hydraulic component. Various attempts have been made to assign specific features to the connectivity structures to make much more reliable this analysis for infrastructure systems, for example, by introducing weights and assigning a direction to the pipes, as suggested by Yazdani and Jeffrey (2012) for WDNs, or also using the primal and dual graph, as suggested by Sitzenfrei et al. (2022).
A tailoring process aimed at correctly performing a technical transfer of the CNT tools to the infrastructure network, began in 2019 with (Giustolisi et al., 2019; 2020). In their works, authors concretized the need to adapt the CNT metrics for WDNs by presenting two tailoring strategies referring to the most suitable centrality metrics for the spatial network (betweenness, closeness, harmonic closeness, and degree). In Giustolisi et al. (2020), the authors proposed a tailoring process that embeds the information about the different role of nodes, as intrinsic relevance, into the analysis and demonstrated the validity of the paradigm both for social and water distribution networks. This paradigm has also been used by Simone et al. (2022), that evaluated the potentialities of CNT approaches for UDNs vulnerability assessment and monitoring system planning, with the aim of proposing an approach to analyze networks in a preliminary phase of the investigation, that is, when only the topological survey is available. To this purpose, they achieved the intrinsic relevance of nodes by Horton's hierarchy of the system (Horton, 1945).
Accordingly, the present paper proposes using two relevance-based centrality metrics (Giustolisi et al., 2020) for the UDNs classification and for the vulnerability assessment of sewer pipes. Embedding the different role of nodes in the analysis, the strategy reflects the high hydraulic heterogeneity of the components of the systems, increasing the importance of pipes/paths close to the hydraulic hub (e.g., outfall, strategic structures, etc.). The relevance-based degree and relevance-based edge betweenness centrality are applied to the direct graph of UDNs. The intrinsic relevance is assumed to equal to the risk of disconnection for each node, calculated as the product of the length and flow of all the sewer pipes that converge in a node.
The results of the analyses provide useful information on the system vulnerability and allow for identifying a ranking of importance for the pipes, useful to support all management actions and systems maintenance plans.
The present proposal does not replace the necessary hydraulic simulations but represents valid support in facing increasingly complex problems in UDNs, assisting, for example, the engineering judgment for analysis and management activities.
- 1.
The next section presents the UDNs from a topological point of view;
- 2.
The third section reports some key CNT concepts about network classification and vulnerability and introduces the classic version of the two centrality metrics here used;
- 3.
The fourth section highlights the need of using relevance-based centrality and describes the metrics here used;
- 4.
The fifth sections present the strategy applied to a benchmark and to a real UDN;
- 5.
Concluding remarks are drawn in the last section.
2 UDN CONNECTIVITY STRUCTURE
UDNs are artificial networks, designed according to specific criteria (demography, geology, budgets, etc.) to ensure urban drainage requirements and to protect the health and safety of the community. They include storm water, sanitary sewers, and combined sanitary storm water systems and are responsible for the collection and disposal of rainwater and waste water, to be conveyed to the waste water treatment plants. Such infrastructure systems must be reliable both in relation to random failures and intentional threats, in the identification of contaminants, as well as for purposes related to monitoring, calibration of hydraulic models and system control.
UDNs are defined by several features: (i) spatial constraints (e.g., Euclidean distance and slope) affect the structure of these networks; (ii) key elements of the structure, i.e., pipes, are material components characterized by asset features such as length, diameter, and hydraulic resistance; (iii) the system represents minimally connected graph with only one path between each pair of nodes; (iv) the system generally works by gravity so that the flow direction is uniquely imposed by the slope. Therefore, the analysis of this type of network requires the topological/connectivity structure information (stored in the adjacency matrix), the spatial information (coordinates of nodes) and the asset characteristics of pipes.
In the early twentieth century, the aim of the hydraulic analysis was system design and verification. Progressive and often inadequate urban development favored the growth of ever-complex and dated UDNs, which required increasingly greater management needs with respect to their first design. The urban development impacts, above all, the topology/structure of the system, which updates with respect to its previous configuration. In fact, the evolution of networks in space involves a variation in the length of the links, with many effects on the topological structure of the system. Studies about the structure and evolution of distribution/collection systems started with quantitative geographers in the 60−70 s that addressed the problem of the spatial peculiarities for distribution networks (Haggett & Chorley, 1969), also considering their temporal evolution (Kansky, 1963; Taaffe et al., 1963). These studies have known an ever-greater depth (Barthélemy, 2011), both with the advent of the first computers and an ever-increasing availability of data.
The growth of these systems is also affected by the temporal component, considering that they constantly change over time for multiple factors (e.g., human behavior, climatic conditions, political and social dispositions, etc.). An example of UDNs evolving in time is reported in Figure 1 (Yang et al., 2017). The network in 1970 only considers a part of the initial main level of collection of the city and presents a different scale of representation (low) with respect to those in 2015 (high), which reports the following levels of collections generated over time.
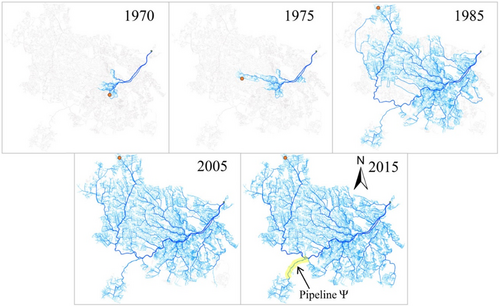
It is evident that the network for the various historical periods assumes different configurations, and the interventions planned for the system in a precise historical moment, may not be effective in the other periods. So, UDNs analyzed today do not necessarily work badly, they are simply designed for much lower loads. It follows that information on the system topology must be thoroughly validated before planning and preparing any management interventions. In this perspective, the temporal and spatial components, linked to the availability of data, become increasingly important in the analysis of infrastructural networks, for providing ever more reliable results and guiding technicians in the most appropriate management choices.
3 CLASSIFICATION AND VULNERABILITY ASSESSMENT OF COMPLEX REAL SYSTEMS
CNT tools model in an efficient way most part of real-world systems as networks, that is, a set of nodes connected by links, that indicate the interactions between them. Most of the studies based on the CNT tools concern the classification of complex systems to study their vulnerability when subject to random and intentional attacks, corresponding, generally, to the removal of one or more elements from the system. The concept of degree of connection here assumes great importance. The more a removed node is connected, the more its removal from the network affects the system behavior, particularly in terms of variation of the average paths between pairs of nodes in the system. It follows that the vulnerability assessment of the systems takes place by evaluating how a few important nodes (i.e., very connected nodes such as hubs) affect the functioning of the systems with respect to the less important ones.
Over time, the classification of real systems in terms of vulnerability allowed of defining four main models. Regular networks, composed of nodes with the same number of connections, are characterized by absolute homogeneity. Random networks (Erdos and Rényi, 1984), composed of nodes with a similar number of connections, are characterized by a high homogeneity. Between regular and random, small-world networks (Watts & Strogatz, 1998), based on the so-called small-world effect (Milgram, 1967). Scale-free networks (Barabási & Albert, 1999) composed of many nodes with few connections and few nodes with many connections (called hubs), are characterized by high heterogeneity.
In term of vulnerability, the high homogeneity of regular and random networks indicate that nodes have almost all the same importance and, therefore, the removal of a node does not greatly affect the reliability of the system, since, statistically speaking, the paths around that node change to efficiently reorganize the diffusion of information. This means that regular and random systems are not very vulnerable in the presence of failure events. In the same way, small-world networks are lowly vulnerable in the presence of failure events, although the presence of small hubs occasionally deviates the system from such behavior. Differently, the high heterogeneity of scale-free networks indicates that the operation of the system following failure events depends on the failed element. Removing a hub, i.e., a node with high connectivity, leads to an immediate decrease in the system's capacity to transfer information. Conversely, by removing a poorly connected node, the system capacity almost remains unchanged. This means that scale-free networks present low vulnerability when poorly connected nodes fail and high vulnerability when to fail is a hub.
 ()
()Preserving the importance of the nodal perspective proposed by the CNT, useful for classification purposes, it can happen that for specific systems, for example, physical infrastructure networks, the relevant components are the links (pipes). In these cases, nodes become components responsible to transfer the information among pipes, and links represent components influencing the emergent behavior of the system.
 ()
()4 ANALYSIS OF UDNS WITH RELEVANCE-BASED CENTRALITY METRICS
The graph of a UDNs is composed of links, representing the sewer pipes (np), and nodes (nn), representing inlet nodes, connection nodes, and collection nodes. Inlet nodes correspond to hydraulic inflows and can assume different importance depending on the property they serve (e.g., private properties, hospitals, schools, etc.). Connection nodes correspond to line manholes, that is, connections among pipes, for example, in crossroads. Collection nodes can represent outfall and storage, that is, special hubs collecting all the information of the system. CNT tools do not account for this different role of nodes in the analysis, but they only refer to the network connectivity structure, losing, in this way, a part of the hydraulic information. It is to say that a hade node has the same relevance as a manhole and an outfall.
In the specific case of UDNs, a strange situation also occurs. On the one hand, regardless of the number of nodes that characterize the system, UDNs have a high homogeneity dictated by the fact that the pipes are located parallel to the streets but buried, and their connections are influenced by the road intersections. This configuration suggests the association of UDNs to random networks, that is, systems low vulnerable to failure events. On the other hand, the typical tree-like structure precludes alternative paths between nodes when one element fails and would suggest high vulnerability for such systems. In this last case, the vulnerability level depends on the importance of the element removed. The failure of peripheral elements (few connections and high distance from the backbone of the system) limits the damage to a portion of the network, allowing the operation of the remaining part of the system. Conversely, the failure of elements on the backbone affects greater portions of the network, sometimes involving even additional unintended isolation areas. This is because the tree-like structure allows single paths between a couple of nodes, and the removal of a strategic node influences all paths belonging to that node. Obviously, the more the node is crossed in the paths between other nodes, the more its removal involves damage to the system.
These first observations show that the classification findings proposed by the classic CNT tools, based only on the topological features of the network, are not reliable for UDNs. To enhance the UDNs classification and vulnerability assessment using the CNT tools, the information about the intrinsic relevance of nodes, that is, the role that nodes assume in the network, needs to be embedded into CNT tools. This way, the hydraulic information is coupled with the topological one to make CNT tools useful for such complex infrastructure systems.
Consistently, the present work uses the relevance-based centrality metrics, which embed the hydraulic component of the system as intrinsic relevance of nodes (Giustolisi et al., 2020; Simone et al., 2022) Rn(n = 1, …, N). The intrinsic relevance Rn (n = 1, …, N) depends on the type of network and analysis to be performed. Several functions f(Rs, Rt) can be used (f(Rs, Rt) = Rs ∙ Rt; (ii) f(Rs, Rt) = (Rs + Rt)/2; (iii) f(Rs, Rt) = Rs and (iv) f(Rs, Rt) = max (Rs, Rt); (v) f(Rs, Rt) = ΣRpath and (vi) f(Rs, Rt) = ΠRpath that consider the intrinsic relevance of the ending nodes s and t of the generic link l. The values of the function f(Rs, Rt) are stored in a matrix having the same dimension of the adjacency matrix. Furthermore, f(Rs, Rt) depends on the specific characteristics of the problem to analyze. By increasing the knowledge of the network, the accuracy of the analysis increases because it is possible to identify the functions f(Rs, Rt) most suitable for the various physical systems.
4.1 Relevance-based degree for UDN classification
 ()
()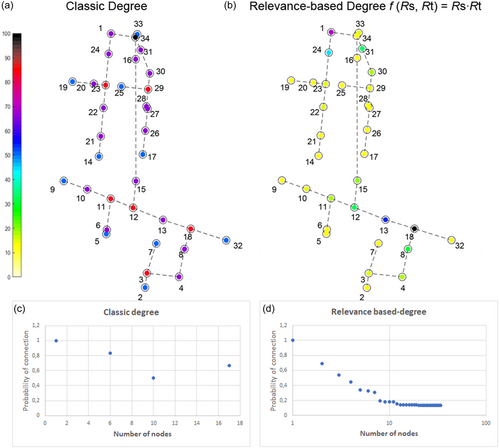
It is possible noting that the classic metric identifies only four values of degree (Figure 2c), corresponding to one (nodes in blue), two (nodes in purple), three (nodes in red), and four (nodes in black) degrees of connection. This solution, in addition to being characterized by a lack of data useful for identifying a curve representing the behavior of the system (only 4 values), identifies node 34 (degree equal to 4) as the most important and node 32 (the outfall with degree equal to 1) as the less important, being the analysis only based on the structural connectivity of the system without considering the hydraulics side. Conversely, the relevance-based metric allows going one step further in the classification of UDNs, identifying different values of the metric for each node, due to the presence of the relevance that characterizes each node in a different way. The most important node is n18, the one immediately upstream of the outfall. Overall, the results show that (i) the metric values reflect the high hydraulic heterogeneity, providing a range of values large enough to define a reliable classification curve (Figure 2d); (ii) increasing the intrinsic relevance of nodes in the analysis, the node close to the outfall becomes a hub, and the importance of the nodes close to it increases; (iii) embedding information on intrinsic relevance and connective structure generates hubs and leads to networks more and more scale-free. Finally, we can state that the degree distribution examines the general structure of the network as individuated by the relevance-degree centrality.
Figure 3 shows the same analyses performed with the other three different functions f(Rs, Rt). The difference lies in the extent of the deviation between the nodes with maximum values (hubs) and the remaining part of the nodes in the system. That is, the chosen function more clearly marks the gap between the hubs and the other nodes than the other functions, which in any case, provide coherent results.
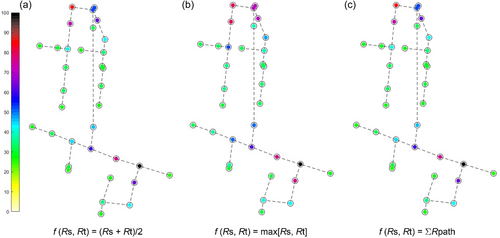
The present analysis highlighted that the classification of UDNs also integrates the information on the intrinsic relevance of the nodes, identifying such systems as vulnerable, characterized by few hubs and many low-important nodes.
4.2 Vulnerability assessment of sewer pipes
Although the nodal perspective is the basis for the classification of real systems, for UDNs, the relevant physical components are the sewer pipes. Therefore, the second objective of the present work is to provide a ranking of importance for these elements.
 ()
()Figure 4 reports the relevance-based edge betweenness centrality for SWMM_example 3 UDN. The table in the figure indicates only the sewer pipes with values of the metric in the range [10%−100%]. The sewer pipes with the highest metric values are those crossed more times by shorter paths between the most relevant nodes. A path of vulnerability is highlighted in the network, from node n34 to node n32, which represents the backbone of the system. The sewer pipe with the maximum value of the metric is p10, between nodes n12 and n13, whose failure is even more damaging than that of the sewer pipe p16, between nodes n18 and n32 (outfall) since it collects the greatest flow along the system to transfer towards the sewer pipe p16. The latter assumes, however, high criticality due both to the importance of the sewer pipes located upstream and to the portion of the network inserted into node n18.
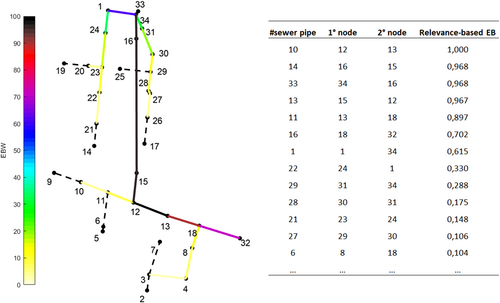
The present analysis highlights that the most vulnerable pipes are not necessarily connected to the outfalls, due to the network tree structure. This configuration, in fact, implies that the operation of the system is also compromised due to the failure of elements located further upstream into which all or most of the drainage system located upstream enters.
5 CASE STUDY
The relevance-based metrics are here applied to the direct graph of a benchmark UDN (Li & Matthew, 1990), composed of 77 nodes (manholes), 79 edges (sewer pipes), and 1 outfall. The comparison between the classic metric and the relevance-based ones is useful for understanding the effectiveness of the latter in identifying the emerging behavior of the system with respect to the vulnerability of its elements. Again, the classic degree (Figure 5a) identifies four values for the nodes of the system according to their degree of connection, from 1 to 4, not showing the heterogeneous behavior of UDNs.
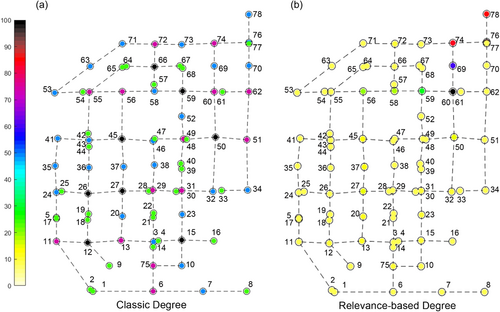
Moving on to the relevance-based metric (Figure 5b), on the other hand, the results obtained well identify the behavior of such systems, with few very important nodes (hubs) and many nodes with low importance. Obviously, the most important nodes have high intrinsic relevance in addition to being well connected to other nodes.
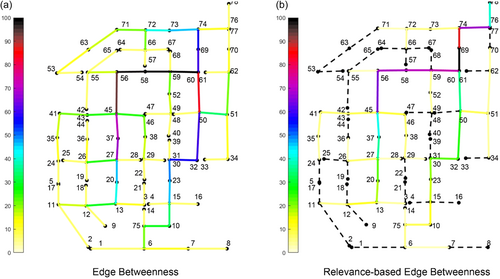
The vulnerability of the system is assessed for the single sewer pipes using the metric for the edges. Figure 6 reports the classic edge betweenness (a) and the relevance-based edge betweenness (b). The classic edge betweenness (Figure 6a) identifies the most important elements in the central part of the network, in correspondence with the pipes most crossed in the paths between a couple of nodes, assigning low importance to the sewer pipes close to the outfall (node78). Differently, computing the rank of importance of the pipes considering both the relevance of nodes and their topological position (Figure 6b), the importance of pipes close to the outfall increases. Particularly, the metric identifies a path of importance toward the outfall. The most important sewer pipe is identified as the one between nodes n60 and n69, which is the one that receives the most part of the flow, whose failure could be very damaging to the system. The sewer pipe directly connected to the outfall assumes an importance that arises from the combination of its high hydraulic relevance and its low topological relevance. The remaining part of the pipes are traversed by a smaller number of shortest paths and present a lower intrinsic relevance and, therefore, assume lower metric values. Overall, the results show that the intrinsic relevance of the nodes enriches the information of the metric, allowing the identification of the pipes that are important because located in the main topological paths and between nodes with a high risk of disconnection.
6 REAL UDN
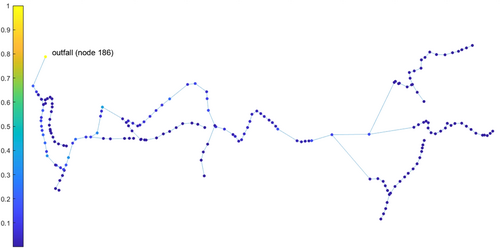
The strategy of the UDN vulnerability assessment is here applied to the direct graph of a portion of the Massa Lubrense network, a medium size real drainage network (Simone et al., 2022). The UDN model is composed of 185 pipes, 186 nodes, and 1 outfall, whose layout is reported in Figure 7. The colors of the nodes represent the intrinsic relevance, i.e., the risk assigned to each node in the network, normalized in the range [0–1].
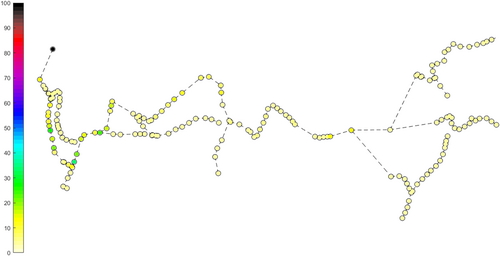
The intrinsic relevance of nodes is embedded in the UDNs analysis so that it concurs with the network connectivity structure to define the vulnerability of the system. The relevance-based degree centrality is then applied to the direct graph of the UDNs to rank the nodes according to both their relevance and topological position, and the results are shown in Figure 8. From a global point of view, the results of the analysis show that by increasing the importance of hydraulically relevant nodes, hydraulic hubs (e.g., outfall) are generated within the system, leading the networks towards an increasingly scale-free model.
To assess the vulnerability of the sewer pipes, the relevance-based edge betweenness is used (see Figure 9). The metric identifies the most critical sewer pipes as those traversed more times by the shortest paths between relevant nodes. This way, the metric enriches the information given by the network topology and allows the identification of the elements that are significant because located in the main paths and with a greater risk of disconnection. The typical tree-like structure of the system makes the metric identifies a path of importance toward the outfall. In fact, starting from the right side of the network, characterized by the presence of the head nodes, and moving towards the outfall, the values of the metric increase. It is possible noting that the values increase gradually, precisely because of the presence of serial nodes and pipes, which collect an ever-increasing flow rate, and to which correspond an ever-increasing value of the risk of disconnection. The greater values of the metric are associated with the sewer pipes that underlie most parts of the network, whose failure is very damaging for the operational purposes of the system, regardless of whether the pipes connected to the outfall are still functional or not. In fact, when the most important pipe fails, the link connected to the outfall is responsible only for the collection of the flow arriving from the two small portions of the network highlighted in green, which, however, presents a very low value of the metric.
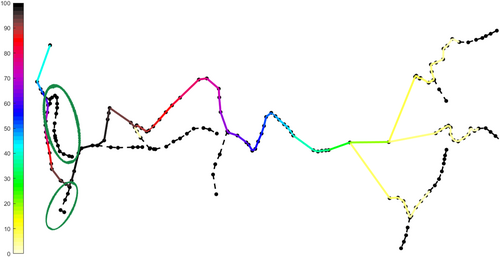
Overall, the results show that the intrinsic relevance of the nodes enriches the information of the metric with respect to the vulnerability of its elements.
7 CONCLUSIONS
The present paper proposes a novel paradigm to classify UDNs and assess the vulnerability of sewer pipes using the relevance-based CNT centrality metrics. The relevance-based metrics account for the peculiarities of UDNs embedding the information about the different role of the nodes in terms of intrinsic relevance, here assumed equal to the risk of disconnection. This way, the analysis is much more reliable because the hydraulic information is merged with the topological one.
Firstly, the relevance-based degree is applied to the direct graph of UDNs to effectively classify these infrastructure systems, and then, the edge betweenness centrality is used to assess the importance of sewer pipes in terms of vulnerability. The relevance-based degree identifies the UDNs as vulnerable systems, characterized by few hubs and many unimportant nodes. The number of hubs in the system increases with the increase of strategic structures, which entails an increase of nodes with high intrinsic relevance. The relevance-based edge metric identifies a ranking of importance for the sewer pipes; those traversed more times by the shortest paths between relevant nodes result in the most vulnerable.
The proposed structured design approach for assessing the vulnerability of sewer pipes can support the planning maintenance, monitoring, and in extreme cases, rehabilitation interventions.
ETHICS STATEMENT
Not applicable.
Open Research
DATA AVAILABILITY STATEMENT
The data used for the analysis are available by contacting Antonietta Simone ([email protected]).
The implementation of the strategy and the analysis of the data was carried out with MATLAB R2021b.


