Integrating social vulnerability to flood risk assessment in Metro Manila
Abstract
This study applied the interaction of social vulnerability and hazard to assess flood risk in three urbanized areas within the Pasig-Marikina-Laguna-Lake catchment: Manila, Marikina, and Parañaque in Metro Manila, Philippines. This study examined risk patterns across different flood return periods (5, 50, and 100 years) in these urban river environments and provided both city-wide and localized risk assessments. The social vulnerability to flood index (SVFI) was calculated using socioeconomic indicators, while the hazard index was derived from flood depth categories. Results show that city-level risk indices are low to moderate, with Marikina consistently having the highest risk, followed by Manila and Parañaque. However, localized assessments reveal high-risk areas within cities, with Manila being the most vulnerable to frequent floods (5-year return period) and Marikina to less frequent but extreme events (50- and 100-year return periods). Parañaque maintains the lowest risk profile across all scenarios. This study highlights the importance of considering both citywide trends and localized high-risk areas in flood risk management. It provides valuable insights for disaster management planners and policymakers, enabling the development of targeted strategies for sustainable urban river management and flood risk reduction in rapidly urbanizing river systems. The methodology presented applies to other urban areas that face similar flood risks.
1 INTRODUCTION
Urban flooding, particularly from overflowing rivers and drainage systems, is a growing global concern exacerbated by climate change and rapid urbanization. Floods are among the most prevalent and destructive natural hazards, with an annual average of 170 events affecting approximately 74.6 million people worldwide (CRED, 2023). The repercussions of flooding extend beyond immediate physical damage, leading to loss of life, infrastructure destruction, economic disruption, and long-term psychological effects on affected populations (Australian Business Roundtable for Disaster Resilience and Safer Communities, 2016; Twiddy et al., 2022). Vulnerable groups limited by gender, age, poverty, health, or disability often experience the most severe consequences (Zurich Flood Resilience Alliance, 2022). This underscores the urgent need for comprehensive flood risk assessment and management strategies that consider both physical flood characteristics and social vulnerability.
The interplay between urbanization and flooding is particularly pronounced in developing countries, where rapid population growth in flood-prone areas has exacerbated surface runoff and increased flood risk (Gray & Ocampo, 2017; O'Donnell & Thorne, 2020; Simonovic et al., 2021). By 2050, 66% of Asia's population is projected to reside in urban areas (UN DESA, 2019), further amplifying the flood risks faced by densely populated regions. Concurrently, climate change is expected to increase both the frequency and intensity of extreme precipitation events, compounding the challenges of urban flood management (IPCC, 2022; Muto et al., 2010). These factors highlight the pressing need for effective flood risk management (FRM) strategies to address the complexities of urban environments.
Flood risk, defined as the probability of damage or loss due to the interaction between flood events and vulnerable populations (UNDRR, 2022), varies according to flood characteristics and social vulnerability. Social vulnerability refers to the predisposition of people and communities to harm, and is influenced by their exposure, susceptibility, and resilience levels (Birkmann et al., 2013). Despite recent advancements in Flood Risk Assessment (FRA), a recent review indicated that most studies, particularly in rapidly urbanizing areas, have predominantly focused on hazard analysis through hydrological and hydraulic modeling (Cea & Costabile, 2022). Lagmay et al. (2017) developed flood hazard maps using flood simulations for risk assessments. Similarly, Papaioannou et al. (2021) used 2D flood modeling to analyze flooding in urban areas and generated flood hazard maps to address flood risk. This hazard-centric approach, while valuable for understanding the physical aspects of flooding, overlooks the crucial social dimension that influences the vulnerability of a community to floods. Some studies have assessed the vulnerability of urban communities, expressing it as the relationship between the factors of susceptibility, exposure, and resilience (Balica et al., 2012; Villordon, 2014), or between exposure and resistance (Tascón-González et al., 2020). This separation of risk component assessments highlights a significant gap in the current FRA methodologies, especially in complex urban environments.
The limited integration of social vulnerability in flood risk assessments can be attributed to several factors, including the complexity of urban systems, challenges in obtaining significant social data, and difficulties in quantifying social vulnerability (Cutter et al., 2003; UNU-EHS, 2013). Consequently, many FRM strategies may not adequately address the needs of the most vulnerable populations or overlook communities at high risk because of social factors rather than just physical exposure to flood hazards. This underscores the need for a more comprehensive approach to FRA that considers both physical and social dimensions of flood risk.
Recent studies have attempted to address this gap by integrating demographic and socioeconomic factors into FRA. Pornasdoro et al. (2014) applied a multi-criteria method with five indicators that reflect vulnerable social groups (women, children, and the elderly) alongside flooded areas and local revenue to estimate the risk. Building on this, Rubio et al. (2020) utilized the Analytic Hierarchy Process to express risk as a combination of hazard, exposure, vulnerability, and coping capacity. Both studies calculated risk by summing the indicators. While this approach is useful for analysis, it may not fully capture the interaction and interdependence between these indicators. This method could potentially lead to risk overestimation, particularly in scenarios where one component, such as the hazard level, is very low but others are high. For example, an area might be categorized as having significant risk, even if the hazard indicator (e.g., flood depth) was categorized as very low or none, because of high values of the other indicators. Meanwhile, some studies have expressed the interdependence of the components of risk through the product of its hazard and vulnerability elements. For example, Vojinovic et al. (2016) incorporated susceptibility and capacity indicators along with flood modeling to holistically assess flood risk in Ayutthaya, Thailand. Roy et al. (2021) used geospatial data, including topographic, meteorological, and resilience indicators and population density, to assess flood risk in the Himalayas. However, this latest study only reflects the vulnerability component when aligned with studies that have focused on flood vulnerability, where exposure, resilience, and susceptibility factors are explicitly defined (Balica et al., 2012; Dulawan, Imamura, Konishi, et al., 2024; Tascón-González et al., 2020). Similarly, Giurea et al. (2024) used comprehensive geospatial data to analyze flood risk along a stretch of the Gilort River in Romania but limited the social vulnerability component to the demographic characteristics of the study area. The unique landscape characteristics and socioeconomic dynamics of urban communities necessitate a tailored and comprehensive approach to flood risk assessment. Although these studies have advanced our understanding of flood risk, the use of minimal indicators may not fully capture its complexity. This underscores the need for a more comprehensive approach to FRA that considers both physical and social dimensions of flood risk.
Metro Manila, the highly urbanized capital region of the Philippines, serves as a pertinent case study for understanding the complexities of urban FRM. The region is characterized by frequent and devastating flood events, with the National Disaster Risk Reduction Council (NDRRMC) reporting an average of three to four major flooding incidents that affect thousands of families annually. These intense precipitation events overwhelm waterways, inundating adjacent and low-lying areas and causing significant disruptions to daily life, including traffic chaos, school closures, health concerns, and even loss of life (Bankoff, 2003; Lagmay et al., 2017; Porio & See, 2015). The urgency of addressing flood risk in Metro Manila is amplified by its complex geographical and socioeconomic characteristics, including high population density, inadequate drainage systems, and informal settlements.
The Pasig-Marikina-Laguna-Lake River Basin, where the region is part of, has experienced severe flooding exacerbated by rapid urbanization, which has altered land use and hydrological behavior. This has led to increased streamflow, peak runoff, and discharge (Andong & Sajor, 2017). Notable flood events, such as the extreme floods in September 2009 and November 2020, and even during the current year, have underscored the vulnerability and need of the region to improve flood management strategies.
Recurring floods in the region have led to the development of numerous flood control projects, which can be traced back to the early 1900s (Gilbuena et al., 2013). The latest flood management master plan study, completed in 2012, proposed an integrated approach that covers both structural and non-structural measures (Mercado et al., 2020) to address frequent floods in the region. This plan relied on hazard analysis through flood simulations and hydrologic and hydraulic analyses to formulate strategies. While these efforts have made significant strides in flood management, the dynamic nature of urban environments, characterized by rapid land-use changes, population growth, and climate variability, necessitates continuous refinement and adaptation of flood risk assessment methods (Zevenbergen et al., 2020). The complex interplay of social, administrative, economic, and environmental factors in Metro Manila presents challenges that require integrated and nuanced approaches to flood risk assessment (Lagmay et al., 2017; Mercado et al., 2020; Porio, 2011). This evolving understanding of flood risk in urban contexts underscores the need for methodologies that can capture both the physical and social dimensions of flood vulnerability in rapidly changing urban environments such as Metro Manila.
This study aims to enhance flood risk assessment by integrating comprehensive social vulnerability analysis with flood hazard analysis through numerical flood simulations. To achieve this, the study presents a holistic framework and exemplifies its applicability to three cities in Metro Manila: Manila, Marikina, and Parañaque. The study analyzed three flood risk scenarios, representing a high probability of exceedance but low-magnitude events (T = 5 year [yr]), low probability but extreme events (T = 100 yr), and moderate conditions (T = 50 yr). The significance of this research is underscored by its potential to provide more accurate identification of high-risk areas by considering both physical hazards and social vulnerabilities, offer insights into the factors contributing to flood risk across different communities within Metro Manila, and contribute to a broader understanding of integrated flood risk assessment in rapidly urbanizing areas, with potential applications beyond Metro Manila. By combining vulnerability analysis and hazard modeling, this study aims to inform the development of more sustainable and equitable urban flood management strategies, ultimately enhancing the resilience of Metro Manila and similar urban environments facing the challenges of flooding.
2 STUDY AREA
Manila, Marikina, and Parañaque are located within the Metro Manila floodplain downstream of the Pasig-Marikina-Laguna-Lake catchment (Figure 1). These urban areas represent diverse hydrological and urbanization contexts within larger river systems (Dulawan, Imamura, Amaguchi, et al., 2024). They are exposed to frequent flooding, primarily from fluvial and pluvial sources, with low-lying areas in Manila and Parañaque also experiencing tidal flooding due to their proximity to Manila Bay. The Pasig and Marikina Rivers, major waterways in the catchment, play crucial roles in the flood dynamics of these cities.
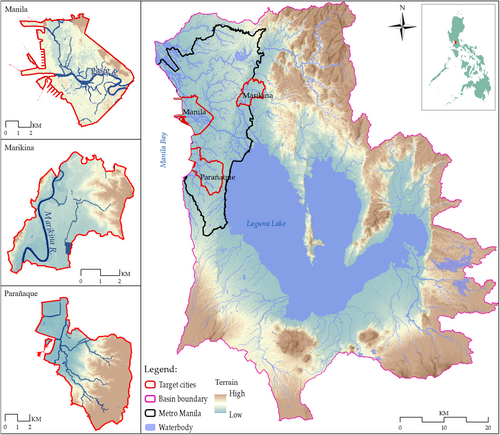
The terrain varies significantly across the study area, influencing local flood patterns. Manila and Parañaque are characterized by flat, low-lying terrain, which makes them particularly susceptible to prolonged inundation. In contrast, Marikina features partially hilly areas, which can contribute to rapid surface runoff during intense rainfall events.
These cities represent a range of urban densities within the region. According to the latest census report by the Philippine Statistics Authority (PSA), Manila is the most densely populated city (43,987 persons/km2 based on the total administrative area). Managing flood risk in the area is crucial, given its high concentration of people and infrastructure. Marikina is in the middle range in terms of population density (19,883 persons/km2) within the region, while Parañaque has a low range in terms of population density (15,386 persons/km2).
This diverse selection of cities provides an opportunity to examine how varying urban characteristics interact with flood hazards in complex river systems, offering valuable perspectives for integrated FRM in highly urbanized tropical environments.
3 METHODOLOGY
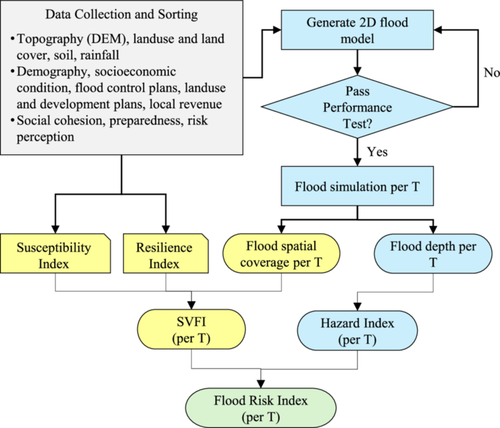
Figure 2 shows a schematic diagram of the procedures used to estimate the flood risk index (RI) by combining the hazard and vulnerability analyses. Input datasets were first collected by conducting surveys, visiting respective offices, and downloading them from the official websites of related agencies. Using the physical and meteorological characteristics of the study area, a two-dimensional flood model using the Hydrologic Engineering Center River Analysis System (HEC-RAS) was generated to obtain the probable flood depths and spatial coverage per return period flood. The flood depths were used to analyze the hazard index (HI), whereas the flood spatial extents were used to analyze the social vulnerability to flood index (SVFI).
3.1 Input datasets
Two main datasets were used in this study. The primary dataset was obtained through door-to-door and online social surveys, whereas the secondary datasets were obtained from various government agencies, such as the PSA, Department of the Interior and Local Government (DILG), Department of Public Works and Highways (DPWH), National Mapping Resources and Information Agency (NAMRIA), National Disaster Risk Reduction and Management Council (NDRRMC), Philippine Atmospheric, Geophysical and Astronomical Services Administration (PAGASA), Metro Manila Development Authority (MMDA), and Humanitarian Data Exchange (HDX) of the United Nations Office for the Coordination of Humanitarian Affairs (UN-OCHA).
A door-to-door survey was conducted to collect data to analyze and quantify social vulnerability to flood (SVF) indicators. The details and information of the survey were provided in an earlier study to understand the drivers of vulnerability in the study area. In total, 1169 samples were collected during a survey conducted from February to March 2023 (Dulawan, Imamura, Amaguchi, et al., 2024). An online survey was conducted to gather the judgment of nine experts involved in FRM for pairwise comparison of the vulnerability indicators to be used for the SVFI analysis (Dulawan, Imamura, Konishi, et al., 2024).
The secondary datasets were downloaded from the official websites of the respective agencies. If data were not available online, letters of request were sent to the respective government agencies to obtain the data.
3.2 Flood risk framework
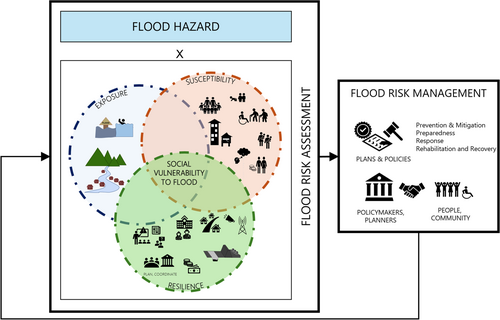
where for each city, c, and specified return period flood, T [year], is a corresponding RI, flood hazard index, HI, and SVFI.
3.2.1 Estimating HI
Hazard is the probability of a flood occurring and is described by the flood characteristics (Schanze et al., 2006). The HI represents the overall flood hazard level, considering both the extent and severity of flooding across the city. To estimate the HI, flood depths were first categorized into three categories according to the standards used in the Philippines (Lagmay et al., 2017), as shown in Table 1.
| Flood category, h | Flood depth, d [m] |
|---|---|
| 1 | d ≤ 0.5 |
| 2 | 0.5 < d ≤ 1.5 |
| 3 | d > 1.5 |
In describing the HI, the values were categorized into three categories based on flood depth. They are High (0.667 < HI ≤ 1.0), Moderate (0.333 < HI ≤ 0.667), and Low (0 < HI ≤ 0.333).
3.2.2 Estimating social vulnerability index
| SVF factors | Indicators |
|---|---|
| Exposure | Proportion of population within the spatial extent of flooding per return period, T |
| Susceptibility | Percentage of the population of children, elderly, female, male working group, persons with functional difficulty; average household size; percentage of single-headed households, unemployed household head, households renting; housing quality; and low-risk perception |
| Resilience | Percentage of households with access to flood warnings and information; educational attainment of household heads; social cohesion; government flood control projects and development plans; available open space and forest; and local revenue |
3.3 Flood analysis for HI
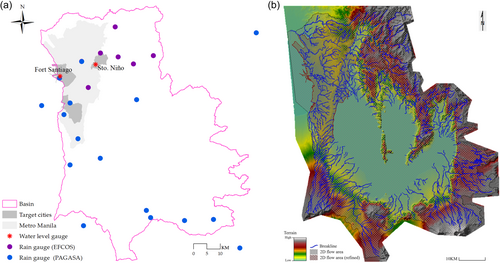
For this study, three flood frequencies were considered, representing floods that have high (T = 5 yr), moderate (T = 50 yr), and low (T = 100 yr) probabilities of occurring annually, but with low, moderate, and high probable impacts, respectively. To determine flood depths and spatial extents, a 2D flood model was developed using the HEC-RAS tool. Figure 4 displays the locations of the rainfall gauging stations (RGS) and water level stations (WLS) used in the model, as well as the 2D mesh for the geometric data. Point precipitation data were used as the upstream boundary conditions, whereas a stage hydrograph was used for the downstream boundary condition. Rainfall data were obtained from PAGASA and the MMDA Effective Flood Control Operation System (EFCOS), while the observed water levels were obtained from EFCOS only.
3.3.1 Model parameter calibration and validation
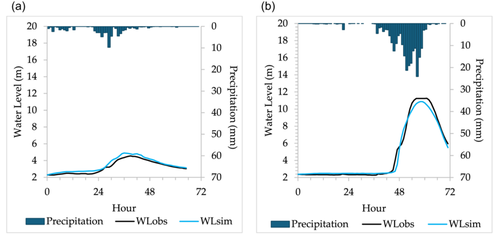
From October to November 2020, a series of typhoons and low-pressure areas enhanced by the monsoon brought heavy rainfall, causing several flood events in Metro Manila. Two historical flood events in 2020 were used for model calibration and validation (Table 3). The observed water level data at Sto. Niño gauging station was used as a reference, while hourly rainfall and water level datasets were used as input for the model.
| Flood event dates | Associated meteorological event | Event description | Use in the flood model |
|---|---|---|---|
| October 23–27, 2020 | Typhoon Quinta (Int'l name: Molave) | High flows recorded at Sto. Niño station due to heavy rainfall | Calibration |
| November 11–15, 2020 | Typhoon Ulysses (Int'l name: Vamco) | High flows recorded at Sto. Niño due to heavy rainfall | Validation |
| NSE | PBIAS | Performance description |
|---|---|---|
| 0.75–1.00 | <±10 | Satisfactory–very good |
| 0.65–0.75 | ±10 to ±15 | Satisfactory–good |
| 0.50–0.65 | ±15 to ±25 | Satisfactory–moderate |
| <0.50 | >±25 | Unsatisfactory |
- Abbreviations: NSE, Nash–Sutcliffe efficiency coefficient; PBIAS, percentage of the average tendency.
3.3.2 Estimation of probable floods
For the simulation of the 5-, 50-, and 100-yr return period floods, rainfall intensity–duration–frequency (RIDF) tables were obtained from PAGASA. Most of the RGS employed in the calibration and validation do not have sufficient records to estimate the probable rainfall corresponding to the mentioned return periods. Thus, other nearby rainfall stations with available RIDFs provided by PAGASA were used. The RIDF values were then used to calculate the 24-h rainfall hyetographs using the alternating-block method following the standards practiced in the Philippines (Department of Public Works and Highways, 2015).
For the downstream boundary condition, a constant stage hydrograph was used, which is equal to the mean higher-high-water level (MHHWL = 0.53 m amsl) observed at South Manila Harbor obtained from NAMRIA.
4 RESULTS
4.1 Calibration and validation results
Figure 5 shows the observed and simulated water levels at Sto. Niño station during the two flood events and Table 5 summarizes the statistical performance of the model. The results show that both flood models are able to replicate flood events very well, despite the slight overestimation of the peak during the calibration stage and underestimation during the validation stage.
| Event | ||
|---|---|---|
| Test | A | B |
| NSE | 0.90 | 0.98 |
| PBIAS | +7.20 | −1.56 |
| RSME | 0.21 | 0.38 |
- Abbreviations: NSE, Nash–Sutcliffe efficiency coefficient; PBIAS, percentage of the average tendency; RMSE, root mean square error.
4.2 Probable flooding in the three cities
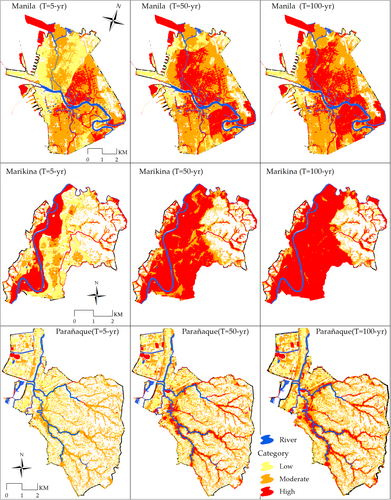
The results summarized in Table 6 and visualized in Figure 6 show significant variations in flood depth and affected area across the three cities for the different return periods. Among the three cities, Marikina exhibited the highest susceptibility to flooding. Even with frequent floods (T = 5 yr), 18.6% of the Marikina area has a high flood category (h = 3). This increases as events become more extreme, with over half of the city (56.6%) potentially experiencing high floods at T = 100 years. These findings suggest that a significant portion of the Marikina area is at risk of deep inundation during major flood events. Compared with Marikina, Manila exhibits lower flood susceptibility. A significant proportion (41.8%) had experienced moderate flooding at T = 5 years. However, 10.5% of its area is susceptible to high floods (h = 3) at the same return period. This intensified at T = 50 years, with 23.0% having high flood depths. On the other hand, Parañaque exhibited the lowest flood susceptibility among the three cities, where the affected areas were relatively small and the flood depths were predominantly categorized as low (h = 1) or moderate (h = 2). Even at the extreme T = 100 yr event, only 5.6% of Parañaque have the possibility of high floods.
| T = 5 yr | T = 50 yr | T = 100 yr | ||||
|---|---|---|---|---|---|---|
| City | % AF | Scale | % AF | Scale | % AF | Scale |
| Manila | 41.8 | Moderate | 45.5 | Moderate | 44.9 | Moderate |
| 23.3 | Low | 23.0 | High | 26.6 | High | |
| 10.5 | High | 12.1 | Low | 11.5 | Low | |
| Marikina | 20.5 | Low | 44.3 | High | 56.6 | High |
| 18.6 | High | 19.1 | Moderate | 9.3 | Moderate | |
| 13.4 | Moderate | 4.9 | Low | 4.0 | Low | |
| Parañaque | 23.7 | Low | 23.4 | Low | 24.3 | Low |
| 7.7 | Moderate | 13.1 | Moderate | 16.1 | Moderate | |
| 2.2 | High | 4.3 | High | 5.6 | High | |
- Note: “% AF” = percentage of area flooded to total city area.
4.3 Estimated RIs
Tables 7–9 show the resulting local and city-level HIs, SVFIs, and RIs for all return periods considered. The HI results reflect the hydrological characteristics of the river system under different flood scenarios. The city-level HI increased with longer return periods for all cities, reflecting the growing flood hazard. Marikina showed the highest city-level HI for T = 100 yr events, suggesting the need for targeted river and urban management interventions in this area. The SVFI results provide insights into the socio-economic aspects of flood risk in urban river environments. Manila had the highest SVFI across all scenarios, indicating a greater social vulnerability to flood impacts. This was mainly due to having the widest spatial flood extent compared to the other two cities. Marikina followed closely, while Parañaque showed the lowest social vulnerability. These findings emphasize the need for integrated approaches combining river engineering with social and urban planning for FRM.
| HI | SVFI | RI | |||||||||||
|---|---|---|---|---|---|---|---|---|---|---|---|---|---|
| City | AF (%) | Local | Scale | City | Scale | Local | Scale | City | Scale | Local | Scale | City | Scale |
| Manila | 41.8 | 0.667 | M | 0.462 | M | 0.111 | M | 0.111 | M | 0.074 | M | 0.051 | M |
| 23.3 | 0.333 | L | 0.111 | M | 0.037 | M | |||||||
| 10.5 | 1.000 | H | 0.111 | M | 0.111 | H | |||||||
| Marikina | 20.5 | 0.333 | L | 0.344 | M | 0.089 | M | 0.089 | M | 0.030 | M | 0.031 | M |
| 18.6 | 1.000 | H | 0.089 | M | 0.089 | M | |||||||
| 13.4 | 0.667 | M | 0.089 | M | 0.060 | M | |||||||
| Parañaque | 23.7 | 0.333 | L | 0.153 | L | 0.053 | L | 0.053 | L | 0.018 | L | 0.008 | L |
| 7.7 | 0.667 | M | 0.053 | L | 0.035 | M | |||||||
| 2.2 | 1.000 | H | 0.053 | L | 0.053 | M | |||||||
- Note: For RI, H (RI > 0.101), M (0.018 < RI ≤ 0.101), and L (RI ≤ 0.108). “Local” values refer to the disaggregated indices for spatial mapping, and “City” refers to index values at the city level.
- Abbreviations: HI, hazard index; RI, risk index; SVFI, social vulnerability to flood index.
| HI | SVFI | RI | |||||||||||
|---|---|---|---|---|---|---|---|---|---|---|---|---|---|
| City | AF (%) | Local | Scale | City | Scale | Local | Scale | City | Scale | Local | Scale | City | Scale |
| Manila | 45.5 | 0.667 | M | 0.574 | M | 0.119 | M | 0.119 | M | 0.079 | M | 0.068 | M |
| 23.0 | 1.000 | H | 0.119 | M | 0.119 | H | |||||||
| 12.1 | 0.333 | L | 0.119 | M | 0.040 | M | |||||||
| Marikina | 44.3 | 1.000 | H | 0.586 | M | 0.116 | M | 0.116 | M | 0.116 | H | 0.068 | M |
| 19.1 | 0.667 | M | 0.116 | M | 0.078 | M | |||||||
| 4.9 | 0.333 | L | 0.116 | M | 0.039 | M | |||||||
| Parañaque | 23.4 | 0.333 | L | 0.209 | L | 0.064 | M | 0.064 | M | 0.021 | M | 0.013 | L |
| 13.1 | 0.667 | M | 0.064 | M | 0.043 | M | |||||||
| 4.3 | 1.000 | H | 0.064 | M | 0.064 | M | |||||||
- Note: For RI, H (RI > 0.101), M (0.018 < RI ≤ 0.101), and L (RI ≤ 0.108). “Local” values refer to the disaggregated indices for spatial mapping, and “City” refers to index values at the city level.
- Abbreviations: HI, hazard index; RI, risk index; SVFI, social vulnerability to flood index.
| HI | SVFI | Risk | |||||||||||
|---|---|---|---|---|---|---|---|---|---|---|---|---|---|
| City | AF (%) | Local | Scale | City | Scale | Local | Scale | City | Scale | Local | Scale | City | Scale |
| Manila | 44.9 | 0.667 | M | 0.603 | M | 0.122 | M | 0.122 | M | 0.081 | M | 0.074 | M |
| 26.6 | 1.000 | H | 0.122 | M | 0.122 | H | |||||||
| 11.5 | 0.333 | L | 0.122 | M | 0.041 | M | |||||||
| Marikina | 56.6 | 1.000 | H | 0.641 | M | 0.119 | M | 0.119 | M | 0.119 | H | 0.076 | M |
| 9.3 | 0.667 | M | 0.119 | M | 0.079 | M | |||||||
| 4.0 | 0.333 | L | 0.119 | M | 0.040 | M | |||||||
| Parañaque | 24.3 | 0.333 | L | 0.244 | L | 0.072 | M | 0.072 | M | 0.024 | M | 0.018 | L |
| 16.1 | 0.667 | M | 0.072 | M | 0.048 | M | |||||||
| 5.6 | 1.000 | H | 0.072 | M | 0.072 | M | |||||||
- Note: For RI, H (RI > 0.101), M (0.018 < RI ≤ 0.101), and L (RI ≤ 0.108). “Local” values refer to the disaggregated indices for spatial mapping, and “City” refers to index values at the city level.
- Abbreviations: HI, hazard index; RI, risk index; SVFI, social vulnerability to flood index.
At the city level, the RI values ranged from low to moderate across all the flood frequency scenarios. Despite the presence of localized high-risk areas in Marikina and Manila, the overall city-level risk remained moderate. This moderation of risk at the city scale can be attributed to two primary factors: (1) the heterogeneity of flood hazard within each city, where high-risk sections are counterbalanced by areas of lower flood categories or non-flooded zones, and (2) the moderate SVFI values of the cities. It should be noted that the city-level RI is a composite measure affected by flood category and SVFI. While providing a comprehensive overview, this aggregation method may hide the fact that some smaller areas are at a high risk.
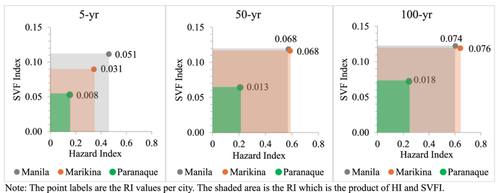
Marikina and Manila showed similar city-level RIs for T = 50 yr and T = 100 yr events, whereas Parañaque consistently had the lowest city-level RI across all scenarios. Although Marikina and Manila exhibit similar city-level RIs for T = 50 yr and T = 100 yr events, a closer examination reveals that their underlying factors differ. The higher HI of Marikina was partially offset by a relatively lower SVFI, which resulted in a moderate citywide RI. In contrast, the higher SVFI of Manila amplifies the impact of its hazard, leading to a similar RI despite a lower HI. Parañaque consistently had the lowest city-level RI across all scenarios. Figure 7 illustrates the effect of risk components on the resulting RI. Considering the change in each variable from T = 5 yr to T = 100 yr, the charts emphasize that while HI generally increases for all cities, the corresponding changes in SVFI and RI are not always proportional. For example, at T = 50 yr, Marikina and Manila have the same RI, even though the latter has a lower HI. The RI of Manila was amplified with high SVFI. This highlights the complexity of determining the overall risk, emphasizing the importance of considering both components for flood risk assessment. The integration of SVFI into RI is crucial, as it transforms physical hazard (HI) into a measure of risk (RI) by accounting for the demographic, socioeconomic, and institutional conditions that affect the exposure, susceptibility, and resilience of the community.
To illustrate the spatial variation of RI within each city, HI was represented by the normalized flood depth category (h). This approach provides a more precise representation of risk levels based on flood severity irrespective of the extent of the flooded area. Consequently, areas within a city that share identical h and SVI are assigned the same RI, regardless of the percentage of inundated areas. The decision to exclude the area component from the HI calculation was made because incorporating it tends to underestimate the risk in zones with high flood depth categories but with a small spatial extent, as evidenced by the city-level RI calculations. Moreover, this method allows for a nuanced understanding of urban flooding and ensures that the localized risk assessment accurately reflects the potential impact of severe flooding events, even in smaller areas, thus providing a more comprehensive understanding of the flood risk distribution across the city.
Figure 8 shows the localized flood RIs within each city, revealing significant spatial variations in the flood risk. The results demonstrate how flood risk changes across different return periods and varies among the three cities. During high-frequency floods (T = 5 yr), Manila has 10.5% of its area at high risk, which indicates that even during relatively low-intensity but high-frequency flood events, certain areas of the city face substantial risk. Meanwhile, Marikina and Parañaque showed moderate to low risk, attributed to better vulnerability (i.e., L to M) and flood exposure conditions (i.e., more areas with lower flood categories). This suggests the need for improved urban drainage systems and localized flood protection measures.
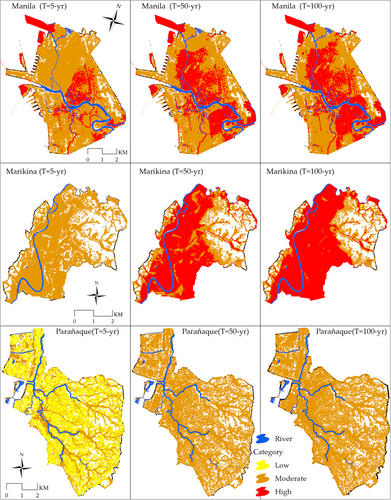
At medium-frequency floods (T = 50 yr), risk levels increase for all cities, with Marikina having the highest change, and 44.3% of its area is at high risk, indicating vulnerability to this type of flood. Manila retained high-risk sections (23.0%), while Parañaque showed a slight increase in risk, but still had a moderate risk category.
For low frequency but extreme floods (T = 100 yr), Marikina remains the most at-risk, with 56.6% of its area at high risk. This indicates that, during extreme events, the city has more challenges compared to the other two cities. Areas at high risk in Manila also increased to 26.6% and a substantial portion (56%) were at moderate risk. Parañaque consistently maintained the lowest risk profile across all return periods, although its risk increased for extreme events.
This comprehensive assessment revealed that while all three cities face increasing flood risks with longer return periods, they exhibit different vulnerabilities and spatial risk patterns. Manila is most vulnerable to frequent floods, whereas Marikina faces the highest risk during extreme events. Parañaque, while still at risk, consistently showed lower vulnerability than the other two cities. These findings underscore the importance of tailored FRM strategies for each city, considering both the spatial distribution of the risk and the varying impacts of different flood frequencies.
5 DISCUSSION
The findings revealed that, while all three cities face increasing flood risks with longer return periods, they exhibit different vulnerabilities and spatial risk patterns. While citywide RIs show low to moderate risk, significant spatial variations exist within urban areas. Manila is the most vulnerable to a relatively high annual chance of flooding, whereas Marikina faces the highest risk during extreme events. Parañaque, although consistently showing lower vulnerability than the other two cities, still experiences increased risk as floods escalate. These findings have significant implications for FRM strategies in urban environments. They highlighted the critical need for localized risk assessments and the development of targeted strategies due to the complex nature of urban flooding. FRM strategies should prioritize the identification of high-risk pockets within cities, even for areas with moderate overall risk, to develop strategies that mitigate disasters while considering the potential impact of these plans on wider urban river systems.
Integrating SVFI and HI provides a comprehensive profile of flood risk in urban river environments, enabling the development of targeted strategies that address both the physical characteristics of river flooding and the social vulnerability of urban populations. This approach is particularly significant in the face of climate change, evolving social conditions (de Bruijn et al., 2022; Sayers et al., 2015), and unsustainable reliance on traditional hazard-based structural measures (Zevenbergen et al., 2020) because of their static design capacities. Integrating social vulnerability factors into flood risk assessments is crucial for developing more resilient and adaptive flood risk-management strategies. The framework and methods used in this study significantly contribute to enhancing such policies by providing a more nuanced understanding of flood risk that incorporates social vulnerability at various scales.
This can lead to improved living conditions, particularly in areas with moderate to high HI and SVFI. Understanding the spatial variation of risk within cities allows for a more efficient allocation of resources in FRM, focusing first on areas with the highest cumulative risk. Furthermore, clear communication with stakeholders and the public regarding the discrepancy between localized high-risk areas and moderate citywide risk is crucial for ensuring appropriate preparedness and response measures. This is relevant in terms of non-structural measures that complement structural measures to achieve sustainable FRM strategies in both developed and developing countries.
These implications emphasize the need for a nuanced data-driven approach for FRM in urban river environments. This approach should consider both citywide trends and localized high-risk areas while simultaneously addressing riverine impacts and social vulnerabilities. Furthermore, by integrating social vulnerability into flood risk assessments, this study aligns with the growing emphasis on integrated FRM, thereby providing valuable insights for policymakers and river managers to improve FRM and enhance urban resilience. For the three target cities in Metro Manila, tailored strategies should be developed, based on the specific risk profile of each city. Manila should focus on mitigating risks from frequent flooding and addressing localized high-risk areas. Strategies that temporarily store floodwaters and programs to enhance living and socioeconomic conditions can help to reduce flood damage and loss. Marikina should prioritize projects and measures to reduce vulnerability to extreme events. City administrators should coordinate with their respective government agencies and residents to expedite the implementation of flood control projects. Parañaque should improve resilience by promoting access to flood-related information and disaster risk reduction management education among residents across all cities.
Future research should focus on refining the integration of social vulnerability factors at multiple scales from individual households to broader communities. This could involve identifying indicators that capture the nuances of social vulnerability in various cultural and economic contexts. Additionally, exploring the dynamic nature of social vulnerability in parallel with flood characteristics over time and in response to changing climatic conditions would further enhance the applicability of this approach to long-term FRM planning.
6 CONCLUSIONS AND RECOMMENDATIONS
The estimation of the flood RI by applying this framework demonstrated varying vulnerabilities and spatial risk patterns across the three cities. The findings show an increasing risk for all cities as the flood return period lengthens (T = 5 yr to 100 yr), with significant variations at both city and local levels. City-level risk indices suggest a low-to-moderate range, with Marikina consistently exhibiting the highest risk profile, followed by Manila and Parañaque. However, localized assessments revealed sections of high risk, particularly in Manila, for frequent floods (T = 5 yr) and in Marikina for extreme events (T = 50 yr and T = 100 yr). These spatial variations highlight the complex interplay between urban development and river system dynamics in shaping flood risk. Furthermore, the findings emphasize the need for targeted FRM strategies that account for the spatial variability of risk within urban river systems. They underscored the critical importance of integrating social vulnerability assessments into traditional flood hazard mapping. This combined approach will contribute to the development of more comprehensive river management and flood risk-reduction policies.
The methodology employed in this study offers a comprehensive framework for assessing flood risk in urban river systems by integrating both social and physical risk aspects, thereby providing valuable insights into FRM strategies. This approach can be applied to other cities within the catchment and similar urban river environments, fostering more effective flood risk mitigation strategies.
Despite its comprehensiveness, this study has some limitations. The estimation of the SVFI relies on the assumption of a uniform population distribution within city areas (i.e., population density). Future research could refine this analysis by incorporating a more detailed examination of the population distribution and its influence on flood exposure. In addition, investigating the ongoing impacts of urban development on river system dynamics and flood risk is a valuable area for further exploration.
This research contributes to the growing body of knowledge of urban river management in the face of increasing flood risk. This provides a foundation for developing more resilient and sustainable urban river environments, aligned with the broader goals of integrated FRM and sustainable urban development.
ACKNOWLEDGMENTS
The authors would like to thank the government agencies who provided the data for our analysis, and the local officers and residents of Manila, Marikina, and Parañaque for participating in our study. This research was funded by TOKYO METROPOLITAN GOVERNMENT ADVANCED RESEARCH, grant number R4-2.
ETHICS STATEMENT
The authors confirm that this article follows the core practices of the Committee on Publication Ethics. The social survey was approved by the local administration offices. All participants provided informed consent for inclusion before participating in the study.
Open Research
DATA AVAILABILITY STATEMENT
Limited access to data due to confidential reasons. For raw data, kindly contact the government agencies mentioned as sources in this study.


