Deep learning-based dose prediction for low-energy electron beam superficial radiotherapy
Jialin Huang and Zhitao Dai contributed equally to this work.
Abstract
Background
Accurate surface dose calculation is crucial in superficial low-energy electron beam radiotherapy owing to shallow treatment depths and the risk of skin toxicity. Traditional Monte Carlo (MC) simulations are precise but computationally expensive and time-consuming.
Methods
This study combined MC simulations with deep learning to improve both accuracy and speed. DOSXYZnrc was used to simulate low-energy electron beams for six body sites, generating computed tomography phantoms and corresponding dose distributions. A cascaded 3D U-Net (C3D) model was trained on these datasets to predict dose distributions rapidly.
Results
The C3D model demonstrated significant improvements over traditional 3D U-Net models, achieving a minimum Gamma pass rate of 92.09% and a minimum dose difference pass rate of 93.58%. The model completed dose predictions in just 0.42 seconds, making predictions approximately 140,000 times faster than MC simulations. In the evaluation of dose distributions across six anatomical regions, C3D consistently outperformed other deep learning models (3D U-Net, Deep Convolutional Neural Network, and HD U-Net) in both accuracy and robustness.
Conclusion
The integration of deep learning with MC simulations significantly enhances the efficiency of surface dose calculations in superficial electron beam radiotherapy. The C3D model provides rapid and accurate dose predictions, facilitating efficient treatment planning while maintaining high accuracy.
1 BACKGROUND
Electron beam therapy has long been a cornerstone of radiotherapy. A single electron beam delivers a uniform “plateau” dose ranging from 90% to 100% of the maximum dose along the central axis, with the dose distribution sharply falling off laterally and distally. This characteristic enables the effective irradiation of surface cancers and diseases within 6 cm of the patient surface while minimizing exposure to normal tissues and structures, a result often unachievable with X-ray therapy.1 According to global cancer statistics, 1,522,708 new cases of skin cancer were diagnosed in 2020, including 1,198,073 cases of non-melanoma skin cancer and 324,635 cases of melanoma.2 Skin cancer is generally treated surgically, but surgery can lead to scarring.3, 4 Electron beam irradiation not only controls tumors but also prevents scarring. Consequently, electron beams have been widely used by dermatologists for many years.
Despite the effectiveness of electron beam therapy in treating skin cancer, electron beam dosimetry remains challenging. It depends on surface contours and tissue heterogeneity, such as variations in density and composition, requiring complex dose calculation algorithms and precise anatomical information. Clinical electron treatments are often calculated without volumetric imaging by assuming a flat patient surface and homogeneous water-equivalent tissue.5 These treatments do not account for the shape of the treated surface, leading to local dose variations exceeding ±20% for surface shapes similar to those of the nose, ear, or lips.6 Achieving more accurate electron beam therapy requires computed tomography (CT) scans for treatment planning and three-dimensional dose calculation algorithms. Current dose calculation methods include approximate algorithms such as pencil beam convolution,7 the anisotropic analytical algorithm,8 the Acuros XB algorithm,9 and the cone beam convolution algorithm.10 The Monte Carlo (MC) method, another dose calculation technique, relies on fundamental physical principles of particle interactions in simulated media and has been shown to accurately simulate electron beams in radiotherapy. Among available methods, MC simulation can produce high-resolution and accurate results in heterogeneous phantoms, but the simulation process is very time-consuming.
In recent years, deep learning has made significant progress in dose prediction for radiotherapy.11 Various deep learning models, including U-Net,12 three-dimensional (3D) U-Net,13 HD-U-Net,14 and Deep Convolutional Neural Network (DCNN),15 have been developed to enhance the speed of dose prediction. Although U-Net is effective for 2D image segmentation, it struggles with the three-dimensional complexity of electron beam dose distributions. 3D U-Net addresses this limitation by using 3D convolutions but continues to face challenges with heterogeneous tissues and complex surface geometries. More advanced models, such as HD-U-Net and DCNN, improve accuracy by incorporating denser connections and multi-scale modules, which increase model complexity. This added complexity can result in higher computational and memory demands. In addition, more intricate model architectures often create greater challenges in training and tuning and impose stricter requirements for data volume and preprocessing.
This study introduces the Cascade 3D U-Net (C3D) neural network, which combines the precision of MC simulations with the efficiency of deep learning. Unlike traditional models that rely on 2D convolutions or shallow 3D networks, C3D uses a cascaded approach to progressively refine 3D dose predictions, effectively addressing tissue heterogeneity and surface contour variations. We aimed to develop an algorithm capable of rapidly and accurately calculating dose distributions for low-energy electron beams in superficial treatments. To achieve this, CT phantom data were generated for various body sites, training datasets were created using the EGSnrc toolkit16 and DOSXYZnrc,17 and these datasets were used to train the C3D neural network to predict dose distributions efficiently.
2 METHODS
2.1 Monte Carlo simulation
In this study, DOSXYZnrc was selected for its strong performance in simulating electron and photon interactions, particularly in the low-energy range, which is critical for low-energy electron beams. This choice ensured both accuracy and reliability of the data while facilitating integration with CT phantoms and deep learning technology, thereby supporting the development of treatment planning systems.
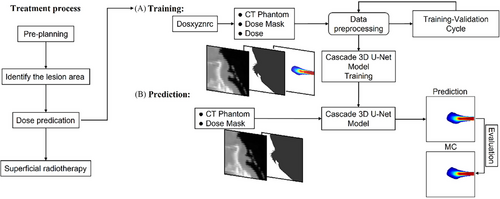
The treatment process and workflow are shown in Figure 1. First, pre-planning was performed to identify the lesion area and predict the dose, followed by superficial radiotherapy. During the dose training phase, the numpy.random function was used to randomly generate beam entry positions and angles (x, y, z, θ) within a specified range for each anatomical region. A parallel rectangular electron beam with predetermined positions and angles was then applied using DOSXYZnrc to generate a three-dimensional dose distribution. This dose distribution was used to create a dose mask, where positions with non-zero doses were marked as 1 and all other positions were marked as 0. The dose mask provided the C3D model with information about beam position and angle. The CT phantom data and dose mask were preprocessed together for training. Once the C3D model was trained, during the prediction phase, only the CT phantom and dose mask needed to be input into the model to obtain the predicted dose distribution. Finally, the predicted dose distribution was compared with the actual dose for evaluation.
2.1.1 Experimental setup
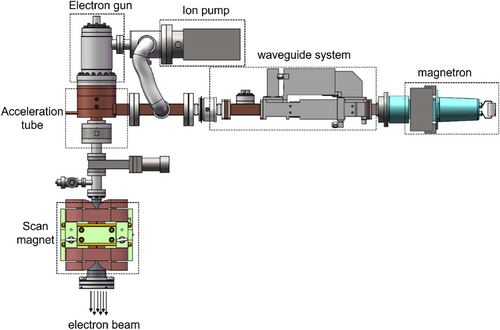
Electron beam therapy commonly used in clinical settings typically employs a 4–6 MeV sub-accelerator for tumor radiotherapy. However, lower-energy electrons can effectively reduce ionizing radiation in deeper tissues. Currently, no specialized products are designed specifically for superficial treatments. To address this gap, our research group independently developed low-energy electron beam medical equipment tailored for superficial treatment, as illustrated in Figure 2. This equipment uses a 30 kV hot cathode high-voltage electron gun to generate an electron source, which is subsequently injected into the accelerating tube. Simultaneously, a magnetron produces microwave power that is delivered through a waveguide system to establish an accelerating electric field. Electrons are accelerated under appropriate phase conditions, resulting in the output of electron bunches. By adjusting the power input into the microwave cavity, the energy of the electron beam can be modulated within a range of 1–2 MeV. Moreover, the treatment point can be precisely adjusted using a scanning code magnet, while an ion pump maintains the instrument in a vacuum state.
To align with the experimental equipment, this study set the electron beam energy to 2 MeV and employed the parallel beam configuration of DOSXYZnrc (isource = 1: Parallel Rectangular Beam Incident from Any Direction) with a square beam spot size of 0.5 × 0.5 cm2. For all DOSXYZnrc simulations, the scattering cross-section data were selected from the commonly used 700icru.pegs4dat file in the EGSnrc library, with an incident particle count of 1 × 10⁹. All other DOSXYZnrc input parameters were left at their default values.
2.1.2 CT data and phantom generation
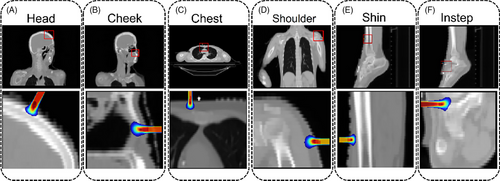
To address the uncertainty arising from the various shapes of scars and skin cancers in future clinical scenarios, this study constructed models of different body parts for training purposes. Three classic cases of superficial treatment, with clinical diagnoses shown in Table 1, were selected based on potential tumor and scar locations. CT data from six anatomical regions (head, cheek, chest, shoulder, shin, and instep) of three patients were used to construct CT phantoms using the Ctcreate software. In Ctcreate, the CT value of each voxel was converted into a specific material and density using Kawrakow's ramp.18 After processing, a phantom file in the .egsphant format was generated, and a predefined electron beam was incident parallel to the scoring volume at different positions and angles. Each phantom consisted of 128 × 128 × 128 voxels, with energy deposition recorded in each voxel. Using DOSXYZnrc, 3D dose distributions for the incoming low-energy electron beam were obtained, as shown in Figure 3.
| Patient | Sex | Age | Clinical diagnosis |
|---|---|---|---|
| Patient 1 | Female | 48 | Nasopharyngeal malignant neoplasm |
| Patient 2 | Female | 72 | Non-Hodgkin lymphoma |
| Patient 3 | Male | 69 | Lower limb skin malignancy |
To enhance data diversity and improve model generalizability for various electron beams, 600 random entry points on the surface of each body part were generated as incident positions for the electron beams, providing a sufficient number of training samples. The training data were drawn from multiple anatomical regions of three different patients, with samples from each region kept separate to avoid data leakage. The dataset, which included samples from six body regions, was used for both training and testing the C3D model, with careful splitting to minimize the risk of overfitting.
2.2 Model architecture
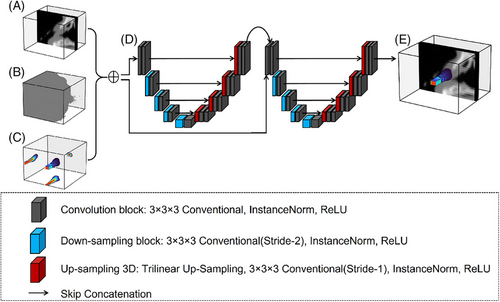
Motivated by the cascade mechanism,19, 20 this study adopted a cascaded 3D U-Net model consisting of two variants of the 3D U-Net architecture. The first 3D
U-Net predicts a coarse dose distribution, whereas the second 3D U-Net further refines the predictions from the first network.
The 3D U-Net structure consists of two main components: a downsampling path and an upsampling path, as shown in Figure 4. In the downsampling path, each block includes a 3 × 3 × 3 conventional convolution operation, an instance normalization layer, and a rectified linear unit activation. Downsampling is achieved by applying a 3 × 3 × 3 convolution with a stride of 2.
The downsampling process shifts the focus of the network from identifying subtle, local features of the dose distribution to recognizing broader, high-level features. This approach enhances the ability of the network to interpret dose distributions at a macro level, particularly in scenarios where a larger contextual understanding is needed to accurately predict the dose in a specific region.
The upsampling path consists of continuous upsampling operations, skip connections, 3 × 3 × 3 convolutions, instance normalization layers, and rectified linear unit activation functions. To achieve the same resolution in the output as in the original input, upsampling gradually increases the resolution of the feature map. During this process, some detailed information may be lost. To address this, the upsampling path incorporates skip connections to supplement the missing details. Trilinear interpolation is applied during skip connections to ensure that the predicted dose distribution remains consistent with the dose from MC simulation.
The model is designed to accurately predict electron beam dose distributions in complex three-dimensional phantoms. To achieve this, the model, during its predictive process, considers not only the unique characteristics of the electron beam—such as energy, direction, and intensity—but also the layout, density, and radiological properties of the various materials within the CT phantom to ensure the accuracy and reliability of the predictions. Ultimately, the model outputs a detailed 128 × 128 × 128 3D matrix containing voxel-wise dose distribution information.
2.3 Performance evaluation
2.3.1 Evaluation of uncertainty
To estimate uncertainty in dose predictions, MC Dropout22 was applied during inference. In this method, dropout was introduced in the final layer of the C3D model, with rates set at 0.1, 0.3, and 0.5. A total of 100 forward passes were conducted to generate a distribution of predictions.
2.3.2 Evaluation metrics
To evaluate the performance of the C3D model, several metrics were used, including mean squared error, Dice coefficient, structural similarity index measure, and peak signal-to-noise ratio.23 Mean squared error quantified the average squared difference between the predicted and MC simulated doses. The Dice coefficient measured spatial overlap, while the structural similarity index measure and peak signal-to-noise ratio evaluated the quality and similarity of the predicted dose distributions.
2.3.3 Gamma analysis
Gamma analysis, widely regarded as the gold standard, was used to assess dose distribution accuracy.24, 25 Both MC simulations and C3D model predictions stored three-dimensional dose information in 128 × 128 × 128 matrices. The 3D Gamma analysis method was applied to calculate dose differences (DDs) between the MC simulations and C3D predictions. For threshold selection, the 1%/1 mm, 2%/2 mm, and 3%/3 mm criteria were adopted, as these are commonly used in clinical radiation therapy26 and are widely recognized for evaluating dose distribution accuracy.
2.4 Data and implementation
The output from DOSXYZnrc consisted of two files: the CT models (.egsphant) and the 3D dose distributions (.3ddose). For the six selected body sites, 100 electron beam entry positions were simulated per site, generating a total of 600 dose distributions, each paired with its corresponding CT model, resulting in 600 data points. The entire dataset, totaling approximately 90 GB, was split into training (80%), validation (10%), and testing (10%) sets. The training data were used to optimize the neural network, the validation data helped determine the best model parameters, and the testing data evaluated the performance of the model.
Simulations were conducted on the High-Performance Computing Public Platform (Shenzhen Campus) of Sun Yat-Sen University, utilizing 540 Intel Xeon cores. Each simulation took approximately nine hours, and the entire process required about one week to complete. Neural network operations were performed using Python and the PyTorch framework, with CUDA graphical processing unit (GPU) acceleration on an NVIDIA A800 GPU with 80 GB of memory.
3 RESULTS
3.1 Model training results
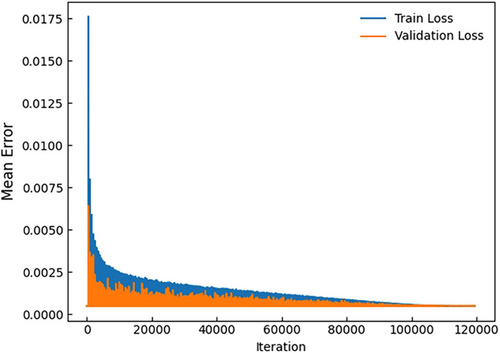
In this study, 480 data points were allocated to the training dataset, 60 to the validation dataset, and 60 to the testing dataset. The maximum number of iterations was set to 120,000, and the batch size was set to 32. The learning rate and the number of training iterations for the deep neural network were optimized to achieve the best performance. The training process took approximately 63 hours, and the trained C3D dose prediction model can generate a dose distribution for a CT phantom in approximately 0.42 seconds.
Figure 5 illustrates the loss values for the training and validation datasets of the C3D model. Both training and validation losses decrease with an increasing number of iterations, indicating that the model gradually converges toward an optimal solution. Despite some oscillations in the validation loss, the overall trend suggests that the model steadily approaches its optimal performance as training progresses.
3.2 Ablation studies and model uncertainty analyses
Figure 6(A) shows a 2D slice of the dose distribution in the cheek region. The results indicate that the prediction from a single 3D U-Net model is inferior to that of the C3D model in both high- and low-dose regions. Refining the predicted results during training improves model performance compared with using a single 3D U-Net model, highlighting the importance of the cascade mechanism in enhancing prediction accuracy. During inference, MC Dropout was applied in the C3D model with dropout rates of 0.1, 0.3, and 0.5 to quantify uncertainty.
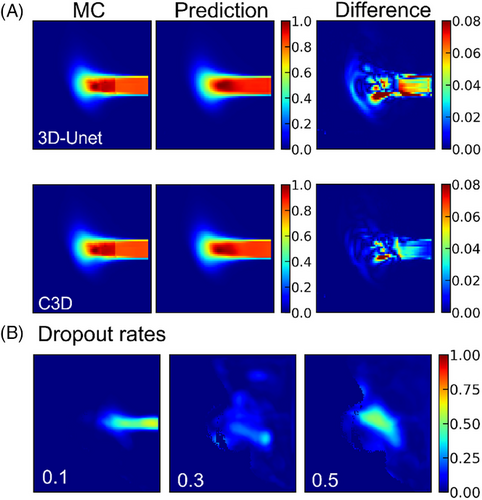
Figure 6(B) illustrates the impact of different dropout rates on dose prediction. With a dropout rate of 0.1, the predicted dose distribution maintains a clear shape. However, as the dropout rate increases to 0.3 and 0.5, the predicted dose distribution becomes increasingly blurred, indicating greater uncertainty and reduced prediction quality. These results suggest that higher dropout rates may remove valuable information, leading to poorer model performance and increased uncertainty. As shown in Table 2 (p < 0.05), ablation studies and uncertainty analyses were conducted to assess the impact of the cascade mechanism and different dropout rates on model performance. In the shoulder dataset, the inclusion of the cascade mechanism improved the Dice coefficient from 0.8861 to 0.9592. In the head dataset, the mean squared error increased from 0.0992 (dropout 0.1) to 0.1941 (dropout 0.3) and 0.2028 (dropout 0.5), indicating that higher dropout rates lead to greater uncertainty.
| C3D | 3D U-Net | Dropout | |||||||||
|---|---|---|---|---|---|---|---|---|---|---|---|
| Site | MSE | PSNR | SSIM | Dice | MSE | PSNR | SSIM | Dice | MSE 0.1 | MSE 0.3 | MSE 0.5 |
| Head | 0.0107 | 69.80 | 0.8778 | 0.8762 | 0.0113 | 67.90 | 0.8515 | 0.8469 | 0.0992 | 0.1941 | 0.2028 |
| Cheek | 0.0080 | 71.72 | 0.9553 | 0.9554 | 0.0140 | 66.71 | 0.9147 | 0.9150 | 0.0282 | 0.0704 | 0.0564 |
| Chest | 0.0041 | 72.93 | 0.9474 | 0.9472 | 0.0070 | 70.07 | 0.9021 | 0.9006 | 0.0544 | 0.1424 | 0.0971 |
| Shoulder | 0.0021 | 75.13 | 0.9616 | 0.9592 | 0.0058 | 70.59 | 0.8926 | 0.8861 | 0.0340 | 0.0838 | 0.0833 |
| Shin | 0.0049 | 72.21 | 0.9685 | 0.9684 | 0.0086 | 69.59 | 0.9337 | 0.9345 | 0.0447 | 0.0679 | 0.0769 |
| Instep | 0.0055 | 71.09 | 0.9514 | 0.9518 | 0.0081 | 69.28 | 0.9198 | 0.9201 | 0.0368 | 0.0707 | 0.0796 |
- Abbreviations: MSE, mean squared error; PSNR; peak signal-to-noise ratio; SSIM, structural similarity index measure.
3.3 Prediction dose distribution results
During training, one iteration refers to a complete pass through the entire training dataset to update the model weights. After 120,000 training iterations, the optimal model was selected to predict dose distributions on CT phantoms. Figure 7 illustrates the one-dimensional depth dose curves along the central axis of the phantom surface irradiated by the electron beam. To evaluate model stability, the mean absolute percentage error (MAPE) is defined as where Dpre(r) is the predicted normalized dose at position r, and Dmc(r) is the MC simulated normalized dose at position r. Using MAPE, the studied variables can be analyzed, and model stability can be evaluated relative to the experimental dataset.
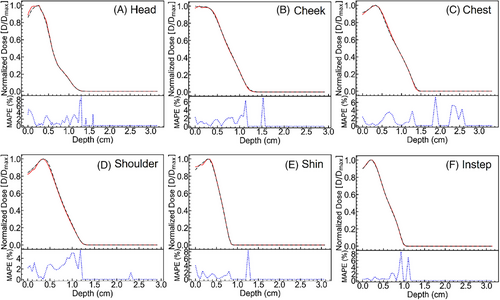
After the electron beam irradiates the skin surface and interacts with tissue, the dose distribution predicted by the C3D model closely matches that obtained from MC simulations, demonstrating overall stability and accuracy. However, an increase in MAPE of up to 8% is observed at the maximum electron penetration depth. This region corresponds to a low-dose area, where the normalized dose values are extremely small, approaching zero. The limited availability of dedicated training data for deep, low-dose regions further challenges the predictive accuracy of the C3D model. Consequently, greater penetration depth leads to increased MAPE, highlighting the difficulty of precise dose estimation in low-dose regions.
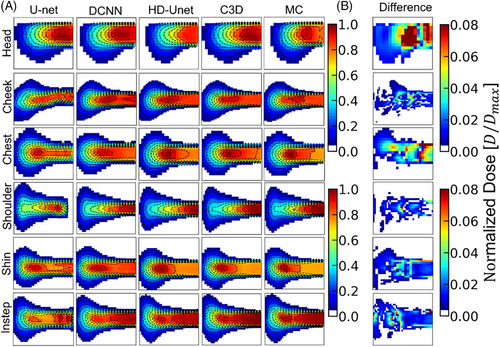
To visually compare the dose prediction performance of different deep learning models (U-Net, DCNN, HD U-Net, and C3D), 2D dose slices were extracted from CT phantoms of six anatomical sites (head, cheek, chest, shoulder, shin, and instep), with isodose lines overlaid for enhanced visualization. Figure 8 illustrates the DDs between C3D predictions and MC simulations, showing that the dose discrepancy remains below 0.08 across all datasets, indicating stable and consistent predictions. Table 3 quantifies the Dice coefficients for the different models and provides 95% confidence intervals for C3D predictions. C3D outperforms the other models across all anatomical sites, particularly in the shin (0.9684 ± 0.0113) and shoulder (0.9592 ± 0.0137) datasets, highlighting its robustness. Notably, the C3D-predicted dose distributions appear smoother than those from MC simulations, likely owing to convolution operations reducing local variations, although this does not affect overall accuracy. Furthermore, the head region exhibits the largest dose discrepancies (0.8762 ± 0.0299), potentially because of greater beam entry angle variations and increased tissue heterogeneity. Extreme errors are primarily observed in regions with steep dose gradients. To address these issues, improving data coverage, enhancing spatial resolution, and incorporating uncertainty quantification methods could help strengthen model robustness and improve the clinical applicability of the C3D model.
| Site | U-Net | DCNN | HD U-Net | C3D | 95% CI (C3D) |
|---|---|---|---|---|---|
| Head | 0.6949 ± 0.0528 | 0.8175 ± 0.0371 | 0.9247 ± 0.0276 | 0.8762 ± 0.0299 | (0.9548, 0.9810) |
| Cheek | 0.6261 ± 0.0642 | 0.7215 ± 0.0424 | 0.8643 ± 0.0373 | 0.9554 ± 0.2774 | (0.7105, 1.0383) |
| Chest | 0.6999 ± 0.0781 | 0.8457 ± 0.0255 | 0.9158 ± 0.0255 | 0.9472 ± 0.0133 | (0.9689, 0.9854) |
| Shoulder | 0.7293 ± 0.0425 | 0.8898 ± 0.0281 | 0.9324 ± 0.0122 | 0.9592 ± 0.0137 | (0.9692, 0.9862) |
| Shin | 0.7073 ± 0.0519 | 0.8385 ± 0.0354 | 0.9493 ± 0.0185 | 0.9684 ± 0.0113 | (0.9728, 0.9868) |
| Instep | 0.6571 ± 0.0647 | 0.7699 ± 0.0392 | 0.9325 ± 0.0291 | 0.9518 ± 0.0077 | (0.9729, 0.9825) |
- Abbreviations: CI, confidence interval; DCNN, Deep Convolutional Neural Network.
Typically, the tolerance error criterion for the pass rate in DD analysis is set at 3%, meaning a point is considered to have an acceptable predicted dose if the error is less than 3%. However, in this study, the maximum dose error was set to 1%, 2%, and 3% for DD analysis, and to 1%/1 mm, 2%/2 mm, and 3%/3 mm for Gamma analysis, to impose stricter evaluation standards on the dose prediction results of the C3D model. The results shown in Figure 9 demonstrate good agreement between the dose distributions predicted by the C3D model and those obtained from MC simulations for both DD and Gamma analyses. As the maximum tolerance is reduced from 3% to 2% and then to 1% for DD, and from 3%/3 mm to 2%/2 mm and then to 1%/1 mm for Gamma, both the DD and Gamma pass rates decrease, reflecting the accuracy of the model under increasingly stringent conditions.
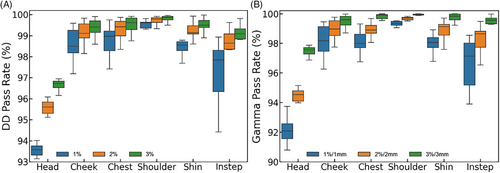
In particular, when the maximum tolerance is set to a stringent 1%, the pass rate for the head reaches 93.58 ± 0.21%, whereas the Gamma pass rate drops to 92.09 ± 0.51%. Similarly, under the 1% tolerance for DD and 1%/1 mm for Gamma, the pass rates for the different body sites are as follows: cheek (DD: 98.49 ± 0.53%, Gamma: 98.18 ± 0.84%), chest (DD: 98.97 ± 0.47%, Gamma: 97.99 ± 0.46%), shoulder (DD: 99.61 ± 0.14%, Gamma: 99.35 ± 0.13%), shin (DD: 98.56 ± 0.21%, Gamma: 97.14 ± 0.88%), and instep (DD: 97.85 ± 0.98%, Gamma: 98.06 ± 0.34%). Overall, both DD and Gamma pass rates remain very high across all sites, with the lowest rates observed for the head, likely owing to the inclusion of varied incident electron beam angles. The performance of the model does not indicate overfitting, as evidenced by the consistent and accurate dose predictions across different tolerance levels.
4 DISCUSSION
To assess the reliability and generalizability of dose prediction, this study incorporated varying maximum dose tolerances across different test datasets. These datasets included phantoms with unknown beam entry positions, angles, surface shapes, and thicknesses. Under the stringent 1%/1 mm tolerance, the C3D model demonstrated the highest accuracy in the chest (DD: 98.97 ± 0.47%, Gamma: 97.99 ± 0.46%) and shoulder (DD: 99.61 ± 0.14%, Gamma: 99.35 ± 0.13%) regions, likely because of their relatively uniform surface contours and consistent tissue composition. In contrast, lower pass rates were observed in the head (DD: 93.58 ± 0.21%, Gamma: 92.09 ± 0.51%) and instep (DD: 97.85 ± 0.98%, Gamma: 98.0 ± 0.34%) datasets. These discrepancies can be attributed to the complexity of anatomical structures, irregular surface geometries, and significant angular variability, all of which contribute to greater prediction errors.
Notably, dose discrepancies exceeding 10% were primarily observed in the head and instep regions. In the head, substantial dose variations were associated with the wide range of beam incidence angles and heterogeneous tissue properties. In the instep, irregular surface geometry and thinner tissue layers posed challenges that led to inconsistent dose distributions. These findings highlight areas for future improvement, such as incorporating additional training data from anatomically complex regions and refining the model to account for angular-dependent variations in dose deposition. Despite these challenges, the consistently high DD and Gamma pass rates across all anatomical sites confirm the robustness of the C3D model, with no evidence of overfitting, demonstrating its generalizability across varying conditions.
In terms of computational efficiency, Table 4 compares the training time, memory usage, and inference speed of different deep learning models, including U-Net, DCNN, HD U-Net, and C3D. All models were trained on two A800 GPUs with a total of 160 GB of memory. The C3D model required approximately 63 hours for 120,000 iterations, similar to the 60 hours needed for HD U-Net, but C3D outperformed HD U-Net in terms of prediction accuracy. In comparison, U-Net and DCNN, which utilize 2D convolutions, required less memory and training time, with U-Net taking 30 hours and DCNN taking 37 hours. Although U-Net and DCNN excel in training efficiency, the use of 3D convolution in C3D is crucial for achieving accurate dose predictions in anatomically complex regions.
| Model | Batch size | Memory | Iterations | Training time |
|---|---|---|---|---|
| U-Net | 512 | 160 GB | 80,000 | ∼30 h |
| DCNN | 512 | 160 GB | 60,000 | ∼37 h |
| HD U-Net | 32 | 160 GB | 120,000 | ∼60 h |
| C3D | 32 | 160 GB | 120,000 | ∼63 h |
| Model | Time per prediction (s) | Relative speed |
|---|---|---|
| DOSXYZnrc (1 CPU) C3D (1 GPU) |
6.22 × 10⁴ 0.42 |
1 1.48 × 10⁵ |
- Abbreviations: CPU, central processing unit; DCNN, Deep Convolutional Neural Network; GPU, graphical processing unit.
Compared with the standard MC simulation using DOSXYZnrc, which takes approximately 17 hours with 1 × 10⁹ particle histories, the C3D model significantly reduces prediction time to just 0.42 seconds, making it roughly 148,000 times faster. Although methods such as increasing central processing unit threads or using GPUs for parallel computing can accelerate MC simulations—as demonstrated in fast dose calculation techniques27, 28—MC simulations still require several seconds to hundreds of seconds for dose calculations. Traditional MC methods can benefit from techniques like variance reduction or hybrid MC–deep learning approaches, which have been shown to enhance performance in specific contexts. GPU-accelerated MC codes can achieve up to 300-fold faster computation compared with central processing unit-based simulations, as reported by Lee et al.29 However, the C3D model offers a more robust and generalizable speed advantage, completing predictions in under one second. This rapid prediction capability is crucial for real-time dose distribution generation in superficial skin treatments, enabling faster treatment plan adjustments and improving clinical workflow efficiency.
At the outset of designing the C3D model, we initially considered enhancing its performance by adding residual networks and attention modules to the 3D U-Net architecture. However, for tasks such as dose prediction, the goal was to adopt a concise and symmetrical model structure. Notable examples include the winners of the OpenKPB Challenge,30 who achieved top performance using only a cascade of two 3D U-Net models.31 This suggests that selecting concise and efficient architectures can also yield excellent dose prediction results. Another advantage of such a design is better adaptation to practical application needs while avoiding unnecessary complexity and computational burden. Following this approach, the present study adopted a cascaded 3D U-Net model to interpret correlations between adjacent 2D slices and capture additional spatial information. Nevertheless, learning around regions with significant jumps in medium density presents challenges for the C3D model. As shown in Figure 7, relatively large dose discrepancies occur in superficial regions located at the interface between air and tissue. Most primary electrons do not interact significantly until they reach the skin surface; upon entry into the skin, they begin interacting with tissue and depositing energy. This transition from air to skin, characterized by a sudden change in medium density, complicates the learning process of the C3D model.
With the growing interest in FLASH radiotherapy (FLASH-RT) research,32, 33 our treatment equipment will support two dose rate modes: conventional radiotherapy (0.1 Gy/s) and FLASH-RT (40 Gy/s). Proton FLASH-RT typically uses pencil beam scanning (PBS) technology,34, 35 which enables precise beam modulation to deliver accurate doses to irregularly shaped tumors. Superficial low-energy electron beam radiotherapy could also benefit from PBS applications. The MC approach for PBS involves simulating beams from multiple angles and adjusting for phantom surface irregularities, but this process is time-consuming. By replacing this process with the C3D model, the task is greatly simplified. The C3D model can predict the dose distribution of a single beam within seconds, and once the required dose is determined, these beams can be combined to achieve the target dose plateau, significantly reducing optimization time. After training, the model can be directly applied to new cases without the need for retraining, thus enhancing efficiency and ensuring consistent, reliable dose delivery.
An additional extension could involve integrating 3D optical scanning technology.36, 37 Skinner et al.5 demonstrated that 3D cameras can accurately capture irregular body surfaces for precise electron beam dosimetry, offering a cost-effective alternative to CT scans. Although this study relied on CT-derived models, 3D optical scanning could provide a more convenient and affordable method, particularly for superficial treatments. Incorporating 3D scan data into the training set could further enhance the performance of the model and broaden its applicability.
For skin lesions, the C3D model can initially provide beam positions based on outlined regions and target doses. However, future research should aim to extend single-beam dose predictions to multi-beam predictions through mathematical optimization. By applying techniques such as gradient-based methods to optimize individual beam doses, the overall dose distribution can be improved. Multi-beam techniques are essential for achieving optimal dose coverage while minimizing damage to surrounding healthy tissues. This expansion will further advance the use of low-energy electron beam FLASH-RT in superficial treatments. Moreover, we plan to integrate Gradient-weighted Class Activation Mapping (Grad-CAM)38 into the model to enhance the interpretability of its predictions. Grad-CAM will highlight the regions of the dose distribution that most influence the predictions of the model, particularly in areas with high uncertainty or anatomical complexity.
Because the model has the potential to significantly influence treatment decisions, it must undergo rigorous regulatory approval to ensure its safety and efficacy. To establish its reliability and effectiveness in real-world clinical applications, the model must consistently demonstrate high accuracy and stability across diverse datasets, while also proving its practical value in complex clinical environments. By meeting these benchmarks, the model could enhance treatment precision and improve patient outcomes, ultimately contributing to more effective and reliable superficial radiotherapy.
5 CONCLUSION
This study proposes a cascaded 3D U-Net model trained on data simulated by DOSXYZnrc, designed to rapidly and accurately predict the 3D dose distribution within a phantom. The results demonstrate that the model can predict dose distributions in just 0.42 seconds, achieving a minimum Gamma pass rate of 92.09% and a minimum DD pass rate of 93.58%. Consequently, the C3D model can serve as a fast and precise dose calculation engine for low-energy electron beam radiotherapy, making it particularly suitable for applications such as superficial tumor and scar treatments, where rapid dose computation is essential.
AUTHOR CONTRIBUTIONS
YB, JZ, YC, and YH designed the study, collected the data, and wrote the manuscript. ZT provided all treatment information for the patients, performed the statistical analysis, and contributed to manuscript writing. JH designed the study, collected and summarized the patient data, performed the statistical analysis, developed the algorithms, and wrote the first draft of the manuscript. SH, ML, TN, and YY participated in data collection, contributed to data analysis and discussion, and reviewed the manuscript. All authors approved the final version of the manuscript.
ACKNOWLEDGMENTS
This work was supported by the High-Performance Computing Public Platform (Shenzhen Campus) of the Guangdong Provincial Key Laboratory of Advanced Particle Detection Technology (2024B1212010005), and the Guangdong Provincial Key Laboratory of Gamma-Gamma Collider and Its Comprehensive Applications (2024KSYS001), the National Key Program for S&T Research and Development (2023YFA1607200), the Medical Scientific Research Foundation of Guangdong Province, China (A2021242), and the Science and Technology Planning Project of Shenzhen, China (JCYJ20190813153403633).
CONFLICT OF INTERESTS STATEMENT
The authors declare no competing interests. Ethical Statement: Not applicable.
ETHICS APPROVAL AND CONSENT TO PARTICIPATE
This study was approved by the institutional review board of the National Cancer Center/National Clinical Research Center for Cancer/Cancer Hospital & Shenzhen Hospital. All methods were carried out in accordance with relevant guidelines and regulations.
CONSENT FOR PUBLICATION
Consent for the publication of data was obtained from all patients. All patients included in this study were over 18 years of age.
Open Research
DATA AVAILABILITY STATEMENT
The datasets used during the current study are available from the corresponding author upon reasonable request.


