Activation of Adenosine Phosphate Signaling Promotes Antitumor Immunity in Tumor Microenvironment and Facilitate Immunotherapy
Yantao Xu and Ying Wang contributed equally.
ABSTRACT
Adenosine 5′-triphosphate (ATP) plays a crucial role in intracellular energetic metabolism and functions as a signal transducer in shaping the tumor microenvironment (TME). However, the understanding of the biological functions of adenosine phosphate signaling and its clinical relevance remains limited. Here, we deciphered the multi-omics dysregulation of 15 purinergic P2 receptors (P2Rs) and their clinical relevance. We revealed the presence of 5 ATP signaling subtypes in melanoma, with two distinct functional metaprograms—one metabolic and the other inflammatory. We developed an adenosine phosphate signaling model (APsig) that showed promising prognostic value in melanoma, as well as predictive efficacy of immunotherapy across 1068 tumor samples in 9 independent public cohorts. High APsig was associated with longer overall survival (OS) and improved response to tumor immunotherapy. Additionally, through single-cell and spatial transcriptomic analysis, we explored how APsig promotes antitumor immunity by activating myeloid lineage cells for antigen presentation. Our comprehensive characterization of P2R-mediated adenosine phosphate signaling at both bulk/single-cell and spatial transcriptomic levels highlights its potential as a promising target for developing novel anticancer agents, particularly in combination with immune checkpoint inhibitors.
Graphical Abstract
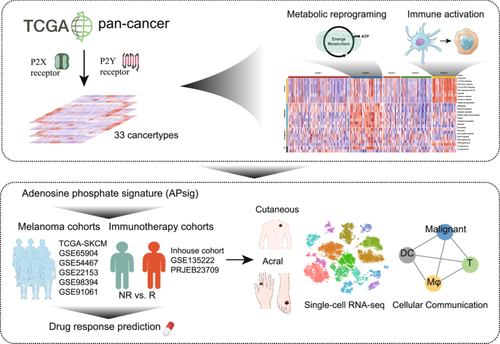
A comprehensive analysis of the purinergic signaling mediated by P2 receptors (P2Rs) was conducted at both bulk, single-cell, and spatial transcriptomic levels, evaluating the prognostic and predictive value of the adenosine signaling pathway in cancer immunotherapy. The results underscore the potential of targeting purinergic P2 signaling in the development of novel anticancer therapies, particularly in combination with immune checkpoint inhibitors.
1 Introduction
Malignant melanoma, recognized as one of the most life-threatening and aggressive forms of skin cancer globally, imposes a significant disease burden on affected individuals and healthcare systems worldwide [1-6]. In the past 30 years, the standardized morbidity of malignant melanoma has significantly increased. Meanwhile, the mortality of melanoma is descending, which may be due to the development and application of multiple approaches, such as targeted therapy and immunotherapy [2, 7, 8]. However, there is only a minority of patients who respond to the therapies or avoid resistance and who lack robust and highly accurate predictive biomarkers [9-11]. The ambiguousness is possibly introduced because of the heterogeneity in the tumor ecosystem [12], characterized by diverse metabolic reprogramming and various characteristics of tumor microenvironment (TME) [13-17], which is urgently awaiting to be deciphered.
Adenosine 5′-triphosphate (ATP), the most significant molecular in energetic metabolism, can progressively be secreted/released into the extracellular milieu via exocytosis, membrane channels, and cell death (i.e., immunogenic cell death and apoptotic) [18-24]. In most instances, the efflux of ATP is the consequence of cancer cells responding to stress, including hypoxia, inflammatory signals, and exposure to therapeutics [25-27]. Extracellular purinergic signaling components—particularly ATP, adenosine diphosphate (ADP), adenosine monophosphate (AMP), and their catabolite adenosine—orchestrate the balance between immunostimulatory and immunosuppressive forces within the TME [28-30]. Extracellular ATP transducted signaling operates in dual character through different P2 receptors (P2Rs), either as immunostimulators mediating myeloid cells chemotaxis and cytokines secretion or as direct tumorigenic factor promoting tumor extravasation and metastatic dissemination [23, 31-35]. However, studies thus far have either mainly focused on the metabolites and adenosine signaling (i.e., extracellular ectonucleotidases and adenosine receptors) or investigated only a single or few P2R in mouse models [28, 29]. The lack of elucidation in adenosine phosphate signaling, especially ATP signaling derived by P2R, hindered the development of therapeutic strategies to target purinergic signaling in preclinical studies [28].
Here, we comprehensively analyzed the 15 P2Rs and their clinical relevance to decipher the multi-omics dysregulation of adenosine phosphate signaling across cancer types. We revealed 5 adenosine phosphate signaling subtypes in melanoma and highlighted 2 mutually exclusive metaprograms with distinct metabolic and inflammatory functions. Furthermore, we generated an adenosine phosphate signaling for ATP and ADP transducted signaling evaluation with promising prognosis effects in malignant melanoma and predictive effect in immunotherapy and validated in 9 independent public cohorts. Moreover, we interrogated the possible mechanism by which adenosine phosphate signaling promotes antitumor immunity by activating myeloid lineage cells antigen presentation at single-cell resolution and spatial transcriptomic level in public skin cutaneous melanoma (SKCM) datasets and our in-house acral melanoma samples. Together, our study evaluated the P2R conducted adenosine phosphate signaling in bulk/single-cell and spatial transcriptome. We highlighted the potential of altering ATP/ADP signaling in the development of novel biomarkers and antitumor agents, especially in combination with cancer immunotherapy.
2 Result
2.1 Multi-Omics Deciphering Revealed the Transcriptomic Dysregulation, Clinical Relevance, and Functional Characterization of P2R
The schema of the study is shown in the Graphical Abstract image. To determine the dysregulation of adenosine phosphate signaling in tumors generally, we first obtained 15 P2R genes (Table S1), which conducted the extracellular adenosine phosphate signaling, from a comprehensive literature review [28, 29]. The signal transduction function of P2R and the differential expression of each P2R gene in tumor samples compared with adjunct normal samples are shown in Figure 1A,B. A massive transcriptional alteration of P2R genes was exhibited in cancers. The most upregulated P2Rs in the majority of tumors included P2X4R, P2X5R, P2Y6R, and P2Y11R, while P2RY14, P2RX6, and P2RX1 were mostly overexpressed in normal tissues. Moreover, the genetic and epigenetic level deciphering is shown in Figure S1. The pan-cancer single-cell analysis reveals that P2Rs exhibit relatively consistent intercellular expression patterns (Figure S2), particularly P2RY12, P2RY13, and P2RY14, which are notably more highly expressed in myeloid cells compared to other cell types. We examined the promoter methylation levels of P2R genes across cancer types (Figure S1A). We observed that methylation levels of P2R genes varied largely, with nearly all genes negatively correlated with methylation level (Figure S1A,B). We further observed that the mutation frequency of adenosine phosphate signaling genes is relatively low, with fewer than 10 mutations for nearly all cancer types (Figure S1C,D). The results indicated the limited contribution of mutation and methylation in transcriptional alteration of P2R.
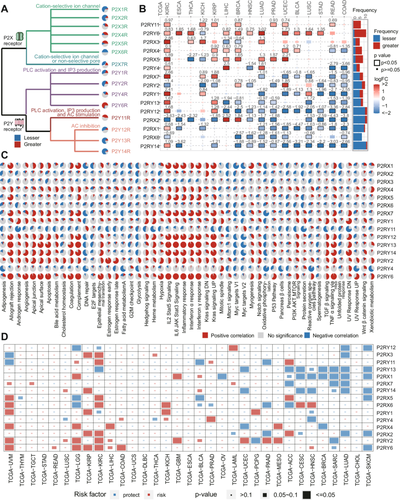
To further understand the biological capabilities of P2R conducted adenosine phosphate signaling in multisteps of oncogenesis, we examined the association between P2R expression and the activation of 50 cancer hallmarks (Figure 1C and Table S2) [36]. Interestingly, several purinergic receptors exhibited similar roles in cancer. In detail, P2RX1, P2RX5, P2RX7, P2RY6, P2RY12, P2RY13, and P2RY14 appear a rather instinctual inflammatory pattern such as the activation of inflammatory response hallmark, interleukin (IL) signaling, tumor necrosis factor-α (TNF-α) signaling, and interferon (IFN) response in the majority of cancer types. Therefore, we investigated the immune indices and found a similar pattern of inflammation exhibited in immune cell infiltration and activation of immune checkpoints (Figure S3A,B), suggesting the antitumor immune potential by activating these specific receptors.
The various patterns of biological capabilities have been partially reflected in their clinical relevance (Figure 1D, Cox regression, log-likelihood p value < 0.05). P2R genes can be demonstrated as either a risk or a protective factor in diverse cancer types, implying the effects of tumor context. As we expected, P2RY13, P2RY14, P2RX7, and P2RX1 show the most promising protective effect in multiple cancer types. The current study aligns with existing results by highlighting the active role that the P2X7R receptor plays in tumor progression [30]. Interestingly, SKCM and lung adenocarcinoma show the most significantly protective roles associated with P2R genes (Figure S3C), especially corresponding with the inflammatory patterns of biological capabilities we previously observed in Figure 1C. However, the prognostic effect in SKCM and uveal melanoma (UVM) displayed extreme differences. Despite their common origin, the phenomenon might be introduced by various genetic alterations, metastasis, and microenvironment characteristics [37-39].
2.2 Adenosine Phosphate Signaling Distinguished TME Subtypes With Two Mutually Exclusive Metabolic and Inflammatory Metaprograms in Malignant Melanoma
SKCM is one of the most aggressive and therapy-resistant human cancers [1]. Identifying its complex TME interactions has been challenging [15]. Here, to explore the existence of distinguished subtypes reflecting the divergent adenosine phosphate signaling transduction among malignant melanoma patients, we applied the nonnegative matrix factorization (NMF) on 453 SKCM patients based on the expression of P2R genes (Figure 2A and Table S3). Five clusters were generated according to the largest cophenetic correlation coefficient with each subtype characterized by divergent adenosine phosphate features (Cluster 1: 172 patents, high expressing P2RX7; Cluster 2: 86 patients, high expressing P2RX4; Cluster 3: 49 patients, high expressing P2RX6; Cluster 4: 80 patients, high expressing P2RY1 and P2RY11; Cluster 5: 66 patients, high expressing P2RX1, P2RX2, P2RX5, P2RY6, P2RY12, P2RY13, and P2RY14). Patients in Cluster 5 exhibited the best overall survival (OS), and patients in Cluster 2 showed worse OS compared with others, while Clusters 1, 3, and 4 showed no difference in the Kaplan–Meier curve (Figure 2B, log-rank test, p = 5.6 × 10⁻⁵).
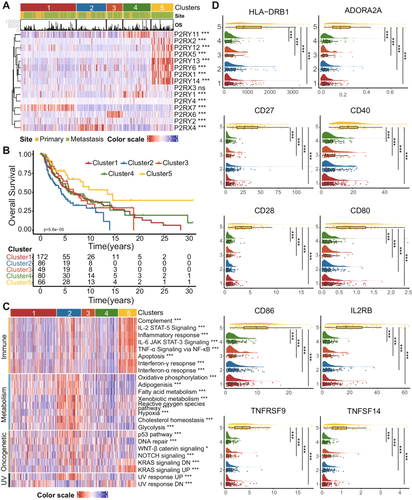
We next investigated the cancer functional archetypes of Subtypes 2 and 5 to decipher the potential mechanism of distinct clinical outcomes (Figure 2C and Table S4). Subtype 5 was highly associated with immune-related cancer hallmarks, including Inflammatory response, IL-2, IL-6, and TNF-α signaling, complements, IFN-α and γ response. Interestingly, the apoptosis process was highlighted in Subtype 5, which was possibly explained as apoptotic cells initiating immune response by expelling ATP as a mediator of the “find-me” signal [23]. Subtype 2 was possibly remarked as a tumor milieu undergoing massive metabolic reprogramming because of the enrichment of metabolic pathways and hypoxia. Furthermore, Subtype 2 was also associated with several oncogenesis-related pathways, including p53, WNT-β, NOTCH, and deoxyribonucleic acid (DNA) repair. Interestingly, the upregulated ultraviolet (UV) response was highly associated with Subtype 2, which further indicated Subtype 2 might be associated with the biological process of tumor genesis since the UV radiation in sunlight has been identified as a primary factor in the development of malignant melanoma in lightly pigmented populations [40].
For further explanation of the immune-related archetypes in Subtype 5, we conducted a single-sample gene set enrichment analysis (ssGSEA) algorithm to calculate the 28 types of immune cell infiltration. Subtype 5 showed enhanced immune cell infiltration compared with others (Figure S4A). The result further demonstrated the inflammatory pattern of the subtype. To further investigate the molecular foundation of immune activation in Subtype 5, we further assessed the expression of active immune checkpoints in 5 adenosine phosphate subtypes. The checkpoints related to antigen-presenting (i.e., human leukocyte antigen (HLA)-DRB1), macrophage/monocyte immune function (i.e., a cluster of differentiation (CD) 80 and CD86), and B linage (i.e., CD27, CD28, and CD40) were significantly overexpressed in Subtype 5. ADORA2A, one of the adenosine receptors, was also upregulated in Subtype 5, which might be explained as the activation of adenosine signaling downstream by ATP (Figure 2D). Together, the results demonstrated that various adenosine phosphate signaling subtypes with mutually exclusive archetypes representing metabolic reprogramming process and inflammatory patterns exist in SKCM, and Subtype 5 can be annotated as the archetype related to inflammatory procedure and immune activation, further explaining why this subtype obtained the best survival.
2.3 Adenosine Phosphate Signatures Act as a Prognostic Factor in Cutaneous Melanoma
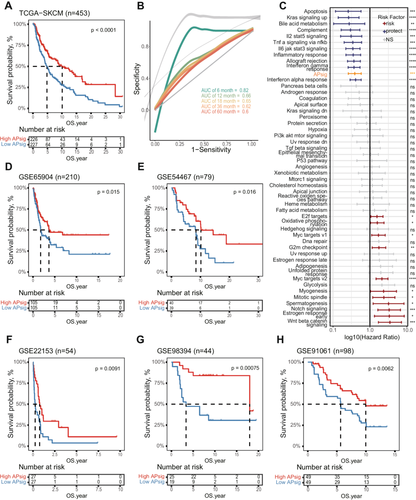
Herein, to reflect the various characteristics of adenosine phosphate signaling, we generated the adenosine phosphate signaling model (APsig) for representing the features of Subtype 5 (see “Methods”). Notably, the APsig showed a robust prognostic value in distinguishing the survival status of malignant melanoma patients from The Cancer Atlas skin cutaneous melanoma (TCGA-SKCM) and 5 independent cohorts (Figures 3A and 3D–H). The high APsig groups tend to have longer survival times. More importantly, receiver operating characteristic (ROC) curves analysis exhibited promising results that most of the area under the dose–response curve (AUC) values of the APsig in training and test sets were acceptable with 6-month AUC greater than 0.75 (Figures 3B and S4B–F). Compared with other previously defined cancer hallmarks, APsig shows significant prognostic value in malignant melanoma along with several classic immune-related cancer hallmarks, including inflammatory response, IFN-γ response, and allograft rejection (Figure 3C). Together, our results provided evidence that APsig can be regarded as a promising prognostic predictor in SKCM.
2.4 Adenosine Phosphate Signatures Exhibit the Immune Activation Character in Cutaneous Melanoma
We next sought to explore the potential association of adenosine phosphate signaling with cancerogenesis and immune activation across 11 melanoma datasets (Table S5). Here, we observed a high association between APsig and multiple anticancer hallmarks, including the allograft rejection, the complement, the IL2-STAT5 signaling, the IL6-JAK-STAT3 signaling, the inflammatory response, and IFN-α and γ response, by performing Spearman's rank correlation (Figures 4A and S5A). On the contrary, several hallmarks were negatively correlated with APsig, including the unfolded protein response, protein secretion, MYC targets, and DNA repair (Figures 4A and S5A). Moreover, APsig has positively correlated with both stimulatory (i.e., CD200R1, CD27, TNFRSF4, and TNFRSF9) and inhibitory (i.e., CTLA4, CD274, and LAG3) immune checkpoints (Figures 4B and S5B). The globally positive association with immune checkpoints may indicate the potential therapeutic benefit of applying immune checkpoint blockades. For immune cell infiltration abundance, we observed a bunch of activated effector cells, including CD8+ T cells, M1 macrophages, activated CD4+ memory T cells, γδ T cells, and memory B cells, were significantly positively correlated with the APsig across multiple melanoma patients, while resting natural killer (NK) cells, M0 macrophages, and M2 macrophages were significantly negatively correlated with APsig (Figures 4C and S5C).
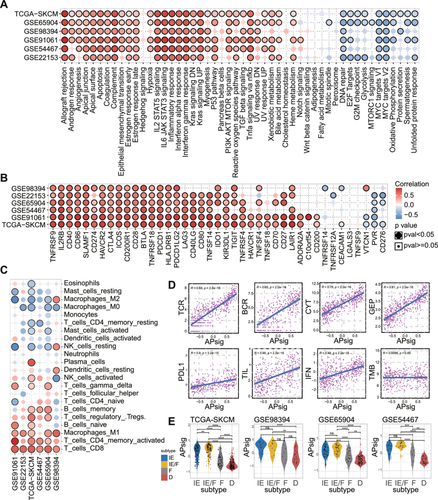
We further investigated the correlation between APsig and several pan-immune features (Figure 4D). We observed the high association that APsig is positively correlated with the richness of T cell receptor (TCR) and B cell receptor (BCR), which showed the association between adenosine phosphate signature and T/B cell diversity. Moreover, APsig was associated with cytolytic activity (CYT) and T cell-inflamed gene expression profile (GEP), which are two well-known cytotoxic indicators and immunotherapy predictors. Also, IFN, tumor-infiltrating lymphocytes (TIL), and programmed death-ligand 1 (PD-L1) expression are mildly associated with APsig, while tumor mutation burden (TMB) is not associated with APsig, which probably foreshadowed that APsig is mainly affected in nonmalignant cells in TME as well as provided an independent prediction power. In general, the association between APsig and pan-immune features is positive, which indicates an immune-activated TME. Moreover, we estimate consistency between our APsig and previously reported 4 robust TME subtypes (“immune-depleted” (D); “fibrotic” (F); “immune-enriched, nonfibrotic” (IE); and “immune-enriched, fibrotic” (IE/F)), which are conserved and are able to predict immune therapy response (Figures 4E and S5D–H) [41]. We observed that APsig in immune-enriched, nonfibrotic (IE) and immune-enriched, fibrotic (IE/F) subtypes are significantly higher than others in multiple datasets. In summary, these results indicated that the higher APsig tumors are presented as “hot-tumor” with an inflamed TME status and the patients are more likely to obtain a better response to immune checkpoint blockades.
2.5 Potential Therapeutic Effects of Adenosine Phosphate Signaling in Immunotherapy and Target Therapy
Patients who exhibit the “hot-tumor” TME or were turned from “cold” to “hot” by certain interventions have been proven to obtain better responses to immunotherapy [42, 43]. To extend our findings to clinical practice and validate the hypothesis of high APsig representing “hot-tumor” and benefit on immunotherapy, we evaluated the value of APsig in predicting the response to anti-programmed cell death protein-1 (PD-1)/PD-L1 therapy in 3 cohorts [44-46]. In the high APsig group, the proportion of patients with a response (complete response, CR, and partial response, PR) was significantly higher compared with the low APsig group (Figure 5A, χ2 test p = 0.08, Figure 5B, χ2 test p = 0.03; Figure 5C, χ2 test p = 0.02). We observed that patients with higher APsig are associated with better survival in 3 independent immunotherapy cohorts (Figure 5D, log-rank test, p = 0.021; Figure 5E, log-rank test, p = 0.0055; Figure 5F, log-rank test, p = 0.031). For predicting immunotherapy response, ROC curves were generated and AUC curves were calculated in these datasets. The AUC of APsig showed an acceptable value from 0.66 to 0.80 in various datasets. Furthermore, compared to other immune therapy predictors, T cell–inflamed GEP and CYT, the predictive ability of APsig is on par with both of these indicators (Figure S6). Together, APsig was supposed to be regarded as a promising efficacy predictor in patients treated with immune checkpoint blockades.
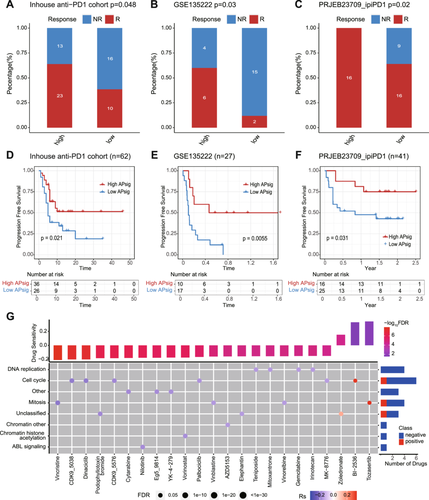
To further investigate the therapeutic utility as a therapeutic biomarker of APsig, we evaluated the correlation between APsig and drug sensitivity from the Genomics of Drug Sensitivity in Cancer (GDSC) database in multiple cancer types [47]. In total, 23 drug sensitivity pairs exhibit significant associations with APsig (Figure 5G). Interestingly, APsig was negatively associated with a few classic chemotherapeutic agents, including vincristine, vinblastine, vinorelbine, cytarabine, gemcitabine, vorinosta, palbociclib, dinaciclib, podophyllotoxin bromide, teniposide, mitoxantrone, irinotecan, and nilotinib. APsig is also negatively associated with other preclinical drugs, including cyclin-dependent kinase (CDK) inhibitor CDK9_5038, CDK9_5576, CHK inhibitor MK-8776, mitosis inhibitor Eg5_9814, Apoptosis inducers YK-4-279, and BET inhibitor AZD5153. In the high APsig group, there are also several drugs with high sensitivity, including PLK1 inhibitor BI-2536, aurora inhibitor tozasertib (VX-680), and bisphosphonate zoledronate. The result shows that higher APsig was significantly associated with clinical benefit in immune checkpoint blockades and positively associated with chemotherapy sensitivity. In conclusion, the APsig could be regarded as an immunotherapy biomarker as well as guide the usage of chemotherapy, which facilitates clinical practice.
2.6 Resolving Adenosine Phosphate Signaling in Single-Cell and Spatial Transcriptome
Single-cell RNA sequencing (scRNA-seq) provided a much more comprehensive landscape for deconstructing TME and resolving tumor ecosystems compared with bulk RNA sequencing (RNA-seq) [48-52]. Here, we collected two public SKCM single-cell datasets along with our in-house acral melanoma dataset for single-cell resolution profiling. We first annotated the GSE115978 dataset into 10 cell types (Figure 6A) [53]. We found the obvious cell types specific distribution that APsig was highest in monocytes and B cells and generally low in malignant cells and fibroblasts (Figure 6B,C and Table S6). Specifically, genes consisting in APsig, including P2RY6, P2RY11, P2RY12, P2RY13, and P2RY14, were high-expressed in monocytes (Figures 6D and S8A). A similar result has been validated in another independent scRNA-seq dataset (GSE72056, Figures S7A–D and S8B). Acral melanoma is a distinct subtype of melanoma on acral skin, which exhibits different gene expression patterns and has worse survival than other cutaneous melanomas [54-56]. Herein, we further investigated the APsig distribution and P2R gene expression patterns in our in-house acral melanoma dataset. Similarly, high APsig in the acral melanoma dataset appeared in myeloid lineage, including M1 and M2 macrophages, conventional dendritic cell type 1 (cDC1), conventional dendritic cell type 2 (cDC2), Langerhans cells, plasmacytoid dendritic cells (pDC), and B lineage cells (Figure 6E–G), while the highest value cell type is pDCs (although with extremely small population), followed by cDC1 and cDC2, which vary from SKCM. P2RY6, P2RY11, P2RY12, P2RY13, and P2RY14 were also highly expressed in DCs and macrophages (Figures 6H and S8C). The result shows that APsig has mild cell types specific to SKCM and acral melanoma, especially in myeloid lineages.
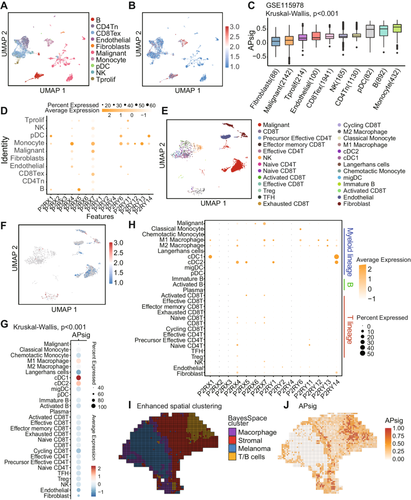
To further decipher the functional differences caused by adenosine phosphate signaling, we investigated the pathway deviation in skin cutaneous and acral melanoma datasets. Comparing high APsig to low APsig group, several pathways from the Kyoto Encyclopedia of Genes and Genomes (KEGG) [57] database involved in the immune process were significantly enriched in all skin cutaneous and acral melanoma datasets, including allograft rejection, antigen processing and presentation, complement and coagulation cascades, T helper type 1 (Th1) and T helper type 2 (Th2) cell differentiation, T helper type 2 (Th17) cell differentiation, Toll−like receptor signaling pathway, chemokine signaling pathway, phagosome, lysosome, apoptosis, and so on (Figures S9A,B and S10A). The comparison of high and low APSig using GSEA showed significant enrichment of Immune function (i.e., immune system, innate immune system, adaptive immune system, and major histocompatibility complex (MHC) class II antigen presentation) and inflammatory response (i.e., IFN and IFN-γ signaling, neutrophil degranulation and G protein-coupled receptor (GPCR) ligand binding) while activating signaling (Figures S9C and S11). A similar result has also been shown in our in-house acral melanoma dataset (Figure S10B), which exhibits the significant activation of IFN, cytokines, and GPCR signaling.
Spatial transcriptomic enabled us the decipher the principles and mechanisms by which gene activity orchestrates complex cellular arrangements of tissue, especially in cancer microenvironment [58]. Applying Bayesian inference, we enhanced the resolution of spatial transcriptomic assignment for more elaborate spatial clustering (Figure 6I) [59]. We performed spatial domain annotation on a melanoma transcriptomic dataset, identifying four distinct cellular niches: macrophage aggregate region, stromal cell aggregate region, malignant cell aggregate region, and T/B cell aggregate region [13]. We observed that the APsig was higher in the boundary of macrophages or T/B cell area and stromal cells (Figure 6J). Our analyses revealed cell-type-specific purinergic signaling heterogeneity across cellular populations, with single-cell resolution and spatial mapping delineating distinct intercellular communication patterns.
2.7 Deciphering Intercellular Communications Variation of Macrophages Affected by Adenosine Phosphate Signaling
Using CellChat, we are able to infer the intercellular communication of TME [60]. In this case, we first scanned the total incoming and outgoing cellular interaction strength of each cell type (Figure S12A; left panel: High APsig, right panel: Low APsig). Macrophages/monocytes and endothelials showed higher incoming and outcoming signals, which demonstrated that they may be the most important cell subpopulation affected by adenosine phosphate signaling. For specific signaling, MHC-I and MHC-II occupied the most activated pathways in both High and Low APsig patients. Several immune-related pathways exhibited the difference, such as PD-L1 signaling was stimulated in T cell and macrophage/monocyte in low APsig but was stable in high APsig patients (Figure S12B; right panel: High APsig, left panel: Low APsig).
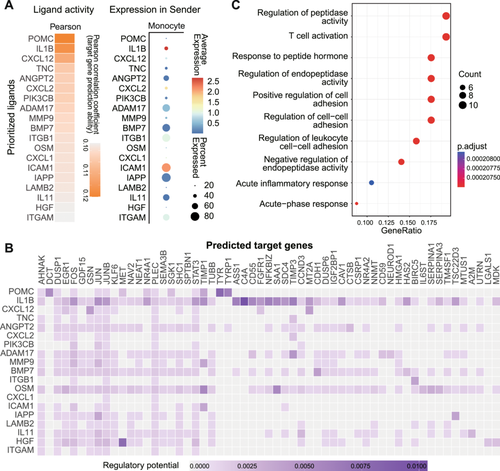
We further determined the significantly differentiated signaling between high and low adenosine phosphate signaling. Overall, in both high and low signaling statuses, the cellular interactions of macrophages/monocytes were navigated to divergent cell types by various ligand–receptor pairs (Figures S13 and S14). In the high APsig group, the upregulated signalings were mainly recognized as antigen presentation. Several interactions including MHC-I molecular to CD8 (i.e., HLA-A/B/C-CD8A/B) and MHC-II molecular to CD4 (i.e., HLA-DRA/DRB1/DQA1-CD4) were highlighted, which may indicate the classical antigen presentation process through MHC-II molecular and antigen cross-presentation through MHC-I molecular [61, 62]. In the low APsig group, the most salient signaling was SPP1, which has been previously reported as an immune suppressor in macrophages by interacting with fibroblasts and was associated with tumor progression [63]. To investigate the downstream effect of APSig in macrophage/monocytes, we use Nichenet to identify the possible differential targets of immune cells affected by ligands from high and low APsig (Figure 7A,B). The enrichment of the top 50 target genes (Figure 7C) shows the functional alteration of APSig was mainly associated with activation of immune response (i.e., T cell activation and acute inflammatory response), positive regulating cellular adhesion (i.e., positive regulation of cell adhesion and regulation of cell−cell adhesion), and inhibition of peptidase (i.e., negative regulation of endopeptidase activity, regulation of endopeptidase activity, response to peptide hormone, regulation of peptidase activity, and acute-phase response). Overall, the intercellular communication analysis provided a comprehensive portrait of APSig status regulated TME, with high APsig, through regulating macrophages/monocytes, demonstrated possible antitumor effect by promoting antigen presentation for igniting the immune system and inhibiting protease to counter stress. In low APsig, macrophages/monocytes played a tumor-promoting role through SPP1 molecular.
3 Discussion
Adenosine phosphate occupies the most crucial position in the overall configuration of cellular energy metabolism and signal transduction, which can be regarded as a bridge between intracellular metabolism and extracellular signaling. Intracellular ATP and ADP are rather significant for nearly all components of the TME and are associated with cellular function and prognosis [64, 65]. In this study, we revealed 5 adenosine phosphate signaling subtypes in melanoma and highlighted 2 mutually exclusive metaprograms with distinct metabolic and inflammatory features. Thus, we established a model of adenosine phosphate signaling named APsig. The model exhibits the prognosis capability for skin melanoma and predictive effect in immune checkpoint blockade in both TCGA-SKCM and 8 independent validation datasets, which indicates the great potential of clinical application.
In our analysis, methylation and mutation exhibited a limited role in regulating P2R signaling. Previous studies have shown that overexpression of miR-150 suppresses the expression level of P2X7R and promotes breast cancer proliferation [66]. miR-155 has also been reported to modulate P2R signaling and regulate immune cell accumulation in allergic airway inflammation [67]. Furthermore, proteases also play an irreplaceable role in regulating P2X signaling through metabolic effects in tumors [68, 69]. The results indicated the importance of non-genomic and epigenetic mechanisms in regulating P2Rs.
To elucidate the biological function after the adenosine phosphate signaling, we further investigated the adenosine phosphate signaling transduction in antitumor immunity and TME cellular interaction in bulk and single-cell transcriptomic, covering cutaneous and acral melanoma. We highlighted the adenosine phosphate signaling stimulation in myeloid cells, especially macrophages, and monocytes exhibited much more activated antigen presentation ability in interaction with cytotoxic T lymphocytes (CTLs). These mechanistic explanations provide clues for the further understanding of the ATP and ADP as signaling transductors in TME. Immunotherapies rely on the recognition and elimination of tumor cells by CTLs. These therapies hinge on the activation of endogenous T cells by DCs within the TME and the presentation of tumor antigens by HLA-I molecules expressed on tumor cells [70-72]. Studies have shown that immunogenic tumors often exhibit increased expression of HLA-I genes, with the most effective responses to immunotherapy observed in tumors characterized by elevated expression of HLA-II genes. Conversely, the absence of MHC-I molecules is often associated with poor responsiveness to immunotherapy [70, 73]. Furthermore, the presence of HLA-1 and B2M loss of heterozygosity (LOH) and other genetic alterations in nonresponsive patients undergoing ICB treatment suggests a potential role for HLA class I in mediating drug resistance [70, 74]. Interestingly, ATP signaling demonstrates various prognostic values across SKCM and UVM. Its differential performance may stem from distinct ATP signaling engagements. SKCM prevalent BRAF mutations could enhance the MAPK pathway [75] and may lead to elevated sensitivity extracellular ATP through P2X7 receptor upregulation, whereas UVM characteristic GNAQ/GNA11 mutation has a different effect. This genetic divergence suggests future models could benefit from mutation-specific weighting of ATP signaling.
So far, despite several studies developed signatures to characterize the purinergic signaling in the TME, the signatures all focused on the downstream molecular of adenosine-activated purinergic P1 signaling (including “AdenoSig” [76] and “Adenosine Signaling Score” [77] for A2AR). To bridge the gap, we developed the APsig to characterize the adenosine phosphate (i.e., ATP and ADP) mediated signal transduction and purinergic P2 signaling. To our knowledge, our model is the very first work to portray the adenosine phosphate signaling status and model the adenosine phosphate signaling for cancer prognosis and therapeutic prediction, which firstly provided an integrated deciphering and comprehensively demonstrated the therapeutic potentiality of adenosine phosphate signaling. Due to the strong association that we observed between APsig and tumor immune infiltration and immune activation, as well as its significant role in distinguishing the efficacy of immunotherapy, this suggests that patients with higher APsig may have tumors in a “hot” tumor state, for which immune checkpoint inhibitors may be the most suitable treatment. On the other hand, for patients with lower APsig, the “cold” state of their tumor immune microenvironment may hinder the effective infiltration of effector immune cells, making therapies such as oncolytic viruses and tumor vaccines potentially more appropriate. Recent research has revealed an intriguing relationship between nonalcoholic fatty liver disease (NAFLD) and the activation of P2RY12-dependent release of CD40L. This activation has been shown to enhance antitumor immunity, thereby impeding the development of hepatocellular carcinoma (HCC) and liver tumor metastasis in NAFLD [78]. This study has presented compelling in vivo data, but additional in vivo experiments and clinical evidence are required to definitively corroborate our hypothesis.
On the other hand, we must admit that the study also has some limitations. The levels of extracellular ATP and other adenosine phosphates in the TME are dynamically determined by the mutually opposed inputs of secretion/release versus degradation [28]. This study is unable to characterize the releasement and degradation of adenosine phosphate, which is involved in multiple complicated and unquantifiable procedures such as exocytosis of ATP-containing vesicles [19], gradient-driven efflux via pannexin channel [79] and P2X7 receptor [80], and ectonucleotidases catalyzation [81, 82], which would limit the usage of APsig to portrait the total adenosine phosphate metabolism rather than signaling only. The calculation of APsig does not take into account the dynamic balance of ATP release and degradation but merely considers the signal intensity of ATP receptors, which limits its interpretability at the level of extracellular ATP metabolism. Future studies may include comprehensively considering the balance of extracellular ATP generation and degradation, such as CD73 and CD38, as well as applying flux estimation analysis (FEA) to determine the direction of reactions and optimizing the approach by integrating metabolomics data. Moreover, the majority of public datasets lack clinical information, hampering the further validation of the potential associations between APsig and certain clinical variables.
In conclusion, based upon the resolving of adenosine phosphate signaling in genomic, bulk transcriptomic, single-cell transcriptomic, and spatial transcriptomic levels, covering skin cutaneous and acral melanoma, we revealed two mutually exclusive metaprograms with distinguished metabolic and inflammatory features, as well as developed an effective signature (APsig) for assessing the prognosis of melanoma and response to immune checkpoint blockades. In single-cell level cellular interactions, we highlighted the APSig stimulated myeloid cells exhibited activated antigen presentation ability toward CTLs. The APsig is a promising tool for elucidating adenosine phosphate signaling and optimizing the treatment and surveillance for melanoma patients' management.
4 Materials and Methods
4.1 Collection and Processing of Data
The workflow of our study is shown in the Graphical Abstract image. The study systematically uncovered the involvement of P2R in mediating adenosine phosphate signaling through comprehensive analyses at both bulk/single-cell and spatial transcriptomic levels. Subsequently, an APsig was constructed to evaluate the prognostic value of malignant melanoma and the predictive potential of immunotherapy. This model was extensively tested and validated across nine separate cohorts, including both internal and publicly available datasets.
4.1.1 Melanoma Datasets Collection
Data of gene expression, methylation, mutation, and clinical information (i.e., age, gender, stage, tumor-node-metastasis (TNM) stage, and OS) was from TCGA-SKCM samples from TCGA data portal (https://portal.gdc.cancer.gov/). We only used preprocessed expression matrices/profiles and did not include the original sequencing files or individual level genotype data. All data were downloaded from the GDC Data Portal prior to July 29, 2024, with no access or usage restrictions applicable during this period. 5 independent malignant melanoma cohorts (GSE65904 [83], GSE54467 [84], GSE22153 [85], GSE98394 [86], and GSE91061 [87]) were from Gene Expression Omnibus (GEO, https://www.ncbi.nlm.nih.gov/geo/; see Table S5). All accession numbers correspond to fully public datasets without controlled-access requirements (last accessed July 29, 2024).
4.1.2 Immunotherapy Datasets Collection
Three datasets of patients treated with immune checkpoint blockade were collected in the study (Table S7). The Kim cohort [44] (GSE135222, anti-PD-1/PD-L1 therapy in advanced non-small cell lung carcinoma) was obtained from GEO (https://www.ncbi.nlm.nih.gov/geo/). All accession numbers correspond to fully public datasets without controlled-access requirements (last accessed July 29, 2024). The Gide cohort [45] (PRJEB23709: anti-PD-1/anti-cytotoxic T-lymphocyte-associated protein-4 (CTLA-4) combined therapy in malignant melanoma) was obtained from the SRA database (https://www.ncbi.nlm.nih.gov/bioproject/). The data was obtained prior to July 29, 2024, and only preprocessed expression matrices/profiles were used. The He cohort (anti-PD-1 therapy in malignant melanoma) was obtained from the article Supporting file [46].
4.1.3 Single-Cell and Spatial Transcriptome Datasets Collection
Processed GEPs for melanoma were retrieved from TISCH (http://tisch.comp-genomics.org/). SKCM samples GSE115978 [53] (7186 single cells isolated from 33 including malignant, immune, and stromal cells) and GSE72056 [88] (4645 single cells isolated from 19 patients profiling malignant, immune, stromal, and endothelial) were collected. Pan-cancer single-cell datasets were acquired from GEO, Genome Sequence Archive (GSA), and European Molecular Biology Laboratory—European Bioinformatics Institute (EMBL-EBI) with access numbers GSE145281, GSE108989, GSE111360, GSE115077, GSE120575, GSE134520, GSE139829, EMTAB6149, and CRA001160. We obtained and preprocessed the melanoma spatial sample using “BayesSpace” R package [59] (Version 1.16.0) (http://www.bioconductor.org/packages/release/bioc/vignettes/BayesSpace/inst/doc/BayesSpace.html). Only preprocessed expression matrices/profiles were used, and any original sequencing files or individual level genotype data were not included. All data were downloaded prior to July 29, 2024.
4.1.4 In-House Melanoma Cohort
All melanoma specimens were obtained from Xiangya Hospital, Central South University (Ethics Approval No. 202308636), from January 2021 to August 2023, encompassing 62 pretreatment tumor samples from anti-PD-1 treated patients (responders/non-responders' classification). RNA-seq processing involved: adapter trimming of raw reads followed by quality control via FastQC software (Version 0.11.9); genome alignment using HISAT2 software (Version 2.2.1) with GRCh38.p12 reference; transcript assembly via StringTie software (Version 2.2.0); and expression quantification through TPM normalization with log2 transformation. Complementary single-cell sequencing (10× Genomic pipeline) analyzed 5 acral melanoma specimens from 4 patients. All procedures complied with informed consent regulations approved by the institutional ethics committee.
4.1.5 Collection and Evaluation of Adenosine Phosphate Signaling Genes
P2X (n = 7) and P2Y (n = 8) receptor genes conducting adenosine phosphate signaling were collected from a comprehensive literature review (Table S1) [28, 29].
4.1.6 Generation of Adenosine Phosphate Subtypes
The NMF was used to distinguish various adenosine phosphate signaling subtypes in TCGA-SKCM samples. Cophenetic correlation coefficient maximization was used to select the optimal cluster number for subsequent analyses with peaking for k = 5 [89, 90].
4.1.7 Construct Model (APsig) to Represent Adenosine Phosphate Signaling
We performed a differential expression analysis using the R package “DESeq. 2” [91] (Version 1.34.0) between Cluster 5 (the best survival representing the immune activation) and other samples. We defined the representing genes of Cluster 5 as logFC > 0 and FDR < 0.05 within the comparison. The representing genes were identified including P2RX1, P2RX2, P2RX5, P2RY6, P2RY12, P2RY13, and P2RY14. We further calculated the enrichment score (ES) using gene set variation analysis [92] (GSVA) in the R package “GSVA” (Version 4.0.4) as the APsig to represent the Cluster 5 adenosine phosphate signaling:
4.2 Evaluation of Functional Features
4.2.1 GSVA and Pathways Enrichment Analysis
An ES of 50 cancer hallmarks for each tumor sample or cancer cell line was calculated by using GSVA. The gene set “h.all.v6.1.symbols”, “c2.cp.kegg.v6.2” was retrieved from the MSigDB database [93] (http://software.broadinstitute.org/gsea/msigdb/index.jsp). Pathway Enrichment analysis was performed by using R Package “GSVA” (Version 4.0.4) and clusterProfiler [94] (Version 4.0.4).
4.2.2 Calculation of Immune Cell Infiltration Abundance
Tumor infiltration immune cell abundance was measured using CIBERSORT [95] and ssGSEA to quantify the relative abundance of 28 types of immune cells in TME.
4.2.3 Calculation of the Pan-Immune Features
The Pan-Immune features, including the expression level of PD-L1 and IFN, the richness of TCR/BCR, the abundance of TILs, TMB, aneuploidy, homologous repair deficiency (HRD), T cell-inflamed GEP, and CYT level, were available at https://gdc.cancer.gov/about-data/publications/panimmune. GSVA implementation of the Ayers et al. gene signature was employed to compute GEP levels per sample, whereas CYT quantification relied on the geometric mean calculation of two cytolytic markers: GZMA and PRF1.
4.2.4 Calculation of Immune Subtypes
TME subtype information among 8 melanoma datasets was obtained from Bagaev et al. which are able to define immune infiltration status and predict response to immunotherapy [41].
4.2.5 Analysis of Drug Response
AUC and gene expression matrix of cancer cell lines were acquired from GDSC [47] (http://www.cancerrxgene.org/downloads). Imputed drug responses of 138 anticancer drugs in TCGA cancer patients were downloaded from a previous study. To assess drug response in cancer cell lines, we calculated the Spearman correlation between the AUC and gene expression of cancer cell lines from GDSC for drug responsiveness (|Rs | > 0.2; FDR < 0.05). To assess the drug response in TCGA-SKCM tumor samples, we calculated the Spearman correlation between imputed drug data and APsig to assess the drug response of TCGA-SKCM cancer samples in adenosine phosphate signaling status (|Rs | > 0.2; FDR < 0.05).
4.2.6 Single Cell RNA-seq and Spatial Transcriptome Analysis
We used the R package “Seurat” [96] (Version 4.0.4) to perform single-cell transcriptomic analysis for SKCM samples (GSE115978 and GSE72056) and in-house acral melanoma samples [25]. Uniform manifold approximation and projection (UMAP) was used in scRNA-seq for dimension reduction and visualization. Principal component analysis (PCA) was then performed on the top 2000 most highly variable genes (HVGs). APsig in single-cell level were calculated using the algorithm described above.
4.2.7 Cellular Interaction
CellChat [60] (Version 2.1.0) and Nichenet [97] (Version 2.2.0) were used to estimate the cellular interaction. The pseudo-bulk RNA-seq data was generated from GSE115978, and the APsig was calculated. We used the median APsig to divide the high and low groups of signaling. The differential signaling and L–R pairs of each group were filtrated with p < 0.05 and Log2FC > 0.
4.2.8 Survival Analysis
The univariate Cox regression model was used to calculate the hazards ratio (HR). The median of APsig was used to determine the high and low groups in TCGA-SKCM and individual malignant melanoma datasets. The R package “Survminer” (Version 0.5.0) was used to determine the cutoff point of the high and low groups for immunotherapy datasets based on the association between APsig and patient OS. To find the maximum rank statistic and reduce the calculated batch effect, the “surv-cutpoint” function was used to dichotomy APsig, and all potential cutting points were repeatedly tested. Kaplan–Meier comparative survival analyses for prognostic analysis were generated, and the log-rank test was used to determine the significance of the differences.
4.3 Statistical Analysis
The difference in responders' and nonresponders' proportions between the high and low groups was compared using the χ2 test. The association between APsig and cancer hallmarks, immune checkpoints, immune cell abundance (calculated by ssGSEA), and pan-immune features were calculated by Spearman correlation. ROC curve was performed to verify the predictive power of the model. Wilcoxon rank-sum test was used to compare the differences. The p values are indicated in the related figures; *p < 0.05, **p < 0.01, ***p < 0.001, and ns, not significant (p > 0.05). All statistical analysis was two-sided and considered p < 0.05 as statistical significance.
Author Contributions
Yantao Xu: conceptualization (equal), data curation (equal), formal analysis (equal), investigation (equal), methodology (equal), project administration (equal), supervision (supporting), writing – original draft (equal). Ying Wang: conceptualization (equal), data curation (equal), formal analysis (equal), investigation (equal), methodology (equal), project administration (equal), writing – original draft (equal). Zixi Jiang: methodology (equal), project administration (equal), software (equal). Yi He: methodology (equal), project administration (equal), software (equal). Guowei Zhou: methodology (equal), project administration (equal), visualization (equal). Benliang Wei: methodology (equal), project administration (equal), visualization (equal). Jiachen Liu: methodology (equal), resources (equal), software (equal), supervision (equal), writing – review and editing (equal). Xiang Chen: conceptualization (equal), funding acquisition (equal), resources (equal), supervision (equal), writing – review and editing (equal). All authors have read and approved the final manuscript.
Acknowledgments
The author would like to express their gratitude to BioRender (www.biorender.com) because the Graphical Abstract image was created by it. This study was supported by the National Key Research and Development Program of China (No. 2019YFA0111600 and No. 2019YFE0120800).
Ethics Statement
Most data used in this study are publicly available from studies with relevant participant consent and ethical approval. Our in-house data relies on the study approved by the Medical Ethics Committee of Xiangya Hospital Central South University on August 1, 2023 (No. 202308636).
Consent
Written informed consent was obtained from all participants.
Conflicts of Interest
The authors declare no conflicts of interest.
Open Research
Data Availability Statement
Apart from our in-house dataset, the datasets we analyzed were basically from open-access (OA) publications. We only used preprocessed expression matrices/profiles and did not include the original sequencing files or individual level genotype data. All data accessed before July 29, 2024. No datasets analyzed here were subject to NIH-controlled access policies or embargoes prior to this cutoff date. The processed data of scRNA-seq generated in this study were deposited in Zenodo at https://doi.org/10.5281/zenodo.14649725. The processed gene expression data and metadata for the in-house immunotherapy cohort are submitted as Table S8. Codes were implemented in R 4.4.0 and are deposited in https://github.com/YantaoXu/Melanoma_Purinergic.


