Pseudomonas syringae Lipopolysaccharide Synthesis Gene wbpL Displays Heterogeneous Expression Within In Vitro and In Planta Populations
Graphical Abstract
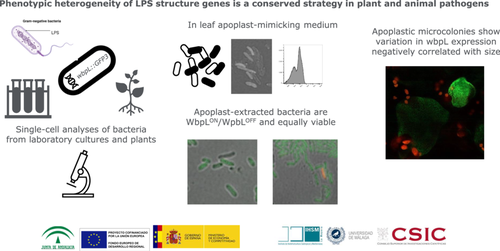
Genetically identical bacteria in the same environment sometimes behave differently. This happens for the expression of wbpL, a gene of plant pathogenic Pseudomonas syringae that shapes the bacterial surface and is important for infection and immunity. whose expression varies among individual bacteria, with ON/OFF bacteria coexisting with similar viability. In planta, the smaller size of microcolonies with higher wbpL expression suggests wbpL expression might slow growth or trigger stronger defenses. Phenotypic heterogeneity of lipopolysaccharide genes is a common strategy for plant and animal pathogens.
ABSTRACT
Phenotypic heterogeneity usually refers to phenotypic variation not associated with genetic variation, nor induced by environmental stimuli. The phenotypic heterogeneity processes described for some complex bacterial traits are causing a shift in how bacterial phenotypes are studied, from traditional assessments by averaging populations to single-cell analysis focused on bacterial individual phenotypes and how these distribute within the population. The structure of the lipopolysaccharide (LPS) layer on the outer membrane in Gram-negative bacteria is often subjected to phenotypic variation, a process that is critical for virulence in animal pathogens. Here, we apply single-cell expression analyses to wbpL, a conserved Pseudomonas syringae glycosyltransferase-encoding gene essential for the synthesis of the O-antigen component of LPS. We show that expression of wbpL displays phenotypic heterogeneity in P. syringae pv. phaseolicola growing in rich medium and reaches bistable expression in minimal medium, where the population splits into WbpLON and WpbLOFF subpopulations. In planta, wbpL expression is also heterogeneous, displaying intermingled ON/OFF with comparable viability. Finally, we followed the expression of wbpL within the spatial context of apoplastic microcolonies, and not only detected heterogeneity within each microcolony, but also found that microcolonies displayed overall differences in fluorescence intensity that correlated with size, with smaller microcolonies displaying higher levels of wbpL expression.
1 Introduction
The outer membrane (OM) is a hallmark of Gram-negative bacteria that is essential for bacterial viability (Silhavy et al. 2010). The OM is an atypical membrane formed by an asymmetric lipid bilayer, with phospholipids in the inner side and lipopolysaccharides (LPSs) in the outer (Funahara and Nikaido 1980). LPSs are a family of structurally related glycolipids that contain a mix of well-conserved and highly variable structural elements. LPS is formed by three different and covalently linked domains (Whitfield et al. 2020): (i) a conserved lipophilic lipid A moiety, with a major role in permeability, which is recognized by the innate immune system as a pathogen-associated molecular pattern in host–microbe interactions (Whitfield et al. 2020); (ii) a short hydrophilic core oligosaccharide structure (core OS), which contributes to OM stability (Holst and Brade 1992); and in most cases (iii) a long-chain hypervariable repeat-unit O-polysaccharide (OPS) also known as O-antigen that glycosylates core OS, and may differ in glycose and nonglycose components, linkages, topology and chain lengths (Goldman and Leive 1980). The OPS is often involved in providing protection against environmental threats (Whitfield et al. 2020), phage recognition and binding (Mostowy and Holt 2018), in adhesion to surfaces and biofilm formation (Bogino et al. 2013), and as the exposed part of LPS, the OPS can also contribute to the recognition of LPS by the immune system in both animal and plant hosts (Lerouge and Vanderleyden 2002; Ranf 2016).
Phenotypic variation of OPS is a critical aspect of virulence in many Gram-negative animal pathogens, for example, Coxiella burnetii (Long 2024), Helicobacter pylori (Appelmelk et al. 2000; Sijmons et al. 2022), Haemophilus influenzae (Weiser et al. 1990), Pasteurella multocida (Omaleki et al. 2022), Francisella tularensis (Mlynek et al. 2022), or Salmonella enterica (Cota et al. 2012). No such processes have been reported for OPS in plant pathogens. Nonetheless, defects in OPS synthesis have been shown to cause a complete or strong virulence attenuation in plant pathogens, such as Erwinia spp., Ralstonia solanacearum, Xanthomonas axonopodis pv. citri or Xylella fastidiosa (Drigues et al. 1985; Schoonejans et al. 1987; Berry et al. 2009; Petrocelli et al. 2012; Li et al. 2014; Rapicavoli et al. 2018). In the model plant pathogen Pseudomonas syringae species complex, a genetic analysis identified wbpL, a gene encoding a glycosyltransferase, as conserved in all strains examined and essential for OPS synthesis (Kutschera et al. 2019). Deletion of wbpL in the model strain P. syringae pv. tomato DC3000 reduces the ability of this pathogen to enter the host tissue. This is likely associated with the reduced swarming motility displayed by the ΔwbpL mutants in this pathogen (Kutschera et al. 2019). The ΔwbpL mutant also has a reduced ability to colonize the leaf apoplast of host plant Arabidopsis thaliana (Kutschera et al. 2019). Mutations of the wbpL ortholog of another model strain from this species complex, P. syringae pv. phaseolicola 1448A had also been reported previously to reduce leaf colonization and virulence in common bean (Rudolph 1989).
In this study, we have investigated the expression of wbpL at the single-cell level within populations of two important P. syringae model strains where this gene has been proven to be involved in virulence: P. syringae pv. tomato DC3000 (hereafter Pto) and P. syringae pv. phaseolicola 1448A (hereafter Pph). We have generated transcriptional fusions to a promoterless green-fluorescent protein 3 (GFP3) gene downstream to the wbpL gene of each of these two model strains and used single-cell methods to follow the expression of this gene both under laboratory growing conditions and in plants. We show that expression of wbpL is low and displays phenotypic heterogeneity in P. syringae pv. phaseolicola growing in rich medium, while it reaches bistable expression in minimal media, where the population splits into WbpLON and WpbLOFF subpopulations. In planta, wbpL expression is also heterogeneous, with the apoplastic population displaying intermingled ON/OFF bacteria with comparable viability. Finally, we followed the expression of wbpL within the spatial context of apoplastic microcolonies, detecting heterogeneity within each microcolony. In this context, we also found that microcolonies displayed overall differences in fluorescence intensity that negatively correlated with size, with smaller microcolonies displaying higher levels of wbpL expression.
2 Materials and Methods
2.1 Bacterial Strains and Growth Conditions
Bacterial strains used and generated in this study are detailed in Table 1. Escherichia coli and P. syringae strains were grown with aeration in Lysogeny Broth (LB) medium (Bertani 1951) at 37°C (E. coli) or 28°C (P. syringae). When necessary, antibiotics were used at the following concentration: ampicillin (Amp), 100 μg/mL for E. coli and 500 μg/mL for P. syringae; kanamycin (Km), 50 μg/mL for E. coli and 15 μg/mL for P. syringae derivative strains; cycloheximide, 2 μg/mL. We also used Hrp-inducing medium (HIM), which is believed to mimic conditions within the leaf apoplast. Different studies have used variations on the composition of this minimal medium (Bretz et al. 2002; Huynh et al. 1989; Rahme et al. 1992; Taira et al. 1999; Thwaites et al. 2004; Xiao et al. 1992). The formulation and pH used in this study (Xiao et al. 1992) provide equal results in single-cell type III secretion system (T3SS) expression analysis regardless of pH (pH 5.7 or 7.0), fitting with T3SS expression throughout pH-changing early stages of apoplast colonization (Rufián et al. 2016; O'Leary et al. 2016; López-Pagán et al. 2025). To grow cultures in HIM, bacteria were initially cultured overnight in LB at 28°C, supplemented with the appropriate antibiotic, then washed twice in 10 mM MgCl2 and then grown from an initial optical density (OD) adjusted to 0.13 in hrp-inducing minimal medium (HIM), containing 10 mM fructose, and pH adjusted to 7 with 10 N NaOH, at 28°C with agitation.
| Name | Genotype | Reference |
|---|---|---|
| Escherichia coli One Shot TOP10 | F-mcrA Δ(mrr-hsdRMS-mcrBC) Φ80lacZΔM15 ΔlacX74 recA1 araD139 Δ(araleu)7697 galU galK rpsL (StrR) endA1 nupG. For cloning | Invitrogen |
| 1448A | Pseudomonas syringae pv. phaseolicola wild-type strain race 6 | Teverson (1991) |
| DC3000 | P. syringae pv. tomato wild-type strain | Cuppels (1986) |
| LMM1 | 1448A wbpL::GFP3 KmR | This study |
| LMM2 | DC3000 wbpL::GFP3 KmR | This study |
2.2 Generation of Strains Carrying a wbpL::GFP3 Transcriptional Fusion
Bacterial strains carrying a chromosome-located transcriptional fusion of wbpL to a promoterless GFP3 gene were generated using an adaptation of the method previously described by Rufián. (2018). The plasmids used and generated for this purpose are detailed in Table 2, and the primers used are described in Table 3. To generate the allelic exchange plasmids, we amplified two fragments from either Pph 1448A or Pto DC3000 genomic DNA using Q5 High-Fidelity DNA Polymerase (New England Biolabs, USA); in each case, fragment A encompasses the 3′ end of the wbpL open reading frame (ORF), including the STOP codon, and fragment B the sequence immediately downstream to the STOP codon. Reactions were carried out starting at 98°C for 1 min for the initial denaturation step, followed by 30 cycles at 98°C for 30 s, annealing at 58°C (fragment B) or 60°C (fragment A) for 30 s, and extension at 72°C for 30 s, followed by 5 min at 72°C for the final extension step. Reaction mixes included 0.64 mM deoxynucleotide triphosphate (dNTP) mix, 0.4 ng of each primer, 1 ng of genomic DNA, the appropriate enzyme buffer, and commercial ultrapure water (Nalgene, Rochester, NY, USA). Two μL of each gel-purified product of the polymerase chain reaction (PCR) was employed as templates for the subsequent fusion PCRs, employing primers A1 and B2, for reactions carried out as described above, with extended elongation times of 1 min. The resulting bands, containing the end of each ORF and its downstream sequence separated by an EcoRI restriction site, were cloned into comercial plasmid pGEM-T (Promega, USA) and fully sequenced to disregard mutations. This process rendered the pGT-AB-wbpL plasmids needed for generating the allelic exchange plasmids. A GFP3-FRT-nptII-FRT fragment was obtained by digesting the plasmid pGT-GFP with the EcoRI enzyme. This fragment includes the promoterless GFP3 gene, with its ribosomal binding site, followed by the kanamycin resistance gene (nptII), flanked by flipase recognition targets (FRTs) sites, and is flanked by two EcoRI restriction sites. The GFP3-FRT-nptII-FRT fragment was blunt-ended through a PCR procedure and ligated into EcoRI-digested pGT-AB-wbpL plasmids, generating the pGT-wbpL::GFP3 plasmids. These plasmids were transformed into the corresponding wild-type strains, P. syringae pv. phaseolicola 1448A to generate the Pph wbpL::GFP3 strain, and P. syringae pv. tomato DC3000 to generate the Pto wbpL::GFP3 strain.
| Name | Description | Reference |
|---|---|---|
| pGEM-T vector | Escherichia coli expression vector for cloning. AmpR | Promega, USA |
| pGT-GFP+ | E. coli expression vector carrying the GFP3-Km gene. AmpR KmR | Rufián (2018) |
| pGT-AB-Pto-wbpL | pGEM-T vector carrying the last 600 pb of the wbpL ORF from DC3000 (A) followed by an EcoRI site and the 500 bp immediately downstream the wbpL STOP codon (B). AmpR | This study |
| pGT-Pto-wbpL::GFP3 | Allelic exchange vector for the generation of a transcriptional fusion of wbpL to GFP3 in DC3000. AmpR KmR | This study |
| pGT-AB-Pph-wbpL | pGEM-T vector carrying the last 600 pb of the wbpL ORF from 1448A (A) followed by an EcoRI site and the 600 bp immediately downstream the wbpL STOP codon (B). AmpR | This study |
| pGT-Pph-wbpL::GFP3 | Allelic exchange vector for the generation of a transcriptional fusion of wbpL to GFP3 in 1448A. AmpR KmR | This study |
| Name | Sequence | Restriction site | Reference |
|---|---|---|---|
| A1 PphwbpL | CTGGTATGGATGTTGAATCT | — | This study |
| A2 PphwbpL | CCGCTTCGGAATTCTTACCTGATTTCCGCCT | EcoRI | This study |
| B1 PphwbpL | TCAGGTAAGAATTCCGAAGCGGTTTTCTG | EcoRI | This study |
| B2 PphwbpL | TAAATGGCGACCTTCTG | — | This study |
| A1 PtowbpL | CTGGTATGGATGTTGAATCT | — | This study |
| A2 PtowbpL | CCGCTTCGGAATTCTTACCTGCTTTCTGCCT | EcoRI | This study |
| B1 PtowbpL | GCAGGTAAGAATTCCGAAGCGGGTTTCTG | EcoRI | This study |
| B2 PtowbpL | TAGATGGCGACTTTTTGC | — | This study |
2.3 Plant Assays
Ten-day-old Phaseolus vulgaris bean cultivar Canadian Wonder plants cultivated under controlled conditions at 23°C, 95% humidity, with artificial light maintained for periods of 16 h within the 24 h were used in all experiments. The first true leaves were inoculated by immersing the entire leaf in the bacterial inoculum, containing 0.01% Silwett L-77 (Crompton Europe Ltd., Evesham, UK), and using a pressure chamber (Rufián et al. 2022). Bacterial inocula were prepared resuspending biomass from bacterial lawns grown on LB plates for 48 h at 28°C, into 2 mL of 10 mM MgCl2, adjusting optical density (OD600) to 0.1 (which corresponds to 5 × 10⁷ colony forming units per milliliter, CFU/mL, of Pph 1448A), and serially diluting to a final concentration of 5 × 10⁴ CFU/mL. Four days postinoculation (dpi), bacteria were recovered from the plant apoplastic fluid as previously described (Rufián et al. 2022). Briefly, each leaf is pressure infiltrated with 10 mL of a 10-mM MgCl2 solution inside a 50-mL syringe, by applying five cycles of pressure (pushing and pulling the plunger five times), before collecting the flow-through, which is then transferred to a fresh 50-mL tube from which 3 mL are directly analyzed by flow-cytometry (FC).
2.4 FC Analysis
LB cultures were obtained from an overnight incubation in LB. For HIM cultures, 500 μL of an overnight P. syringae LB culture was washed twice in 10 mM MgCl2, added to 4.5 mL of HIM and incubated at 28°C for 24 h (Pph) or 5 h (Pto). Apoplast-extracted bacterial suspensions were obtained as indicated above. Three hundred μL of the cultures in HIM, LB or apoplast-extracts were analyzed using a BD FACS Verse cytometer (BD Biosciences, USA). FITC-A filter was used to visualize green fluorescent protein (GFP) signal. Graphs were generated using the FlowJo X v. 10.0.7r software.
2.5 Confocal Microscopy Analysis
Suspensions of 2 μL of apoplast-extracted bacteria or media-grown bacteria were deposited over a 0.17-mm coverslip and an agar-pad square was placed on top of the drop to create a bacterial monolayer, following the method described in Rufián et al. (2022). To visualize all cells, bright field images were included. Images of single-cell bacteria were acquired using the Zeiss LSM880 confocal microscope (Zeiss, Germany), using ×63 or ×100 objectives. To visualize apoplastic microcolonies, sections of P. vulgaris leaves (approximately 5 mm2) inoculated with Pph wbpL::GFP3, were carefully excised using a razor blade, mounted on slides in double-distilled H2O with the lower epidermis facing the objective, and cover with a 0.17-mm coverslip. Images of the leaf mesophyll were taken using the Leica Stellaris 8 confocal microscope (Leica Microsystems GmbH, Germany) with ×40 objectives. Filters for wavelength selection were used for the visualization GFP (488 nm/500–533 nm), and plant autofluorescence (514/605–670 nm). Images were processed using Leica LASX 1.4.6 (Leica Microsystems, Germany) software. Z series imaging was taken at 1 μm using ×40 objectives.
2.6 Live-Dead Stanning
We added one drop of a propidium iodide solution Ready Probes (Thermo Fisher Scientific, USA) to 300 μL of the suspension of apoplast-extracted bacteria. Live-dead bacteria were identified by FC. For live-dead staining, bacteria were syringae-infiltrated with a suspension of 5 × 10⁴ CFU/mL in bean leaves and apoplast-extracted at 4 dpi. Live-dead bacteria were identified according to PI staining by confocal microscopy (as described above).
2.7 Quantification and Statistical Analysis
Quantification and statistical analysis were performed using Prism. Details of the analysis used and the level of significance are indicated in the corresponding figure legends. Software used for data quantification and analysis is detailed in Table 4.
| Software | Reference | Source |
|---|---|---|
| Image J 2.9.0/Fiji 2.14.0 | https://imagej.net/ij/docs/index.html | |
| GraphPad Prism 9.0 | Prism | https://www.graphpad.com |
| LAS X 1.4.6 | Leica microsystem | https://www.leica-microsystems.com/es/productos/software-de-microscopia/p/leica-las-x-ls/ |
| ZEN 3.4 | Carl Zeiss Microscopy | https://www.zeiss.com/microscopy/es/productos/software/zeiss-zen.html |
| BDFACSDiva | BD | https://www.bdbiosciences.com/ko-kr/products/software/instrument-software/bd-facsdiva-software |
| BDFACSuite 1.0.5 | BD | https://www.bdbiosciences.com/en-ie/products/software/instrument-software/bd-facsuite-application#Overview |
| FlowJo X v. 10.0.7r | Tree Star | https://www.flowjo.com |
3 Results
3.1 Single-Cell Expression Analysis of wbpL in Pph 1448A in Laboratory Conditions
To investigate single-cell expression of wbpL within populations of Pph (1448A), we generated a transcriptional fusion to a promoterless GFP3 gene downstream to the wbpL (PSPPH_3657) gene within its native chromosome location (Figure S1). This was carried out following previously described methodology based on allelic exchange that preserves genome context and the target gene sequence (Rufián 2018; Figure S1). Cultures grown in rich medium (LB) of the resulting Pph wbpL::GFP3, as well as of the corresponding Pph reference strain, were used for single-cell expression analysis. FC shows that wbpL is expressed at a very low level, and not for the entire population (Figure 1A), with just approximately 10% of WbpLON bacteria in Pph wbpL::GFP3 populations detected by FC on average. FC histograms consistently show a unimodal distribution for wbpL::GFP3 fluorescence that considerably overlaps with the corresponding nonfluorescent Pph reference strain used as a negative control (Figure 1A). This fluorescence distribution was maintained regardless of the growth phase (Figures 1A and S2). Confocal microscopy analysis of GFP fluorescence within Pph wbpL::GFP3 populations shows a few bacteria displaying very low, but higher than most, fluorescence intensities (hereafter referred to as WbpLON bacteria, in reference to their expression phenotype) (Figure 1B), in keeping with FC results (Figure 1A). Control images obtained for the non-GFP3 Pph reference strain taken with these settings show that the very low background expression that can be detected in some Pph wbpL::GFP3 is due to expression of the gene fusion and not to background noise (Figure S3).
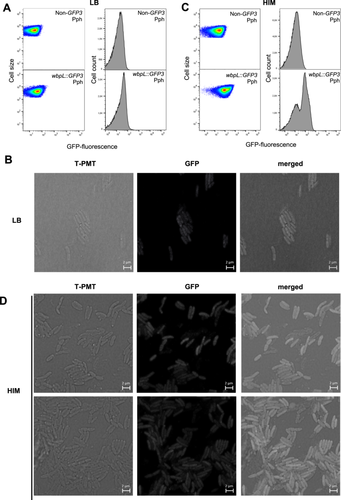
We also analyzed the single-cell expression of wbpL::GFP3 in bacterial populations grown in a minimal medium (Hrp-inducing medium or HIM) where expression of the T3SS genes is induced and that is believed to mimic to some extent conditions within the plant apoplast (Huynh et al. 1989; Xiao et al. 1992). FC analysis carried out on HIM-grown populations of Pph wbpL::GFP3 and Pph show results rather different to those previously observed for LB-grown (Figure 1C). First, the percentages of WbpLON bacteria within the HIM-grown populations were consistently higher than those observed in those LB-grown (Figure 1C), with half of the bacteria, on average, displaying a stronger WbpLON phenotype. This change in fluorescence distribution is accompanied by a significantly larger variation in fluorescence levels among HIM growing bacteria than those detected among those LB-grown (as established by a robust coefficient of variation or RCV, Figure S2). Second, histograms for these samples reproducibly show a marked bimodal (sometimes even trimodal) distribution of fluorescence (Figure 1C). This distribution is compatible with a bistable expression pattern and the formation of WbpLON and WbpLOFF subpopulations, the latter fully overlapping with the nonfluorescent reference Pph strain (Figure 1C). The term bistability is used to describe bimodal patterns of gene expression. These patterns can be determined by phase variation (van der Woude 2011), as in the case of opvAB, which determines the length of the O-antigen in the LPS of S. enterica (Cota et al. 2012), but also when loci with heterogeneous (noisy) expression are regulated by positive feedback loops, as in the paradigmatic case of the E. coli lac operon (Novick and Weiner 1957), or double negative feedback loops as in another classic example of regulation, the lysis/lysogeny decision in the λ bacteriophage (Herskowitz and Hagen 1980). Such regulatory loops split heterogeneous populations into ON/OFF subpopulations. Confocal microscopy analysis supports the results obtained by FC (Figure 1D). Although the fluorescence intensities displayed by WbpLON bacteria in HIM-grown populations are not high, they are distinctly higher than in LB, to such extend that WbpLON and WbpLOFF bacteria can be easily identified within these populations (Figure 1D). Our team has previously reported bistable expression for T3SS (Hrp) genes in HIM-grown populations of Pph (Rufián et al. 2016). In the case of the T3SS genes, bistability is linked to a double-negative feedback loop, and enhanced by an additional positive feedback loop (Rufián et al. 2016).
3.2 Single-Cell Expression Analysis of wbpL in Pto DC3000 in Laboratory Conditions
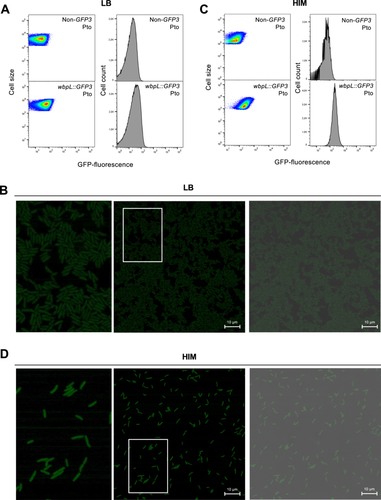
To investigate the expression of wbpL at the single-cell level within populations of Pto (DC3000), we generated transcriptional fusions to a promoterless GFP3 gene downstream to the wbpL (PSPTO_1755) gene within its native chromosome location, as carried out for Pph (Figure 1) to preserve genome context and the target gene sequence (Rufián 2018). Cultures grown in rich medium (LB) of the resulting Pph wbpL::GFP3, as well as of the corresponding Pph reference strain, were used for single-cell expression analysis. FC and confocal analysis carried out using LB-grown Pto wbpL::GFP3 cultures (Figure 2A,B) show fluorescence levels were very low and arguably less heterogeneous than observed for Pph wbpL::GFP3 (Figure 1A,B). Histograms show unimodal distributions for Pto wbpL::GFP3 fluorescence extensively overlapping with the corresponding nonfluorescent Pto reference strain (Figure 2A), supporting what can be observed by confocal microscopy (Figure 2B). FC analyses carried out with 5 h HIM-grown Pto wbpL::GFP3 cultures, using shorter incubation times to account for the faster growth rate of Pto versus Pph in this medium, we also found a unimodal distribution of fluorescence (Figure 2C), clearly differing from the bimodal distribution displayed by Pph wbpL::GFP3 in HIM (Figure 1C). Also, although expression is slightly induced in HIM versus LB-grown Pto wbpL::GFP3, it is lower on average than expression displayed by Pph wbpL::GFP3 WbpLON bacteria (Figure 2C vs. Figure 1C). Confocal microscopy analysis showed little differences in the GFP fluorescence displayed by individual bacteria (Figure 2D), contrasting with the differences observed between WbpLON and WbpLOFF in HIM-grown Pph wbpL::GFP3 bacteria (Figure 1D). Therefore, although we cannot rule out that the Pto wbpL locus may display heterogeneity or even bistable expression in a different environment, our results do not support this being the case under the conditions used in this study. Thus, from this point onwards, we focused our study on the Pph wbpL locus.
3.3 Pph Heterogeneously Expresses wbpL Within the Plant Leaf Apoplast
Although the wbpL locus is heterogeneously expressed in both LB and HIM in Pph wbpL::GFP3, the formation of ON/OFF subpopulations is only detected in HIM-grown populations. Since HIM conditions are closer to conditions within the leaf apoplast, we next evaluated wbpL::GFP3 expression in populations grown in planta, where the function of wbpL has been shown to be involved in virulence. To do this, we inoculated P. vulgaris (common bean) leaves and bacteria were recovered from the plant apoplastic fluid, as previously described (Rufián et al. 2022), 4 dpi. FC analyses of apoplast-extracted Pph wbpL::GFP3 bacteria show a heterogeneous expression pattern for this locus following colonization of the bean leaf (Figure 3A). Confocal microscopy analysis supports the heterogeneous activation of the locus as shown by FC, with WbpLOFF bacteria readily identified among apoplast-extracted bacteria (Figure 3B). The T3SS genes in Pph, which display bistable expression during growth in HIM, also display heterogeneous expression during growth in the more complex plant environment (Rufián et al. 2016).
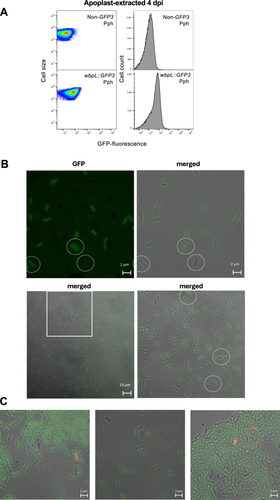
In Arabidopsis, the receptor kinase LIPOOLIGOSACCHARIDE-SPECIFIC REDUCED ELICITATION/S-DOMAIN-1-29 (LORE/SD1-29) mediates medium-chain 3-hydroxy fatty acid (mc-3-OH-FA) perception only in their free form, since 3-OH-decanoyl-comprising bacterial compounds, like, the lipid A from LPS, do not stimulate LORE-dependent responses (Ranf et al. 2015; Kutschera et al. 2019). There are many potential sources of free mc-3-OH-FA in bacteria (discussed in Kutschera et al. 2019). It is conceivable that the absence or presence of properly formed O-antigen may affect lipid A exposure, altering the release of mc-3-OH-FA derivatives susceptible to stimulate LORE-dependent signaling. In addition, the OPS is often involved in providing protection against environmental threats that could include plant defense compounds, bacteriocins from competing bacteria or bacteriophages (Whitfield et al. 2020). Therefore, differences in expression in wbpL within the apoplast could potentially have an impact on how each individual bacteria is detected by plant immune receptors and/or its ability to withstand these defenses and/or additional environmental challenges encountered within the apoplast, since mutations in LPS can be pleiotropic. To evaluate whether any of such processes have a differential impact on WbpLON or WbpLOFF bacterial viability, we used propidium iodide (PI) to detect membrane-compromised (not viable) apoplast-extracted bacteria. This approach can help in determining whether any of the phenotypic variants is undergoing higher killing rates during colonization of the apoplast (Lehtinen et al. 2004; Patel et al. 2021). We found no preferential association of PI staining with WbpLON or WpbLOFF bacteria within the apoplast-extracted populations (Figure 3C). A similar approach has been applied previously to evaluate killing rates within the apoplast of T3SSON/T3SSOFF and FlagellaON/FlagellaOFF, which also displays heterogeneous expression in this niche, revealing no significant differences between the dead/live ratios of ON versus OFF subpopulations for any of the T3SS/Flagella phenotypic variants (López-Pagán et al. 2025).
3.4 Phenotypic Heterogeneity Between Apoplastic Microcolonies
The analysis of expression of T3SS/Flagella within the context of apoplastic bacterial microcolonies showed a spatial distribution of phenotypic variants that support that FlagellaON/T3SSOFF bacteria are somehow protected from the plant cell responses by FlagellaOFF/T3SSON bacteria trans-complementing their defense suppression defect (López-Pagán et al. 2025). Thus, a possible explanation for the lack of viability differences between WbpLON and WbpLOFF bacteria (Figure 3C) might be that these phenotypic variants may cooperate within the context of the microcolony, as shown for the T3SS and flagellar systems. A key aspect of the cooperative nature of the relationship between the different ON/OFF subpopulations of T3SS and flagellar genes is the spatial context of their respective expression within a growing microcolony (López-Pagán et al. 2025). Thus, we investigated how wbpL expression is distributed within apoplastic microcolonies. To this purpose, we analyzed by confocal microscopy leaves inoculated with Pph wbpL::GFP3 at 3 dpi (Figure 4A). Apoplastic microcolonies displayed a heterogeneous pattern of single-cell expression very similar to the patterns described previously for flagella and the T3SS genes (López-Pagán et al. 2025), compatible with stochastic switching of the wbpL locus during microcolony development. However, while flagella and the T3SS genes display a differential spatial distribution within the microcolony, with a preference for FlagellaOFF/T3SSON bacteria in the proximal side of the microcolony, closest to the host cell surface, and an abundance of FlagellaON/T3SSOFF in the more distal parts (López-Pagán et al. 2025), no consistent zonal pattern was identified for expression of the wbpL locus (Figure 4A). Zones of the strongest fluorescent were sometimes visible in some microcolonies, but no reproducible common pattern for the localization of these areas was identified. Although we could not be ruled out that there might be a zonal pattern that may become apparent in, for example, different defense contexts, the simplest explanation for the available data is that such brighter areas as observed in our conditions may simply reflect denser areas within a given microcolony.
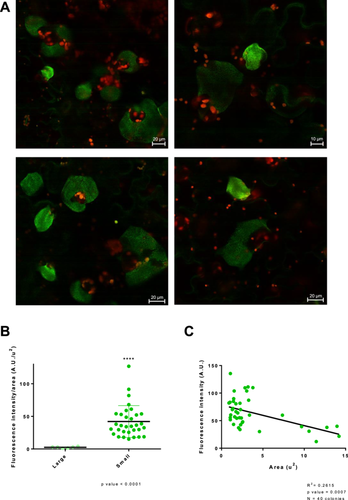
While no discernible zonal pattern was evident within each microcolony, one clear pattern did become apparent in these experiments when comparing the different microcolonies to each other, smaller microcolonies were consistently brighter, displaying stronger wbpL::GFP3 fluorescence) (Figure 4A). Such association between size and overall gene expression intensity is not observed for the flagellar or T3SS genes, nor for constitutively expressed fluorescent reporter genes (López-Pagán et al. 2025). To validate the observed trend, we first classified microcolonies into small or large (not considering intermediate sizes for this purpose) and measured the average GFP fluorescence of each microcolony by manually selecting the area of the microcolony before calculating the mean GFP fluorescence. The results validated the observed trend showing that mean GFP fluorescence is significantly higher in small colonies (Figure 4B). We also measured the areas and fluorescence of the microcolonies (all microcolonies, this time including intermediate sizes) and represented the one against the other (Figure 4C). The results obtained support the notion of a negative correlation between size and wbpL::GFP expression.
4 Discussion
The differences in wbpL expression observed when comparing apoplastic microcolonies have two interesting new aspects to consider. First, despite the heterogeneous ON/OFF switching there is a common trend for high or low wbpL::GFP expression (Figure 4A), which differs between microcolonies. Such a trend may support three possible scenarios: (i) differences in the microenvironments surrounding small versus large microcolonies may be causing a differential activation of wbpL expression within the entire microcolony, (ii) differences in expression of wbpL may be associated with the growth phase of the microcolony, with smaller microcolonies having started to grow later and being in a more active growth state that may require a higher rate to LPS synthesis, and (iii) expression of wbpL may be regulated by an epigenetic mechanism, like it happens with LPS genes for example in Salmonella (Cota et al. 2012), with the mean expression in each microcolony being a reflection of a common inherited status.
The second interesting aspect of these results is the negative correlation observed between the size of the microcolony and the intensity of wbpL::GFP fluorescence (Figure 4B,C). A typical E. coli cell possesses ∼2 × 10⁶ LPS molecules, covering about three-quarters of the cell surface, with 70,000 molecules/min estimated to be exported to the OM, during active growth (reviewed in Whitfield et al. 2020). These numbers support the idea that the production of these macromolecules may require a substantial fraction of bacterial resources. Thus, higher production of WbpL might be associated with slower growth. Additionally, the potential impact of WbpL-mediated changes to the LPS could determine that stronger expression of wbpL::GFP may lead to a stronger local defense restricting bacterial growth.
Phylogenetically, AtLORE is restricted to the Brasssicaceae family (Ranf et al. 2015), but analogous receptors might be present in other species, such as bean plants. In Arabidopsis, LPS triggers the biphasic production of reactive oxygen species (ROS), with a LORE-dependent early ROS burst, and a late intracellular burst that is only partially dependent on LORE (Shang-Guan et al. 2018). While the early ROS burst is not detected in N. benthamiana, tomato, barley or rice, a similar early ROS burst can be induced in soybean (Shang-Guan et al. 2018). Interestingly, LPS-triggered late ROS burst is only partially dependent on LORE in Arabidopsis, and is conserved in all the abovementioned plant species, suggesting the existence of an additional LPS perception system widely distributed in plants that mediates this second ROS response to LPS elicitation (Shang-Guan et al. 2018). A comparative analysis of the LPS of a rough and smooth strain of Pph was performed by Gross et al. (1988), while LPS purification and partial characterization were achieved by Ramm et al. (2023), describing a rhamnose and fucose-rich OPS. The OPS of many plant-pathogenic bacteria comprise l-rhamnose-rich backbones, and synthetic oligorhamnans induce expression of pathogenesis-related genes in Arabidopsis (Bedini et al. 2005). However, while this suggests that bacterial OPS might induce plant immunity, the ability to elicit plant immune responses by the purified OPS from Pph1448A, or any other natural OPS, has not yet been confirmed and thus remains a likely but untested possibility, also considering that plant receptors mediating OPS sensing have not yet been identified. In any case, in a scenario where stronger wbpL expression could lead to triggering stronger local plant defenses, these defenses would restrict bacterial growth without compromising bacterial viability, since PI staining shows no difference between WbpLON and WbpLOFF bacteria (Figure 3C).
Future work will be necessary to establish the biological implications of the wbpL expression patterns described here, as well as to reveal the underlying mechanisms regulating the heterogeneous and bistable expression of this locus in this plant pathogen. But, the results presented here provide evidence of the conservation of an adaptive strategy between plant and animal pathogens: phenotypic heterogeneity of LPS genes. Interestingly, a very recent report has demonstrated through experimental observations and computational simulations, the adaptive value of the bistable expression of the LPS-related Salmonella opvAB locus, regulated by epigenetic variation (Fernández-Fernández et al. 2024). The report supports the notion of such variation as an evolutionary strategy for mutation avoidance in fluctuating environments, while providing experimental support to game theory models predicting that phenotypic heterogeneity is advantageous in changing and unpredictable environments. The findings from our group that crucial virulence determinants such as the T3SS (Rufián et al. 2016), flagella (López-Pagán et al. 2025), and LPS (this report) display phenotypic heterogeneity in P. syringae during growth within the plant host, as these systems do in animal pathogens such as Salmonella (SPI1 T3SS; Bumann 2002; Hautefort et al. 2003; Saini et al. 2010; Flagella Freed et al. 2008 and LPS Cota et al. 2016) expands these evolutionary strategies to bacterial plant pathogens.
Author Contributions
Laura Mancera-Miranda: investigation, methodology, validation, visualization, writing – review and editing. José S Rufián: investigation, methodology, validation, visualization, writing – review and editing. Nieves López-Pagán: investigation, methodology, validation, visualization, writing – review and editing. Javier Ruiz-Albert: conceptualization, funding acquisition, writing – review and editing, methodology. Carmen R Beuzón: conceptualization, funding acquisition, writing – original draft.
Acknowledgments
This study was supported by Grant PID2021-127245OB-100 to C.R.B. and J.R.A. and L.M.M. was supported by FPU Grant FPU19/03365, both funded by MCIN/AEI/10.13039/501100011033/ and by “ERDF A way of making Europe.” Additional support for L.M.M. was provided by “II Plan Propio de Investigación, Transferencia y Divulgación Científica UMA.”
Conflicts of Interest
The authors declare no conflicts of interest.
Open Research
Data Availability Statement
The data that support the findings of this study are openly available in Flow Repository at http://flowrepository.org/id/FR-FCM-Z8X7, reference number R-FCM-Z8X7.


