
Determination of inclusion depth in ex vivo animal tissues using surface enhanced deep Raman spectroscopy
Funding information: Raman Nanotheranostics - RaNT, Grant/Award Number: EP/R020965/1; Engineering and Physical Sciences Research Council
Abstract
This work presents recent developments in spatially offset and transmission Raman spectroscopy for noninvasive detection and depth prediction of a single SERS inclusion located deep inside ex vivo biological tissues. The concept exploits the differential attenuation of Raman bands brought about by their different absorption due to tissue constituents enabling to predict the inclusion depth. Four different calibration models are tested and evaluated to predict the depth of surface enhanced Raman scattering labelled nanoparticles, within an up to 40 mm slab of porcine tissue. An external measurement carried out in transmission mode, with a noninvasively built model on the analysed sample, is shown to be insensitive to variations of the overall thickness of the tissue yielding an average root-mean-square error of prediction of 6.7%. The results pave the way for future noninvasive deep Raman spectroscopy in vivo enabling to localise cancer biomarkers for an early diagnosis of multiple diseases.
Abbreviations
-
- RMSEC
-
- root-mean-square error of calibration
-
- RMSEP
-
- root-mean-square error of prediction
-
- SE
-
- surface enhancement
-
- SERS
-
- surface enhanced Raman spectroscopy
-
- SORS
-
- spatially offset Raman spectroscopy
-
- TRS
-
- transmission Raman spectroscopy
-
- NP
-
- nanoparticle
1 INTRODUCTION
Recent advances in noninvasive Raman techniques 1-3 have demonstrated the possibility of coupling the high sensitivity of surface enhanced Raman spectroscopy (SERS) 4 with the subsurface probing capability of deep Raman techniques to detect targets in tissues 5, 6. Deep Raman techniques (spatially offset Raman spectroscopy [SORS] and transmission Raman spectroscopy [TRS]) are capable of retrieving information about the chemical makeup of deep layers by taking advantage of characteristic light propagation in diffusely scattering (turbid) media 7-9. In the medical area, both SORS and TRS have been demonstrated to be capable of detecting cancerous tissues and calcification at depths 10-12 and to elucidate bone composition in ex vivo 13, 14 and in vivo 15, 16 studies. The maximum probed depth has reached 40 mm and is strongly depended on tissues optical properties (scattering and absorption) at the specific excitation and Raman wavelengths 17, 18 and tissue emissive properties (fluorescence).
SERS can provide a significant enhancement of the normally weak Raman signal of biological samples 19, 20. Moreover, SERS nanoparticles (NPs) can be optimised and functionalised in order to target specific biomarkers of interest and provide in vivo diagnosis of multiple diseases 21, 22. The combination of SERS and SORS techniques (ie, SESORS) opens new prospects for detecting a number of disease conditions in vivo due to the depth and concentration sensitivity with high chemical specificity. To date, SESORS has been demonstrated to be capable of detecting NPs in animal tissues of a maximum thickness of 47 mm 6, 23-26. In a clinical environment, the in vivo localisation of a Raman reporter related to a specific disease (eg, cancer lesion) 27 within the body could potentially improve the effectiveness of diagnosis and subsequent treatments. Within this context, previous research has demonstrated the use of TRS alone 28 or in combination with SORS 29 to retrieve the depth information of a single inclusion buried within a diffusive synthetic phantom. The approach 29 exploits the differential attenuation of Raman photons at different wavelengths due to the optical properties of the diffusive media (absorption coefficient, μa; reduced scattering coefficient, μs′). The resulting change in the relative Raman intensity of the different Raman bands of an inclusion detected at the surface of a sample is related to the mean distance propagated by the Raman photons. Hence, from the evaluation of the relative intensity, for example, of two different Raman bands, through a calibration procedure, the depth of inclusion can be predicted. Here, we explore the possibility of using this approach to detect and, for the first time, to predict the depth of SERS NPs buried in tissues of 30 to 40 mm thickness. In our study, we compare the performance of different models for depth prediction based on both individual and combined use of SORS and TRS. We have also evaluated the performance, in terms of depth sensitivity and accuracy, of the models to varying thickness and the type of ex vivo tissues. Finally, we tested the capability of external calibration based on TRS measurement alone for depth prediction. The objective of this approach was to identify and test a method that can be easily applied and be completely noninvasive, paving way towards using SESORS for in vivo diagnosis and therapy in a clinical context.
2 EXPERIMENTAL
2.1 Deep Raman setup
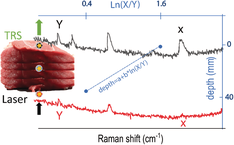
The scheme of the deep Raman setup used in these measurements is presented in Figure 1A. It consists of a custom-built Raman system described in detail elsewhere 29. Briefly, the setup is based on an 830 nm continuous wave diode laser capable of performing Raman measurements both in point-like spatial offset configuration (SORS) and in transmission mode (TRS). After spectral cleaning, the laser beam was incident on sample surface through an optical system to a spot of ∼500 μm diameter. Laser power at sample surface can vary between 1 and 300 mW. A motorised stage provides means of setting a specific SORS spatial offset by moving the excitation path along the plane parallel to the sample surface. Another optical system collimated and alternatively redirected the excitation light to the rear side of the sample for optional transmission measurements. The Raman photons were collected through a calcium fluoride window (50 × 75 × 1.5 mm, CaF2 Raman grade, Crystran) acting as a sample holder at an angle of ∼30° to the normal incidence from an area of approximately 1.5 mm diameter.

2.2 Samples
2.2.1 Ex vivo animal tissues
Three different ex vivo porcine tissue samples were used as diffusive phantoms (ie, tissues T1, T2 and T3 in Figure 1B). All the ex vivo animal tissues were purchased fresh from a local store and frozen until use. T1 consisted of sliced bacon from pork back (45 × 45 × 2 mm, each slice) while T2 and T3 consisted of a steak from belly and shoulder, respectively, sliced to a thickness of approximately 10 and 15 mm (x × y = 55 × 65 mm). The analysed meat phantoms were an assembly of multilayers in order to permit the variation of the overall thickness (T1: 27, 36, 40 mm; T2: 30 mm; T3: 34, 40 mm). The reflectance profile of the meat phantoms (R[λ]) was measured using a benchtop spectrophotometer equipped with an integrating sphere in the 700 to 1100 nm spectral range. The attenuation profile (ie, k/s in Figure 2C) was reconstructed from the spectral reflectance (R[λ]) using the Kubelka−Munk model 30.

2.2.2 SERS-active nanoparticles
In this work, encapsulated SERS-active NPs produced by Oxonica were used 31. They consisted of gold NPs (approximately 100 nm diameter) coated with Raman reporters (d8-4,4′-dipyridyl-d8DIPY) 6 adsorbed to the metal surface and encapsulated in a silica shell. The Raman reporter was well suited to the 830 nm excitation wavelength. The UV–Vis spectrum of the SERS NPs diluted 1000 times is shown in Figure S1 in the Supporting Information. The NPs feature a localised surface plasmon resonance at 564 nm and a relatively low absorbance peak in the NIR due to dilution of the highly concentrated NP colloid. Hence, using the equation 32, the NPs concentration was calculated (considering the plasmon behaviour to be unaffected by the silica shell). The sample used for the study consisted of approximately 2.8 × 10¹⁴ NPs/mL. A Raman/SERS spectrum of NPs measured at 830 nm is shown in Figure 1C.
2.3 Experimental settings and data analysis
The inclusion consisted of a quartz cell (2 mm internal path length) containing the SERS NPs (as target). The cuvette was surrounded by different layers of porcine tissue on each side. The total thickness of the phantom and the depth of the target have been varied (Table 1) by adding tissue layers or changing the position of the quartz cuvette along the optical axis (z-axis) within the stratified tissue slab. The measurement procedure consisted of a sequential acquisition of Raman spectra at different spatial offsets (ie, from 0 to 14 mm with a step of 2 mm) and a measurement carried out in the transmission Raman configuration. For each offset and depth of the target, Raman spectra were recorded with a laser power at sample of 300 mW for 20 s × 10 accumulations in the spectral range 112 to 1938 cm−1 with a spectral resolution of ∼8 cm−1. Different calibration models for depth prediction were created following an approach proposed in our previous work 29. The spectra were analysed using a Gaussian-shape curve fit to the 930 and 1580 cm−1 Raman bands of the target for evaluating the effect of differential absorption due to ex vivo tissue components (eg, water, Figure 1C) on their relative Raman intensities (evaluated as the area of the Gaussian-shape curve). For each spatial offset and transmission measurement, a linear fit (see Figure S2 in Supporting Information) was performed to obtain the trend of the natural logarithm of the intensity ratios of the two bands (1580-930 cm−1) vs the depth (z) of the target 28, 29.
| Thickness (mm) | Depth (mm) | |
|---|---|---|
| T1 | 27 | 9, 18 |
| 36a | 0, 6, 12, 18, 24, 30, 36 | |
| 40 | 10, 20, 30 | |
| T2 | 30 | 15 |
| T3 | 34 | 18 |
| 40 | 10, 30 |
- a Used for calibration in Models 1 to 3.
The overall prediction of the depth was obtained as weighted averages of all of these submodels taking into account data pertinent to each specific model (Models 1, 2 and 3) as per Table 2. These models included calibration data from the target located inside the tissue. In contrast, we have also developed a model in transmission mode (Model 4) that did not require calibration data from any internal compartment of the studied sample using only data from the target located at the two outer surfaces, the laser illumination and Raman collection surface. Table 2 summarises the experimental geometries and calibration datasets used in all the models.
| Geometry | Calibration measurement | |
|---|---|---|
| Model 1 | TRS + SORS | Internal |
| Model 2 | TRS | Internal |
| Model 3 | SORS | Internal |
| Model 4 | TRS | External |
3 RESULTS AND DISCUSSION
Overall, the Raman signal of the labelled SERS NPs was retrieved through up to 40 mm thick porcine tissue. Figure 2 shows the representative Raman spectra collected in the order of depth of the target (0, 6, 12, 18, 24, 30, 36 mm) for transmission measurements (TRS; Figure 2A) and selected spatial offset (SO = 0, 8, 14 mm; Figure 2B,C). In spite of generally lower signal to noise ratios, TRS was capable of detecting the target at all the investigated depths. In contrast, SORS detected the presence of the target with a high level of confidence for depths between 0 and 12 mm and its efficacy drastically dropped for target depths of 18 mm and higher from the laser illumination and detection surface. As expected, by increasing the depth of the target, we observed a distinct change in the relative Raman intensities of the target Raman bands due to the wavelength-dependent variation in absorption and scattering of the tissues phantom. In particular, a prominent change was observed for the 1580 cm−1 band, which falls under an absorption band of water (main component of tissue phantoms, with absorbance peak at 970 nm, Figure 1C). Its intensity was dramatically reduced relative to the 930 cm−1 Raman peak, as a result of increasing depth, and therefore also the increasing mean photon travel distance in the tissue. Likewise, as shown in previous studies 28, 29, the natural logarithm of the ratio of the intensities (1580 to 930 cm−1, ie, I3/I1) vs depth (Figure 3A) can be satisfactorily approximated with a linear function. For each spatial offset and transmission Raman measurement, the linear fit modelled the relation between the relative intensity distortion and the depth of the target. Figure 3B shows the predicted depths vs the measured depth of the NP resulting from all different spatial offsets and TRS measurement on 36 mm thick tissue phantom (T1).

Taking into account all the depths for the calibration model (Table 1) and by combining the output of all different spatial offsets and transmission measurements (Model 1), it was possible to predict the depth of NPs with a root-mean-square error of calibration (RMSEC) of 4.4% (ie, ± 1.5 mm). In agreement with a previous study 29, the combined use of TRS and SORS measurements accurately predicts depth with a lower error overall with respect to using SORS alone or TRS alone. TRS alone (Model 3 in Figure 3B,D) predicted depth with an RMSEC of ∼4.6% whilst SORS alone yielded an accuracy of 6.5% (RMSEC) but lost sensitivity entirely for deeper positions of the NPs in the ex vivo tissue (d > 18 mm). All these models (Models 1-3) relied on the knowledge of depths related to internal point (ie, calibration data requiring access to internal compartments of tissue).
In an in vivo scenario, this internal information is not available, and the use of this approach would only be possible if the calibration dataset was performed on ex vivo tissues. As some differences in optical properties would be expected between the in vivo and ex vivo cases due to differences in physiology and blood content, this might lead to errors in depth prediction.
A possible way to overcome this limitation is by creating an external calibration model for depth prediction that only uses data acquired with the target at the surface positions in transmission configuration (Figure 3C, ie, depth = 0, 36 mm). Through this procedure, it was possible to predict the depth of NPs with an RMSEC of 5.5% (Model 4 in Figure 3D) despite not having access to any internal compartment of the tissue phantom.
In order to compare the performance and robustness of the four models discussed above, five sets of experiments were carried out on different porcine ex vivo tissues (ie, T1, T2 and T3) by changing the overall tissue thickness and depth of NPs (see Table 1). Figure 4A,B shows the prediction of depths resulting from the four different models presented above. These additional experiments confirmed the trend for the accuracy outcomes stemming from the calibration datasets. The model based only on SORS measurements (Model 3) was the least robust since it showed a variation of RMSEP between 2% and 15% among different experiments. Despite TRS model (Model 2) being slightly affected by the changing thickness and the type of ex vivo tissue, it proved to accurately predict the depth of NPs with an RMSEP always below 11% (weighted average RMSEP = 7.8%). Overall, the prediction of depth based on both SORS and TRS measurements (Model 1) resulted in being largely insensitive to thickness variation and changing in ex vivo tissues (ie, M2, M3 in Figure 4B), with a weighted average RMSEP of 6.5%. This evidence confirmed that, in the case of similar spectral behaviour of optical properties (eg, water absorption plays a major role), it was possible to extrapolate the depth of a target on the basis of a model created on a different tissue (T1). Nevertheless, in an in vivo scenario, where the presence of heterogeneities in tissue components potentially leads to large variations of optical properties, the use of a model created in a similar way is desirable. Model 4, for which calibration is performed only using fully noninvasive measurements, ie, externally with the target located only at the surfaces of the analysed system, proved to have comparable depth prediction capability (RMSEP 6.7%) as Model 1 (which, in contrast, requires access to internal compartments of the system for calibration purposes). These results validate the use of the proposed approach for a completely noninvasive prediction of depth of a target buried inside biological tissues.

4 CONCLUSION
We have predicted noninvasively the depth of SERS-active NPs buried as a single entity inside porcine tissues by using SORS and TRS. We compared the performance of different models for depth prediction based on internal and external SORS and TRS measurements.
The combined use of SORS and TRS was more accurate and more robust to the variability of tissue thicknesses (lower RMSEC and RMSEP). Nevertheless, the use of external measurement in TRS configuration proved to be highly effective (RMSEP 6.7%) with the advantage of being completely noninvasive and as such highly suitable for in vivo uses. The proposed concept was validated in ex vivo biological tissues in order to model typical issues that can be present in in vivo scenarios in terms of tissues components (eg, water, lipid and blood) and geometrical factors that lead to interferences with heterogeneity on a smaller scale than the measured depth (eg, surface interaction, tissues anisotropy and fluorescence).
The use of functionalised NPs with different Raman reporters opens the door to the possibility of multiplexing and monitoring different diseases simultaneously. Within this context, the proposed approach could potentially localise different inclusion located at different depth.
Overall, the capability of the detection and depth prediction of SERS NPs in biological tissues leads to promising future applications for noninvasive disease diagnostics in clinical settings.
ACKNOWLEDGMENTS
This work was supported by the Engineering and Physical Sciences Research Council grant EP/R020965/1.
CONFLICT OF INTEREST
The authors declare no financial or commercial conflict of interest.