Multimodal fiber-probe spectroscopy allows detecting epileptogenic focal cortical dysplasia in children
Abstract
We evaluated the diagnostic capability of a multimodal spectroscopic approach for classifying normal brain tissue and epileptogenic focal cortical dysplasia in children. We employed fluorescence spectroscopy at two excitation wavelengths (378 nm and 445 nm) and Raman spectroscopy (at 785 nm excitation) for acquiring fluorescence and Raman spectra from 10 normal brains, 16 focal cortical dysplasia specimens and 1 cortical tuber tissue sites using a custom-built multimodal optical point spectroscopic system. We used principal component analysis combined with leave-one-sample-out-cross-validation for tissue classification. The study resulted in 100% sensitivity and 90% specificity using the information obtained from fluorescence at two distinct wavelengths and Raman spectroscopy for discriminating normal brain tissue and focal cortical dysplasia. Our results demonstrate that this methodology has the potential to be applied clinically for the detection of focal cortical dysplasia and can help to improve as precise as possible surgical resection of the dysplastic tissue during surgery for epilepsy.
Introduction
Focal cortical dysplasia (FCD) is a developmental abnormality of the cerebral cortex and is characterized by abnormal cortical lamination, with or without abnormal cell types 1. The most frequent consequence of FCD is severe focal epilepsy 2, which is resistant to pharmacological treatment. Surgically removing the dysplastic brain region where seizures originate is the only option that can achieve seizure freedom in a number of patients in whom location of the dysplastic, epileptogenic cortex allows to perform the procedure with minimal or no risk of causing neurological deficits 3. Success of neurosurgical resection depends on the ability to remove the dysplastic tissue minimizing damage to perilesional normal tissues 4, 5. Needless excision of normal brain tissue increases the risk of neurological deficits 6 and incomplete removal of the dysplastic tissue implies a high risk of failure, with persistence of seizures. In clinical practice, magnetic resonance imaging (MRI), as well as extracranial and intracranial electro-encephalographic recordings are used for locating the epileptogenic zone to be surgically targeted 7, 8. Restrictions of available methodologies consist in the fact that conventional MRI has limitations in detecting the dysplastic tissue or revealing its full extent 9. Further, brain shifting is a major problem when using pre-operative MRI images for surgical guidance with the aid of neuro-navigation systems 10. All the operating room staff has to take appropriate safety measures and requires a special set-up if MRI is to be used as an intra-operative guiding tool during neurosurgery 10. Intra-operatory electro-corticography (ECoG) is used in some centres to better define the epileptogenic area to be excised, but has limitations as it is an invasive and time consuming procedure that can only sample a limited portion of the cortical surface 11, 12. Hence, there is a need for a real-time system that could help delineating between normal and dysplastic tissue, offering the potential to be used as an intra-operative diagnostic tool during neurosurgery.
Optical diagnostic techniques based on fiber probes provide a possible minimally invasive approach for disease diagnosis. Light is delivered into the tissue by means of optical fibers. After light interaction with the tissue, light originating from tissue is received by means of collection fibers. This collected light carries diagnostically relevant biochemical and morphological information, which could aid in differentiating abnormal from normal tissue. Fluorescence and Raman spectroscopy techniques have been previously implemented using optical fiber probes and used to characterize neoplastic tissues 13, 14. Several studies have been reported on the application of optical spectroscopy for the detection of tumors in the brain. Chung et al. 15 generated excitation-emission matrices to study optimal excitation wavelengths for the detection of brain tumors using fluorescence spectroscopy. The emission peaks at 470 nm, 520 nm, and 630 nm emission peaks were attributed to nicotinamide adenine dinucleotide phosphate (NAD(P)H), flavin and porphyrin, respectively. Stummer et al. 16 assessed the possibility of exogenous fluorophore 5-aminolevulinic acid (ALA) to aid and improve brain tumor resection. Following the application of this contrast agent, protoporphyrin IX (PpIX) is known to selectively accumulate in tumor tissues. Hence, there is a difference in the accumulation of these photo-sensitizers between tumoral and normal tissues. These authors were able to discriminate normal and malignant tissues with 85% sensitivity and 100% specificity. However, ALA was unable to discriminate between low-grade tumor and tumor margins. Croce et al. 17 evaluated the capability of fluorescence spectroscopy in differentiating normal versus glioblastoma tumor margins. This study revealed differences in the spectral intensity and line shape such as a decreased fluorescence intensity, broadening of emission band coupled with a shift to longer wavelengths in the peak emission position were observed in neoplastic tissues.
With regard to Raman spectroscopy, Koljenovic et al. 18 analysed Raman mapping in order to distinguish glioblastoma from necrotic brain tissue with 100% accuracy. Krafft et al. 19 assessed the ability of Raman spectroscopic mapping to discriminate between normal brain tissue, gliomas and meningiomas on ex vivo tissue specimens. Differences were found in lipid and collagen content, hemoglobin (Hb) and lipid to protein ratios between normal brain tissue, glioma and meningioma. Kirsch et al. 20 presented a preliminary study based on Raman spectroscopy to characterize metastatic brain tumors in a mouse model. Raman spectra showed significant differences in proteins, lipids, Hb, collagen and water content. Recently, Jermyn and collaborators used Raman spectroscopy for intraoperatively delineating grade 2 to grade 4 gliomas from normal brain tissue with a sensitivity and specificity over 90% 21.
Combining a multitude of information from different spectroscopic techniques is known to increase diagnostic accuracy 22, 23. Lin et al. 24 applied a combined spectroscopic approach incorporating fluorescence and diffuse reflectance to locate brain tumor margins/tumors in 26 subjects. An empirical algorithm based on auto-fluorescence intensity at 460 nm and diffuse reflectance at 625 nm yielded 100% sensitivity and 76% specificity in categorizing infiltrating tumor margins from normal brain tissues. In yet another study, Valdes et al. 25 implemented a combined spectroscopic method integrating fluorescence and reflectance spectroscopy for classifying different grades of gliomas. Fluorescence contrast was achieved through an exogenous fluorophore 5-ALA. Using reflectance spectroscopy, the authors derived parameters such as Hb concentration, oxygen saturation and scattering coefficient. This combined spectroscopic approach yielded 94% sensitivity and 94% specificity.
The application of multi-modal spectroscopy for demarcating normal tissue from FCD has not been investigated. In this pilot study, we explored the capabilities of multi-modal fluorescence and Raman spectroscopy to distinguish normal brain tissue and FCD on freshly excised tissue samples obtained during neurosurgery in children with intractable epilepsy. Subsequently, we evaluated the diagnostic potential of each technique individually and compared the outcome with a multi-modal spectroscopic approach. Histopathology was used as a gold standard for comparing the spectroscopic results.
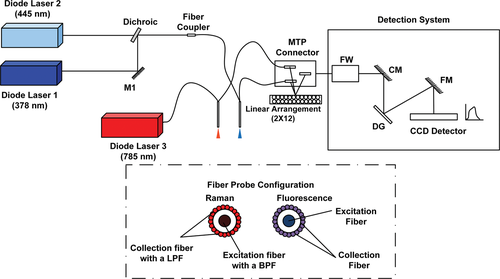
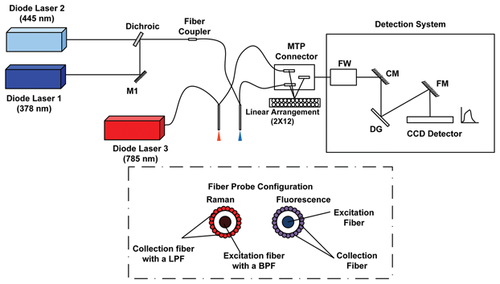
Schematic of the spectroscopy set-up incorporating fluorescence and Raman spectroscopy for differentiating normal brain tissue and FCD. Inset of the figure shows the fiber probe configuration. MTP-Multifiber Pull-Off, FW-Filter Wheel, CM-Collimating Mirror, DG-Diffraction Grating, FM-Focussing Mirror, CCD-Charge Coupled Device, LPF-Long Pass Filter, BPF-Band Pass Filter.
Materials and methods
Instrumentation for acquiring fluorescence and Raman spectra
Light sources
The schematic of the multimodal spectroscopic set-up incorporating fluorescence and Raman spectroscopy is shown in Figure 1. For fluorescence measurements, the set-up has two excitation sources at two different emission wavelengths: 378 nm and 445 nm (LD-378 nm, LD-445 nm, Sacher Lasertechnik GmbH, Marburg, Germany). The light from these two sources is superimposed on the same path using a dichroic (DM-FF409-Di02, Semrock, Rochester, New York, United States). Light is then coupled to the delivering fiber of a custom designed fiber optic probe by means of a fiber coupler (FC-Ely-Prizmatix, Modin Ilite, Israel). For Raman spectroscopy, the excitation laser at 785 nm (FC-785-350-MM2-PC-0-RM, RGBLase, Fremont, California, United States) excitation wavelength is directly connected to the Raman probe through a FC/PC connector.
Fiber optic probe
Two different fiber probes (EMVision LCC, Loxahatchee, Florida, United States) have been used for fluorescence and Raman spectroscopy, respectively. Each probe has a single illumination fiber surrounded by 24 collection fibers. The fiber optic probes used for fluorescence and Raman spectroscopy had a numerical aperture of 0.22 with a core diameter of 100 microns. For Raman spectroscopy, the probe had a band pass filter placed in the distal end of excitation fibers to prevent the Raman signal arising in probes from illuminating the tissues of interest. A doughnut shaped long pass filter is incorporated in the collection fibers to suppress the elastically scattered light reaching the detector.
Spectral collection
The spectral signals are acquired by a detection system made using a monochromator, equipped with a filter wheel, (Micro HR, HORIBA Jobin Yvon, Edison, New Jersey, United States) and a charge coupled device (CCD) (Syncerity 356399 open-electrode front-illuminated, 1024 × 256 pixels, HORIBA Jobin Yvon, Edison, New Jersey, United States). Three different filters have been included in the filter wheel (1) two long pass filters for measuring fluorescence at two different wavelengths (03LWP402, CVI Melles Griot, Albuquerque, New Mexico, US and LP02-458RS-25, Semrock, Rochester, New York, United States) (2) a notch filter to remove the Rayleigh scattered light for Raman measurements (NF03-785E-25, Semrock, Rochester, United States). The spectral acquisition time was 0.1 to 0.01 seconds for fluorescence and 1 to 5 seconds for Raman spectroscopy measurements. Laser power delivered at the output of the fiber tip towards the sample was approximately 2 mW for 378 nm, 11 mW for 445 nm and 95 mW for 785 nm excitation wavelengths.
Sample collection and handling
Samples of normal and dysplastic brain tissue were obtained during neurosurgery for epilepsy at Anna Meyer Children's Hospital, Florence, Italy. After the surgical resection, few droplets of PBS were added to the tissue specimen in order to maintain its natural osmolarity. The specimen was then transported in a falcon tube to the optical spectroscopic laboratory, located about 500 meters away from the hospital. Spectral measurements were taken within 1 hour from surgical resection. During this time the sample remained exposed to air, apart from the few droplets of PBS added. This resulted in measurements on 10 normal and 17 FCD sampling sites from 3 normal, 7 FCD and 1 cortical tuber samples. Two out of three samples of normal brain were taken from the same patient who was treated with a transcerebral transcortical transventricular approach to remove a large left intraventricular brain tumor (Primitive Neuroectodermal Tumor – PNET); the third sample of normal brain tissue was taken during a transcerebral transcortical approach performed to remove a relapsing subcortical low grade glioma (ganglioglioma) located within the right temporal lobe. The pathological distribution of the samples is listed in Table 1. During tissue measurements, the probe was in gentle contact with the tissue surface. The study was approved by the Medical Ethics Review Board of the Anna Meyer Children's Hospital and conducted according to the tenets of the Declaration of Helsinki. Informed consent was obtained in each case.
|
Tissue Type |
# of Samples |
# of Sites |
|---|---|---|
|
Normal |
3 |
10 |
|
FCD Ib |
3 |
6 |
|
FCD IIb |
1 |
2 |
|
FCD IIIa |
3 |
8 |
|
Cortical Tuber |
1 |
1 |
Spectral data-preprocessing and tissue differentiation
Fluorescence spectra were subjected to Savitzky-Golay filter to remove noise and normalized to maximum intensity. For Raman signals, the raw spectra were subject to a three step pre-processing: (a) a fifth-order polynomial was fit to the raw spectra and was then subtracted to remove unwanted spurious fluorescence and background signals and to extract the Raman spectrum; (b) Savitzky-Golay filter was used to remove noise; (c) normalization to the maximum intensity was performed to compare the acquired spectral shape. To reduce the dimension of data, we applied principal component analysis (PCA) to pre-processed spectral data and then the diagnostic ability was calculated. For determining the diagnostic performances, we used PC scores from individual spectroscopic technique and in the case of a combined spectroscopic approach we introduced the concept of scoring algorithm in which the PC scores from different spectroscopic techniques are combined. In addition, we generated Receiver Operator Characteristic-Area under the Curve (ROC-AUC) plots from the PC data in order to measure the performance of different spectroscopic approaches involved in this investigation for classifying normal and FCD tissues. In these plots, true positive values (sensitivity) were plotted against the corresponding false positive rates (1-specificity). ROC provides a visual interpretation of the performance of a classifier 26. All data pre-processing and tissue classification were performed using Matlab (The MathWorks Inc., Natick, Massachusetts, United States).
Results and discussion
Tissue auto-fluorescence
Auto-fluorescence spectral measurements were carried on freshly excised brain tissue samples. Figure 2 shows the mean normalized spectra of normal brain tissue (blue line) and FCD (green line) at 378 nm and 445 nm excitation wavelengths. Noticeable differences were observed in the spectra features between the two tissue types. For 378 nm excitation, FCD showed a blue shift in the maximum emission peak with respect to the normal type. A similar shift was observed in the fluorescence spectra of brain tissues when differentiating normal and tumor tissues 27. This blue spectral shift was not observed for the emission peak at 445 nm excitation. Another interesting feature is that a modulation in fluorescence emission profile is evident in the region between 510 nm and 600 nm using both excitation wavelengths. This typical spectral shape is credited to re-absorption of emitted fluorescence by Hb. Hb is a primary absorbing chromophore in biological tissues in the visible region of the spectrum 28; it has its maximum absorption bands at 540 nm and 580 nm which corresponds to oxygenated Hb bands while at 555 nm the contribution is due to deoxygenated Hb 29. A similar type of interference due to Hb was observed in the emission spectra of cervical tissues 30. This is also in agreement with the study of Lin et al. where they observed effects of Hb absorption in brain tissues when demarcating brain tumors and infiltrating tumor margins 24.
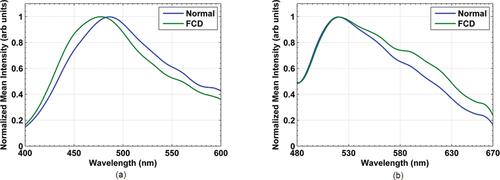
Mean normalized auto-fluorescence spectra of normal brain tissue (blue line) and FCD (green line), excited using (a) 378 nm, and (b) 445 nm wavelengths.
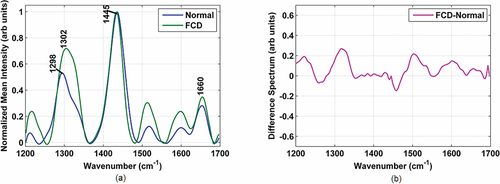
(a) Mean normalized Raman spectra of normal brain tissue (blue line) and FCD (green line) (b) Difference spectra between FCD and normal tissue.
Raman spectra
Figure 3a shows the mean normalized Raman spectra of normal brain tissue (blue line) and FCD (green line). Significant differences exist in the Raman spectra between normal and FCD tissues. Prominent spectral peaks along with their tentative band assignments were observed in were observed in 1298 cm–1 (lipid (CH2)), 1302 cm–1 (CH3=CH2 twisting or bending mode of lipid/collagen), 1445 cm–1 (CH2 bending mode of proteins and lipids) and 1660 cm–1 (amide I band, (CO) stretching mode of protein, C=C stretch vibrations of non-saturated fatty acid chains in lipids) 19, 20. Difference spectra revealing changes in the biomolecular constituents between normal and FCD tissues are shown in Figure 3b.
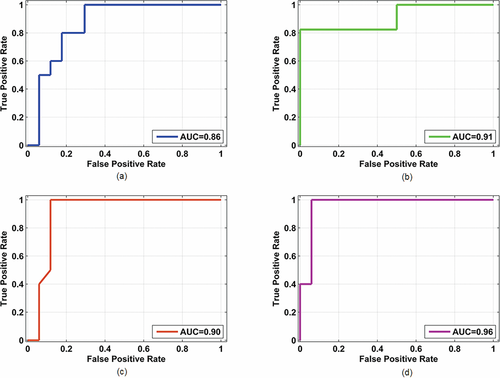
ROC-AUC for discriminating normal and FCD tissues using: (a) fluorescence at 378 nm excitation, (b) fluorescence at 445 nm excitation, (c) Raman at 785 nm excitation, (d) multimodal spectroscopy incorporating fluorescence spectroscopy at 378 nm and 445 nm excitation and Raman spectroscopy at 785 nm.
|
Methodology |
Sensitivity (%) |
Specificity (%) |
|---|---|---|
|
Fluorescence (378 nm) |
90 |
62 |
|
Fluorescence (445 nm) |
100 |
64 |
|
Raman (785 nm) |
100 |
70 |
|
Combined spectroscopy |
100 |
90 |
For example, FCD tissues exhibit significantly increased spectral intensities at 1302 cm–1 and 1660 cm–1 indicating the potential of Raman spectroscopy for discriminating normal and FCD tissues.
Tissue classification
 (1)
(1)The corresponding values of sensitivity and specificity are listed in Table 2. The ability to discern normal and FCD in pediatric brain tissues can be considerably improved by combining the information from different spectroscopic techniques. Here, we were able to achieve 100% sensitivity and 90% specificity using a multimodal spectroscopic approach incorporating fluorescence and Raman spectroscopy. We further generated ROC to determine the performance of the spectroscopic techniques involved in this study. The AUC for PC scores (shown in Figure 4) yielded 0.86, 0.91, 0.90 and 0.96 for 378 nm, 445 nm, 785 nm excitation wavelengths and multimodal spectroscopic approach respectively.
Discussion
Pitfalls associated with current diagnostic standards such as MRI and neuro-physiological investigations provide a strong motivation to focus on the application of optical point spectroscopic techniques for differentiating normal brain tissue and FCD. Our study employed multimodal optical spectroscopy to probe FCD in pediatric subjects. The wavelengths used in the study, 378 nm and 445 nm excitation wavelengths probe two fluorophores: nicotine amide adenine dinucleotide (NADH) and flavin adenine dinucleotide (FAD). These two fluorophores are responsible for metabolic activity in tissues 31. A previous study using positron emission tomography (PET) in patients with focal epilepsy demonstrated that epileptogenic zones exhibit a change in metabolic activity (hypo-metabolism) 32. We hypothesize that alterations in the fluorescence spectral profile could be due to altered tissue metabolism in FCD. Spectral data used in this study are modulated by the Hb absorption and scattering properties of a tissue. Previously, models were developed based on photon migration model 33 and Monte-Carlo modelling 34 to extract the intrinsic fluorescence. Removing these modulations due to tissue optical properties and extracting the intrinsic fluorescence using these techniques and applying classifying algorithms could increase the prediction ability 35.
Recently, Yadav et al. 36 implemented an empirical model based on the ratios of fluorescence and reflectance intensities at specific wavelengths. Using this model, these authors achieved 80% accuracy. However, results of the above study might be biased as only selected wavelengths were involved. Alternatively, we used a multivariate statistical technique, PCA that takes into account the entire wavelength range, rather than a single wavelength. PCA reduces the number of variables in a higher dimensional data resolving into PC's in which the first PC accounts for the maximum variation in the dataset. The subsequent PC's represent a lower variance. With respect to tissue differentiation, a stand-alone spectroscopic technique provides a diagnostic specificity lower than the multimodal approach. For instance, using fluorescence at 378 nm and 445 nm excitation wavelengths yielded 90%/62% and 100%/64% sensitivity/specificity, while, Raman spectroscopy alone yielded 100% sensitivity and 70% specificity. Using a single spectroscopic technique, we achieved good sensitivity values but not a high specificity. Decreased specificity implies that single spectroscopic technique is not able to reduce the number of false positive rates consequently leading to a number of unnecessary biopsies. An integrated approach incorporating fluorescence at two wavelengths and Raman spectroscopy yielded 100% sensitivity and 90% specificity. This finding is supported by a previous study we conducted on skin where multimodal spectroscopy yielded 89% sensitivity and 100% specificity in discriminating melanocytic nevus and malignant melanoma 37. The ROC further endorses the best diagnostic ability of multimodal spectroscopy (AUC of 0.96) compared to individual spectroscopic approaches (AUC below 0.91).
Conclusion
The multimodal spectroscopic approach described here provides complementary information that could be a valuable tool for intra-operative guidance. This application could be relevant as it might help the surgeon better demarcating structurally abnormal tissue, leaving the normal surrounding tissues intact. Needless removal of normal brain tissues would increase the risk of subsequent neurological deficits such as speech/motor impairment and cognitive dysfunction. Optical spectroscopy can be implemented near real time without altering the regular surgical workflow. Recently, Desroches et al. 38 performed a pilot study using a handheld fiber optic probe using Raman spectroscopy for differentiating necrotic tissue during neurosurgery. We implemented a multimodal spectroscopy incorporating fluorescence and Raman spectroscopy for delineation of normal and FCD tissues in vitro. The results obtained in our study could be exploited in the near future for implementing a more compact set-up so that the device can be brought to the surgery room for in vivo measurements during neurosurgery.
Acknowledgements
The research leading to these results has received funding from Fondazione Pisa in the framework of the project “Diagnostic technology for the post-operative monitoring of pediatric brain tumors”, from the Italian Ministry for Education, University and Research in the framework of the Flagship Project NANOMAX, from the European Union Seventh Framework Programme (FP7/2007–2013) under grant agreement number 284464, from the Italian Ministry of Health (GR-2011-02349626), from Tuscany Region and EU FP7 BiophotonicsPlus projects “LighTPatcH” (Led Technology in Photo Haemostasis) and “LITE” (Laser Imaging of The Eye), and from Ente Cassa di Risparmio di Firenze, from the European Union Seventh Framework Programme FP7/2007–2013 under the project ’DESIRE' (grant agreement 602531). The authors would like to thank the operating room staff from Anna Meyer Pediatric Hospital Florence, Italy for their assistance in tissue sample collection.


