Visualizing liver anatomy, physiology and pharmacology using multiphoton microscopy
Abstract
Multiphoton microscopy (MPM) has become increasingly popular and widely used in both basic and clinical liver studies over the past few years. This technology provides insights into deep live tissues with less photobleaching and phototoxicity, which helps us to better understand the cellular morphology, microenvironment, immune responses and spatiotemporal dynamics of drugs and therapeutic cells in the healthy and diseased liver. This review summarizes the principles, opportunities, applications and limitations of MPM in hepatology. A key emphasis is on the use of fluorescence lifetime imaging (FLIM) to add additional quantification and specificity to the detection of endogenous fluorescent species in the liver as well as exogenous molecules and nanoparticles that are applied to the liver in vivo. We anticipate that in the near future MPM-FLIM will advance our understanding of the cellular and molecular mechanisms of liver diseases, and will be evaluated from bench to bedside, leading to real-time histology of human liver diseases.
Introduction
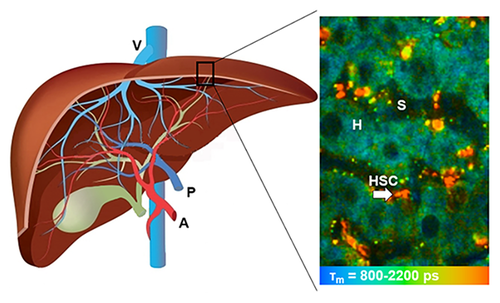
Liver is one of the most important metabolic organs of vertebrates with multiple functions. It receives oxygenated blood from the heart via the hepatic artery, and nutrient-rich blood from the gastrointestinal tract via the portal vein (Figure 1a). The blood flows through liver sinusoids (Figure 1b, terminal vessels between hepatocyte cords and lined with Kupffer cells and endothelial cells), empties into the central vein, and exits the liver from hepatic veins. Hepatocytes make up 70–85% of the liver's cell population. They are the key functional liver cells with important roles in metabolic, secretory and endocrine functions 1, 2. Kupffer cells, another type of liver cells, are specialized macrophages in the liver located on the walls of the liver sinusoids 3. Hepatic stellate cells (HSC) are pericytes located in the space of Disse, which is located between the hepatocytes and sinusoidal endothelium. Quiescent HSCs can be activated in response to liver damage, leading to collagen formation, fibrosis or cirrhosis [4]. Bile is secreted by hepatocytes, and drained into biliary ductules, which are lined with epithelial cells, then leaves the liver from the bile duct 3.

Structure of the liver. (a) Macrostructure of the liver. (b) Microscopic structure of liver sinusoid in hepatic lobules. (c) Representative TPEF image of the liver, recorded at λExc/λEm: 740/350 nm to 650 nm. (d) Representative FLIM of the liver, recorded at λExc/λEm: 740/350 nm to 450 nm. A: Hepatic artery; P: Portal vein; V: Hepatic veins; H: Hepatocyte; E: Endothelial cell; S: Sinusoid; K: Kupffer cell; D: Space of Disse; HSC: Hepatic stellate cell (arrow). Reproduced with permission 2. 2015, The Royal Society of Chemistry.
Conventional optical illumination techniques are insufficient to precisely describe the complex internal three-dimensional structure, heterogeneous cell populations and the dynamics of biological processes of the liver. The need for better imaging tools has triggered a renaissance in the development of optical-microscopy instrumentation in the past three decades. In 1990, two-photon microscopy, later also referred to as multiphoton microscopy (MPM), was pioneered by Denk et al. at Cornell University 5. This important invention enabled unprecedented quantitative deep imaging of the liver down to the molecular level. Fluorescence lifetime imaging (FLIM), first developed in 1989, was soon used in MPM in 1990s 6. This imaging technique can provide detailed information about the liver microenvironment which cannot be revealed by microscopy using fluorescence intensity. The applications of MPM and FLIM in hepatology have been discussed in several review articles. These papers focused on specific areas of MPM such as defining liver functions 7, imaging liver cancers 8, or just provided a general description of intravital imaging of the liver 9. Although numerous techniques, fluorescent dyes and proteins that favor MPM have been proposed, there are only scattered reports on the detailed applications and limitations of MPM and FLIM in hepatology. The scope of this comprehensive review is to first summarize the principles and advantages of MPM for imaging the liver systematically. Subsequently, we will evaluate the application of MPM in visualizing anatomy, defining functions and studying pharmacology of the liver, and will highlight the use of FLIM. The information discussed in this review would be useful for the development of in vivo imaging strategies for the liver, as pointed out in the final section.
Principles and advantages of MPM for imaging the liver
MPM
Fluorescence is the emission of light by a substance after absorbing light or other electromagnetic radiation. Usually the absorbed light has a shorter wavelength and higher energy than the emitted light. This is known as single-photon fluorescence that is applied in traditional fluorescence microscopy. In contrast, MPM uses pulsed longer-wavelength light to excite fluorophores in the specimen 5, 10. Two photons must meet the fluorophores simultaneously (within 10–18 s) in order to excite a fluorophore to emit a fluorescence photon with shorter wavelength and higher energy. A typical optical principle of MPM is shown in Figure 2a. MPM is considered as a revolutionary development in biological imaging because the longer-wavelength and lower-energy excitation light reduces photodamage and increases penetration depth, allowing imaging of living specimens 11. Unlike confocal microscopes, MPM does not contain pinhole apertures, allowing the detector to be placed closer to the objective to optimize collection of scattered light, and further enhancing the imaging depth.
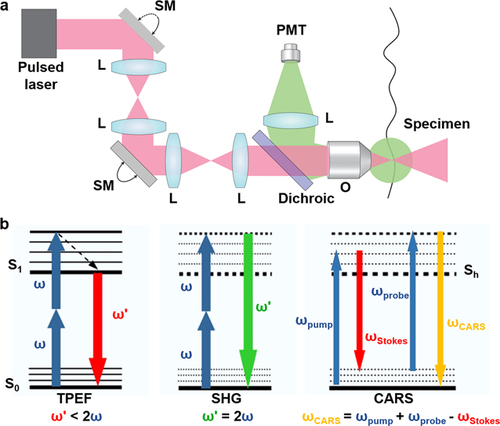
Typical optical principle of multiphoton systems and imaging modalities. (a) A typical MPM uses a raster scanning system to control the beam and a dichroic is used to separate TPEF from the excitation light and direct this fluorescence to a single-element detector such as a photomultiplier tube (PMT). (b) Energy level diagrams of TPEF, SHG and CARS imaging modalities. L: lens; SM: scan mirror; O: objective; S0: the ground energy state; S1: the excited state; Sh: the higher virtual state. Reproduced with permission 10, 12. 2013, Nature Publishing Group. 2010, Elsevier.
Imaging modality of MPM
As shown in Figure 2b, MPM can excite and detect nonlinear signals including two-photon excited fluorescence (TPEF), second harmonic generation (SHG) and coherent anti-Stokes Raman scattering (CARS) 13. The concept of TPEF is based on the idea mentioned above that two photons of lower energy can excite an electron into a state with higher energy, from which it can decay and emit a shorter-wavelength light. Each photon carries approximately half the energy necessary to excite the fluorophore 5. The most commonly used fluorophores in MPM have excitation spectra in the range of 400–500 nm, whereas the laser used to excite the TPEF lies in the 700∼1000 nm range. As shown in Table 1, a number of endogenous molecules in the liver can generate fluorescence, which is a hindrance of traditional fluorescence microscopy, yet is used as an advantage in TPEF imaging 14. The metabolic coenzymes nicotinamide adenine dinucleotide hydride (NADH) is a respiratory substrate for complex I of the mitochondrial electron transport chain, which is an endogenous fluorophore in the cytoplasm of hepatocytes. As the fluorescence excitation, emission, and lifetime of NADH and NADPH overlap, these two molecules are usually measured together by MPM coupled with FLIM (MPM-FLIM) and referred to as NAD(P)H 15. TPEF images of NAD(P)H in the liver can provide basic information of liver structure. Because NAD+, the oxidized form of NAD(P)H, has no fluorescence, changes in the fluorescence intensity of NAD(P)H can provide valuable information regarding cell metabolism. Flavin adenine dinucleotide (FAD) is only fluorescent in the oxidative states, and can provide further information of the cellular redox state 14, 16. The most common optical method for metabolic imaging is the “redox ratio,” which is the ratio of the fluorescence intensity of FAD and NAD(P)H. The redox ratio is sensitive to changes in the cellular metabolic rate and vascular oxygen supply 14, 16. A decrease in the redox ratio or the fluorescence intensity of NAD(P)H is usually observed in cancer cells or injured cells.
|
Fluorophore |
Sample |
Excitation wavelength* (nm) |
Emission wavelength (nm) |
Fluorescence lifetime (ns) |
Reference |
|---|---|---|---|---|---|
|
NAD(P)H |
Mouse and rat in vivo, human ex vivo |
740–800 |
350–490 |
0.3–0.7 (bound), 2.5–3.0 (free) |
|
|
FAD |
Rat in vivo, human ex vivo |
800 |
500–620 |
0.04–0.4 (bound), 2.3–2.8 (free) |
|
|
Elastin |
Human ex vivo |
850 |
500–550 |
1.96 |
|
|
Vitamin A |
Mouse and rat in vivo |
700–830 |
∼500 |
1.7–2.2 |
|
|
Porphyrin/ biliverdin/bilirubin |
Human ex vivo |
1230 |
670 |
0.4–1 |
|
|
Collagen SHG |
Human and rat ex vivo |
800–1230 |
1/2 laser wavelength |
No lifetime |
- * two-photon excitation
In SHG, photons with the same frequency interact with a nonlinear substance and generate new photons with half the wavelength of the initial photons 17. Since SHG is an even-order nonlinear non-absorption process, fluorophore is not required in the specimen. Only highly ordered structures without inversion symmetry are capable of emitting SHG light. Collagen, a sensitive indicator of liver fibrosis, is one of such structures.
CARS is a third-order nonlinear optical process involving multiple types of photons: a pump photon, a Stokes photon and a probe photon. These three photons interact with the sample, and generate a coherent optical signal at the anti-Stokes frequency. This signal will be enhanced when the frequency difference between the pump and the Stokes photons coincides with the frequency of a Raman resonance 18. CARS imaging is intrinsic and specific to molecular vibration, such as aliphatic C-H bonds of lipids. Thus it is ideal for detecting intracellular fat vacuoles in fatty liver tissues.
FLIM
The fluorescence lifetime is the mean time a fluorophore remains in the excited state before emitting a photon (fluorescence) and returning to the initial ground energy state. FLIM has been used as an important imaging technique in MPM, which constructs a spatial distribution map of fluorescence lifetimes from a fluorescent specimen 19. The lifetime of the fluorophore signal, rather than its intensity, is used to create the image. Figure 1d shows an example of FLIM image of normal mouse liver. This technique has the advantage of differentiating various endogenous and exogenous fluorophores in the liver tissue based on their unique lifetimes. Table 1 shows the lifetimes of major endogenous fluorophores in the normal liver. Lifetime changes of exogenous fluorophores usually reflect drug-interactions or protein-interactions, while those changes of endogenous fluorophores reflect changes in liver microenvironment, which cannot be revealed by microscopy using fluorescence intensity.
A common application of FLIM in the liver is to measure the fluorescence lifetime of NAD(P)H. NAD(P)H can exist as free or protein-bound molecules, which have similar excitation and emission wavelengths, but can be distinguished by their distinct fluorescence lifetimes. Protein-bound NAD(P)H mainly locates in mitochondrial membrane, and produces adenosine triphosphate (ATP) in aerobic conditions, while free NAD(P)H is located in the cytoplasm, involving in ATP synthesis without oxygen in glycolysis. The relative contribution of protein-bound NAD(P)H decrease in hypoxia, mainly because cellular respiration is shifted to glycolysis, producing ATP in anaerobic conditions 20, 21. The changes of lifetimes of free and protein-bound NAD(P)H also indicate altered metabolic state, as is typically observed in cell differentiation, apoptosis and necrosis 20.
Imaging liver anatomy and diagnosing liver diseases
MPM has been applied in diagnosis of almost all types of liver diseases in human beings and animals. Liver fibrosis, cancer and steatosis are the most widely studied liver diseases using MPM, which will be discussed in detail below. In addition, the MPM optical diagnostic features for hepatic ischemia-reperfusion (I/R) injury were reported to include reduced fluorescence and cellular vacuolation of hepatocytes, and heterogeneous spread of damage over the liver 22. Acetaminophen (APAP) induced liver injury23 and hepatitis C virus infections 24 have also been visualized using fluorescent dyes or sensors for MPM.
Normal liver
The capsule of the liver, known as Glisson's capsule, is a fibrous connective membrane mainly composed of collagen and elastin fibers. It encompasses the hepatic parenchyma, and contributes significantly to the global mechanical behavior of the liver. MPM has been used to characterize the shape, geometry and microstructure arrangement of the capsule using TPEF and SHG 25, 26. The obtained images revealed that the collagen/elastin ratio increased from the inner to the outer surface of the liver capsule. The microstructure and strain fields of the capsule present heterogeneity among different layers. Reorientation occurs in fiber layers from the inner to the outer surface of the liver capsule.
The cellular structure of liver can be imaged as deep as 250 μm below the liver capsule by MPM. As shown in Figures 1, 3 and 4, hepatocyte cords with bright autofluorescence of NAD(P)H are separated by the blood-filled dark sinusoids in TPEF imaging. The stellate cells are smaller in size but have strong vitamin A-associated autofluorescence and a longer lifetime than that of NAD(P)H 21. Fenestrations are transcellular pores in endothelial cells that facilitate transfer of substrates between blood and the extravascular compartment. Liver sinusoidal endothelial cells could be stained by 6-lauroyl-2-dimethylaminonaphthalene (LAURDAN) to visualize the number and size of fenestrations using MPM 27. Recently, more specific fluorescence-conjugated antibodies (such as anti-PECAM1/CD31 or anti-VCAM-1/CD106) have been developed to stain viable liver sinusoidal endothelium 9, 28.
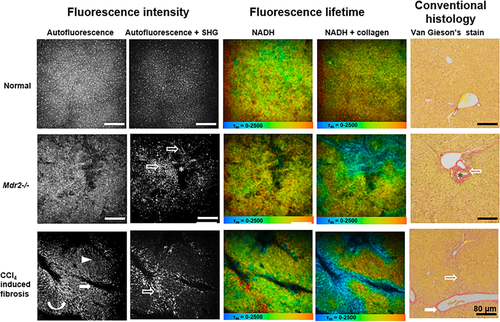
MPM-FLIM and conventional histopathological images of liver in healthy mice, Mdr2−/− mice and mice with CCl4 induced liver fibrosis at low magnification (10×) (scale bar: 80 μm). Autofluorescence intensity image was recorded at λExc/λEm: 740/350 nm to 650 nm. Autofluorescence and SHG intensity image was recorded at λExc/λEm: 800/350 nm to 650 nm. Pseudocolored fluorescence lifetime image for NADH (τm: 0–2500 ps; blue-green-red) was recorded at λExc/λEm: 740/350 nm to 450 nm. Pseudocolored fluorescence lifetime image for NADH and collagen (τm: 0–2500 ps; blue-green-red) was recorded at λExc/λEm: 800/350 nm to 450 nm. Conventional histological images were collected on Van Gieson's stained section. Opened arrows indicate collagen; asterisks indicate bile duct; curved arrow indicates bridges formed by stellate cells; filled arrows indicate postsinusoidal venules; and arrow head indicates injury of hepatocytes. MPM-FLIM images of unfixed live livers were collected within 30 min after surgical procedures started, and 2 days after the last CCl4 injection. Reproduced with permission 21. 2015. OSA Publishing.
Liver fibrosis
In liver fibrosis, injury of hepatocytes can be observed as reduced fluorescence of NAD(P)H in TPEF imaging (Figures 3 and 4) 21. Moreover, FLIM shows changes in cellular metabolic pathways as indicated by the decrease of lifetimes of free and protein-bound NAD(P)H, and contribution of protein-bound NAD(P)H (Figure 4). The livers of mice receiving CCl4 for 5 weeks showed signs of postsinusoidal venules. HSCs can be detected using real-time histology by their distinct vitamin A-associated autofluorescence. Inhomogeneous distribution of stellate cells was found in a mouse model of chronic chemical hepatic injury and advanced liver fibrosis 21. The stellate cells accumulated in centrilobular region around central veins, and reduced in midzonal regions. The regional redistribution of stellate cells formed bridges between postsinusoidal venules in some liver lobules. The morphology and distribution of stellate cells imaged by MPM provide valuable information about cellular microenvironment during development of liver fibrosis, which cannot be obtained from conventional histology.
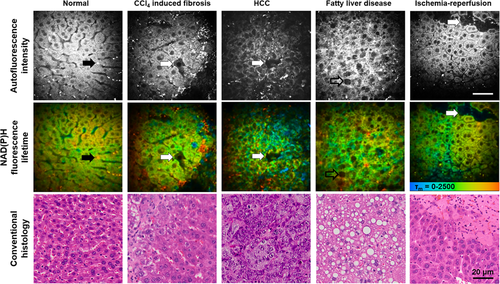
MPM-FLIM and conventional histopathological images of the mouse liver in health and disease at high magnification (40×) (Scale bar: 20 μm.). Autofluorescence intensity image was recorded at λExc/λEm: 740/350 nm to 650 nm. Pseudocolored fluorescence lifetime image (τm: 0–2500 ps; blue-green-red) was recorded at λExc/λEm: 740/350 nm to 450 nm. Black arrow indicates stellate cells associated autofluorescence; white arrows indicate cellular necrosis; and opened arrow indicates intracellular fat vacuole. MPM-FLIM images of unfixed live livers were collected within 30 min after surgical procedures started. Conventional histological images were collected on H&E stained section. Reproduced with permission 21. 2015. OSA Publishing.
SHG imaging has been performed on liver biopsies taken from patients with liver fibrosis or cirrhosis 21, 29, rodents with CCl4 induced chronic injury and fibrosis 21, and cholangitis and biliary fibrosis (Mdr2−/− and bile duct ligation) 21, 29. MPM can clearly reveal the increase of the collagen amount during fibrosis progression and offer the possibility of an accurate characterization of fibrosis without specific staining. As shown in Figure 3, collagen deposition was obvious in the centrilobular region and pseudolobular formation was evident in in CCl4 induced fibrotic liver. While the livers with biliary fibrosis of 20-week-old Mdr2−/− mice showed intercellular fibrosis, especially around the medium sized to large bile ducts of the periportal region. Two quantification systems, Fibro-C-Index [29] and Fibrosis-SHG index (Figure 5) 12 have been developed for the assessment of liver fibrosis using MPM. Both systems have been compared and validated by pathological examination, indicating the high reliability and sensitivity for potential application of MPM in clinical diagnosis of liver fibrosis. Since collagen SHG response is effectively instantaneous 30, the mean lifetimes decreased significantly in fibrotic liver at excitation of 800 nm (containing both NAD(P)H and collagen signals), allowing the discrimination from normal liver (Figure 3). MPM-FLIM would be a powerful tool providing realtime histology which combines morphology and quantitative evaluation of liver fibrosis simultaneously.
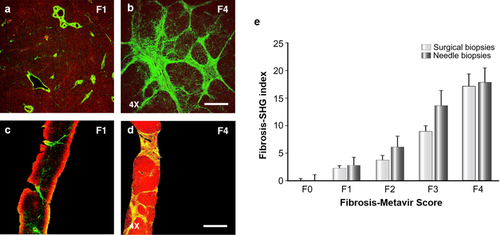
Collagen quantification in human liver fibrosis using MPM. (a–d) TPEF/SHG images of the fibrosis (F0-Metavir grade) and cirrhotic (F4-Metavir grade) liver samples from surgical (a) and needle biopsies (b). F-Metavir grades have been determined by a pathologist using the Metavir scoring system from conventional histology. Red color represents the TPEF signal of hepatocytes and green color represents the SHG signal of collagen fibers. Laser intensity was set at 100 mW and wavelength was fixed at 810 nm. Scale bar: 1 mm. (e) Standardized Fibrosis-SHG indexes determined for each F-Metavir stage in 46 surgical and 73 needle biopsies. Histograms indicate the average indexes ± SEM after normalization. Reproduced with permission 12. 2010, Elsevier.
Liver cancer
The most common type of primary liver cancer is hepatocellular carcinoma (HCC). The MPM optical diagnostic features for HCC have been established and validated in different studies 21, 31. High-resolution MPM images have clearly demonstrated extensive cell heterogeneity characterized by irregular size and shape, increased nuclear to cytoplasmic ratio, decreased autofluorescence of NAD(P)H, central necrosis and intercellular collagen in HCC (Figure 4). Yan et al. performed a pilot preclinical study investigating 224 surgical specimens including benign and malignant liver lesions such as hemangioma, focal nodular hyperplasia, HCC, cholangiocarcinoma, and colorectal cancer liver metastases. They found that MPM is able to diagnose liver cancer and differentiate benign and malignant liver lesions with high sensitivity, specificity and accuracy 31.
In FLIM images, the cellular lifetimes of free and protein-bound NAD(P)H, and contribution of protein-bound NAD(P)H significantly decreased in HCC, which is consistent with hypoxia and the increased levels of glycolysis in neoplastic cells (Figure 4). In poorly-differentiated HCC sections, an increased cellular lifetime of red fluorescent pigments including porphyrins, biliverdins and bilirubins, and scattered short-lifetime spots can also be detected non-uniformly, which may represent the inflammation-induced infiltrated leukocytes 32. Thus, MPM-FLIM has the potential to become a powerful clinical tool in the future to perform real-time diagnosis of liver cancer and differentiation of benign and malignant liver lesions.
Liver steatosis
In liver with steatosis, black intracellular fat vacuole can be detected as spots with significantly reduced fluorescence of NAD(P)H (darker than the nuclei) in TPEF images (Figure 4) 21. The cytoplasm of hepatocytes has a sponge-like appearance because of numerous small black intracellular fat inclusions in mice after feeding a high fat diet for 14 days (Figure 4). Compared to TPEF imaging, CARS imaging can specifically visualize fat droplets in fresh liver samples and extract the fat content through image analysis 33. Similarly to the way using SHG to quantify the collagen amount in the fibrotic liver, CARS imaging has been used to quantitatively assess the fat in rat livers with steatosis 33. The content of hepatic fat measured by MPM has been correlated well with that determined by biochemical analysis. This staining free technique has the potential for early diagnosis and rapid detection of liver steatosis.
Imaging liver physiology and defining liver function
In the past two decades, the development of MPM has resulted in an explosion of mechanistic investigation of liver physiology down to the molecular level. Compared to conventional microscopy, MPM has an important advantage of intravital imaging, which can enhance our understanding of liver physiology and function, and provide new insights into pathogenesis and disease control mechanisms. Table 2 shows the characteristics and functions of fluorescent probes commonly used in MPM imaging of the liver physiology.
|
Probe |
Molecular weight (g/mol) |
Excitation wavelength (nm) |
Emission wavelength (nm) |
Function |
References |
|---|---|---|---|---|---|
|
RH 123 |
380.82 |
820 |
500–550 |
Indicates mitochondrial polarization Indicates P-gp function |
|
|
Calcein |
622.53 |
720 |
500–550 |
Indicates MPT |
|
|
Sodium fluorescein |
332.31 |
920 |
515–620 |
Indicates hepatic micro circulation and Oatp function |
|
|
RITC-dextran |
70,000 |
920 |
573 |
Labels sinusoids Labels abnormal hepato cytes |
|
|
CFDA |
460.39 |
780 |
520 |
Indicates hepatobiliary excretion function |
|
|
TRITC-labeled albumin |
443.52 |
488* |
561 |
Labels sinusoids |
|
|
Rhodamine 6G |
479,02 |
530* |
556 |
Labels mitochondria |
|
|
TMRM |
500.93 |
548* |
574 |
Indicates mitochondrial polarization |
|
|
FITC-dextran |
70,000 |
920 |
518 |
Labels sinusoids |
|
|
DAPI |
277.32 |
720 |
461 |
Labels cell nuclei |
|
|
AlexaFluor488 |
570.48 |
496* |
519 |
Labels antibody |
|
|
PI |
668 |
920 |
608 |
Indicates cell viability |
|
|
LAURDAN |
353.54 |
800 |
423–483 |
Labels liver sinusoidal endothelial cells |
|
|
PE-coupled anti-PECAM-1 |
– |
565 or 498* |
573 |
Labels liver sinusoidal endothelial cells |
|
|
Texas red-dextran |
70,000 |
596* |
615 |
Labels macrophages |
|
|
PD nanobeads |
– |
545* |
575 |
Labels macrophages |
|
|
Carboxylated latex particles |
– |
580* |
605 |
Labels macrophages |
- * single-photon excitation, RH 123: Rhodamine 123, RITC-dextran: Rhodamine B isothiocyanate-dextran, CFDA: Carboxyfluorescein diacetate, TRITC: tetramethylrhodamine isothiocyanate, TMRM: tetramethylrhodamine methylester, FITC-dextran: Fluorescein isothiocyanate-dextran, DAPI: 4′,6-diamidino-2-phenylindole, PI: Propidium iodide, LAURDAN: 6-lauroyl-2-dimethylaminonaphthalene, PE: phycoerythrin, PECAM-1: platelet-endothelial cell adhesion molecule-1, MPT: Mitochondrial permeability transition.
Mitochondrial physiology
The mitochondrion is a double membrane-bound organelle found in most eukaryotic cells. The mitochondrial permeability transition (MPT) is defined as an increase in the permeability of the mitochondrial membranes to molecules less than 1500 Dalton 34. MPT results from the opening of MPT pores located in the inner membrane of the mitochondria under certain pathological conditions such as hepatic I/R injury, leading to mitochondrial depolarization and swelling, and cell death through apoptosis or necrosis. MPM has been applied to visualize the mitochondrial physiology using different fluorescent probes. Propidium iodide (PI) labels the nuclei of nonviable cells, and can be used to visualize the overall cell viability 35. The opening of MPT pores could be assessed using calcein acetoxymethyl ester in TPEF imaging. Calcein is a fluorescent molecule that cannot be taken up by mitochondria after intravenous injection, resulting in the mitochondria appearing as dark voids in the hepatocytes in the normal liver 36. In mice with hepatic I/R injury or bile duct ligation, the opening of MPT pores in hepatocytes can be revealed by the appearance of calcein fluorescence in the mitochondria matrix space, which are dark voids in normal hepatocytes 37, 38. Rhodamine 123 (Rh123) is another commonly used fluorescent dye in TPEF imaging to visualize polarized mitochondria 35. After intravenous injection, Rh123 selectively accumulates in polarized mitochondria of the healthy liver, resulting in bright punctate fluorescence of Rh123 in hepatocytes. While the liver with hepatic I/R injury 38, 39 or obstructive cholestasis 37 shows dim diffuse of Rh123 fluorescence, denoting that many mitochondria did not take up Rh123 because of depolarization. Thus, MPM can be employed to investigate the drug efficacy. As shown in Figure 6, the effect of NIM811, an MPT inhibitor, was evaluated using fluorescent probes of PI and Rh123 to visualize the attenuation of mitochondrial depolarization and MPT onset in APAP induced liver injury 40.
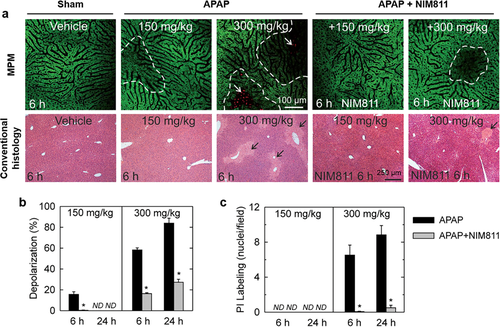
In vivo visualization of mitochondrial depolarization and cell death in mouse liver using MPM. (a) NIM811 decreases hepatocellular cell death and/or mitochondrial depolarization after both low and high dose APAP. NIM811 (10 mg/kg) was administered by gavage 1 h before APAP. Top and bottom rows show intravital MPM and conventional histopathological images, respectively. Punctate labeling with Rh123 signifies mitochondrial polarization, whereas dim diffuse Rh123 staining denotes mitochondrial depolarization (dashed line). Nuclear PI labeling signifies cell death (white arrows). Conventional histological images were collected on H&E stained section. Black arrows identify necrotic areas. (b and c): Protection by NIM811 against depolarization and cell death induced by APAP. Percent area of mitochondrial depolarization is plotted for various treatment groups (b). PI-labeled nuclei were also counted (c). N.D., not detectable; * P < 0.05. Reproduced with permission 40. 2016, Oxford University Press.
Functions of hepatic enzymes and transporters
Hepatic enzymes and transporters play a significant role in drug metabolism and biliary excretion. In most studies, functions of hepatic transporters are evaluated in cultured cell system or isolated perfused liver 41. However, both methods have obvious disadvantages such as limited biological significance in cell lines and indirect analysis of transport processes in perfused liver models 42. Using specific fluorescent probes, MPM allows direct measurement of enzyme and transporter functions. Recently, a two-photon excited ratiometric fluorescent probe has been developed for sensitive and selective detection of CYP1A, one of the most important phase I drug-metabolizing enzymes 34. TPEF imaging can directly assess the functions of hepatic transporters by observing the in vivo distribution kinetics of specific fluorescent substrates in the liver 42-44. For example, the functions of biliary canalicular transporter MDR1 (P-glycoprotein, P-gp) and basolateral transporter organic anion transporting polypeptide (Oatp) have been evaluated using their specific substrates Rh123 45 and sodium fluorescein 46. In hepatic I/R injury, the uptake and clearance of fluorescein were found to be delayed, probably due to the impaired hepatic microcirculation and the dysfunction of efflux transporters 47. And the impaired P-gp function can be revealed by the increased fluorescence intensity of Rh123 in the hepatocytes with I/R injury compared to sham 7, 44.
Hepatobiliary excretory function
Bile excretion is part of hepatobiliary function. The liver is responsible for the uptake, processing, and excretion of many exogenous or endogenous substances into bile by hepatocytes 48. Carboxyfluorescein diacetate (CFDA) has been used to define the hepatobiliary excretory function of healthy mice, mice with APAP-induced liver injury and with obstructive cholestasis 48-50. CFDA is a nonfluorogenic substance and can be hydrolyzed by esterase into fluorogenic carboxyfluorescein (CF) after taken up by hepatocytes. The kinetics of CF can be determined in hepatocytes and sinusoids separately based on its fluorescence intensity. The delayed clearance of CF from hepatocytes into bile canaliculi was observed in mice with bile duct ligation. An active machinery operating backflow of bile containing CF from hepatocytes into sinusoids was found in mice with obstructive cholestasis and APAP-induced liver injury 48, 50, 51.
In addition, fluorescein has also been used to reflect the hepatobiliary excretory function. The uptake and clearance of fluorescein has also been found to be delayed in mice with liver steatosis and hepatic I/R injury using TPEF imaging, and confirmed by FLIM 47, 52. Conventional methods for studying the hepatobiliary excretory function usually involve biochemical analyses of contents in the bile, liver, blood or urine, while MPM enables intravital imaging of fluorescent probes in the liver at the subcellular level. This imaging technique can provide further quantitative measures of metabolic and hepatobiliary excretory function, and hence extend the qualitative liver function tests now available.
Cell physiology and migration
MPM has been applied to study the cell migration and function in the liver in a variety of disease states including HCC, colorectal cancer liver metastases, hepatic I/R injury, parasitic infection and liver regeneration. Kupffer cells can be labeled in vivo by intravenous injection of red fluorescent carboxylated latex particles 53, 70-kDa Texas red-dextran 54 and PD nanobeads (545 marked) 55 due to their macrophage phagocytic ability. After labelling, TPEF imaging of the liver reveals that Kupffer cells are the main cellular scavenger for circulating particle-associated antigens in homeostasis 53. These cells are the only detectable population of mononuclear phagocytes within granulomas induced by Leishmania donovani infection 55. Kupffer cells do not migrate to interact with vessels while infiltrating monocytes interact directly with sinusoids after partial hepatectomy 54.
Leukocytes are the cells of the immune system that are involved in protecting the body against both disease and foreign invaders. These cells can be further divided into five main types: neutrophils, eosinophils, basophils, lymphocytes, and monocytes 56. Green fluorescent protein (GFP)-expressing leukocytes were used for MPM imaging in almost all the studies, because most leukocytes lack the phagocytic ability and are difficult to be labelled using fluorescent dyes 53, 57-59. The GFP-expressing tumor-infiltrating leukocyte adhesion and migration in HCC have been visualized in vivo at the single-cell level 57. Their migration was found in a random manner with frequently changed infiltrating directions. In hepatic I/R injury, MPM successfully detected the numbers, velocity, and morphology of recruited neutrophils in vivo, and has potential for a wide range of applications to investigate the mechanism of I/R injury 58.
Recently, MPM has been used to detect the colorectal cancer liver metastases in living mice taking its advantages of imaging target organs for a long period at a high magnification and in the deep depths from the surface 8, 60. An animal model of colorectal cancer liver metastases was developed by inoculating red fluorescent protein (RFP) expressing colorectal cancer cells into the spleens of GFP transgenic mice. As shown in Figure 7, the multi-stage tumor metastatic processes have been visualized in this mouse model, including tumor cell arrest, tumor cell-platelet interaction, tumor cell-leukocyte interaction, and metastatic colonization in the liver 8, 61. These studies are good examples of the applications of MPM as a tool for basic investigation.
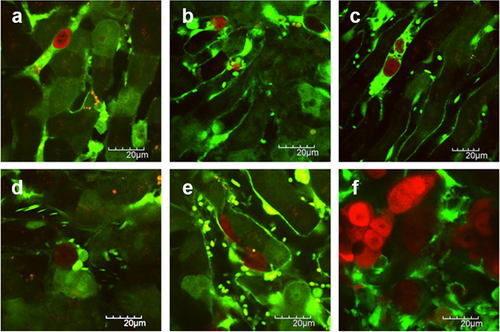
Visualization of the liver metastatic process of colon cancer cells. (a) Colon cancer cells arrest in the sinusoid. (b) Tumor cell-platelet interaction. (c) Platelets aggregation to the tumor cell. (d) Tumor cell-leukocyte interaction. (e) Tumor cell extravasation. (f) Liver metastatic colonization of colon cancer cells. Red color represents the colon cancer cells and green color represents the structure of the liver and blood vessels. Reproduced with permission 8, 61. 2014. e-Century Publishing Corporation. 2012. Koji Tanaka et al.
Pharmacokinetic imaging in the liver
A precise method of understanding and analyzing pharmacokinetic events is to directly observe the distribution, metabolism and excretion of diagnostic or therapeutic agents in space and over time. MPM provides a powerful tool to spatiotemporally monitor the transport of molecules, nanoparticles and biological agents in the liver at the cellular level for pharmacokinetic analysis.
Molecule imaging
The pharmacokinetics of fluorescein and RH123 has been investigated by MPM in rat liver 43, 44, 62. Since MPM allows simultaneous visualization of the organ autofluorescence and molecule fluorescence, it is able to determine the levels of fluorescent molecules in the sinusoids, hepatocytes and the bile respectively (Figure 8a), which enables dividing the liver into subcompartments for pharmacokinetic modelling, as seen in Figure 8b. A physiologically based pharmacokinetic (PBPK) model has been developed to characterize the kinetics of fluorescein at the single-cell resolution in health and diseased liver in vivo 52. Using the same intravital imaging technique, half-life of Rh123 is calculated by fitting the decay of fluorescence intensity in hepatocytes vs. time profile into the exponential equation 44.
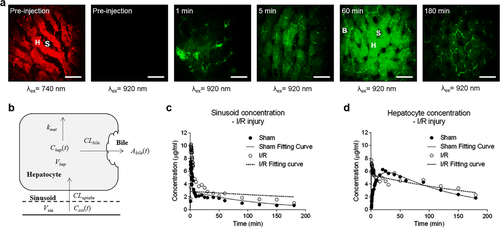
Pharmacokinetic imaging of fluorescein in the liver at the cellular level. (a) TPEF images of fluorescein in normal rat livers at various time points after bolus injection via jugular vein with high magnification (40×) (scale bar: 20 μm). The symbol S indicates sinusoid, H indicates hepatocyte and B indicates bile duct. Red color represents autofluorescence of liver and green color represents fluorescein. (b) Schematic overview of compartmental model describing hepatic uptake and elimination kinetics of fluorescein. (c and d) Fluorescein concentration-time profiles in the sinusoid and hepatocyte compartments. Reproduced with permission 52, 63. 2015. American Society for Pharmacology and Experimental Therapeutics. 2014. John Wiley and Sons.
Furthermore, FLIM imaging adds the capability of differentiating fluorescent molecules from biological tissues based on their fluorescent lifetimes. For example, fluorescein and its metabolite fluorescein mono-glucuronide (FG) have an overlapping excitation and emission spectra 62, which make them to be hardly distinguished using TPEF imaging. However, the fluorescence lifetime of fluorescein and metabolite FG is reported to be 3.8 ns to 4.1 ns and 2.3 ns, respectively 62, which can be differentiated by FLIM. The in vivo distribution and metabolism of fluorescein has been studied based on the lifetime change in different zonation of rat liver using MPM-FLIM, showing the mean lifetimes of fluorescein and FG decease over time after injection 62. Therefore, the combination of MPM and FLIM provides a novel technique for studying real-time distribution and metabolism of fluorescent molecules in the liver at a high resolution.
MPM has also been used to real-time evaluate the chemotherapy response on the colorectal cancer liver metastases 64. After administration of 5-fluorouracil or irinotecan, tumor cell fragmentation, condensation, swelling and intracellular vacuoles were observed under time-series intravital TPEF imaging. A pharmacokinetic/pharmacodynamic model could be developed based on these observations.
Nanoparticle imaging
Nanoparticles (NPs) are defined as spherical (or quasispherical) particles with a diameter less than 100 nm, but often refer to the range up to 300–500 nm 65. Since NPs have unique physiochemical properties, and have been intensively applied to drug and gene delivery, imaging and diagnosis 66, it is important to investigate their pharmacokinetics for clinical applications. Although many studies have reported the organ-level distribution of NPs, very few have addressed their disposition in organs at the cellular level 63. The uptake, distribution and excretion of fluorescent or fluorescent labelled NPs can be investigated using TPEF imaging at the single cell resolution 67-70. Polymeric NPs with high bond repetition rate are highly suitable for CARS imaging because the CARS signal scales quadratically with the bond concentration 70.
The in vivo spatiotemporal disposition of quantum dots (QDs), a typical example of long-circulating NPs, has been intensively explored in the liver at a single cell level using MPM 63, 71. The concentration profile of QDs determined from the QD fluorescence intensity in sinusoids correlates well with that in the plasma measured by inductively coupled plasma mass spectrometry (ICP-MS) 63. This suggests that MPM may be used as a semi-quantitative method to investigate the distribution of fluorescent NPs in living organisms, particularly in the initial distribution phase (0.5 min to 5 min), when collecting blood samples is difficult. Furthermore, the enriched quantitative data obtained from MPM imaging, especially at early time, allows more sophisticated pharmacokinetic modelling to reveal more detailed information of NP disposition, while blood sampling and ICP-MS analysis can only provide limited data for modelling 63. As shown in Figure 9, the QD sub-organ distribution visualized by TPEF imaging was further confirmed by FLIM imaging based on the change of average fluorescence lifetime. Since the fluorescence lifetime of QDs is much longer than that of liver cells, the increased fluorescence lifetime in the sinusoid but not in hepatocytes after QDs injection confirmed that these negatively charged QDs predominantly distributed in the sinusoids 63. Thus, even if the excitation and emission spectra of a fluorophore overlap with those of the background, it can still be distinguished based on different fluorescence lifetimes.
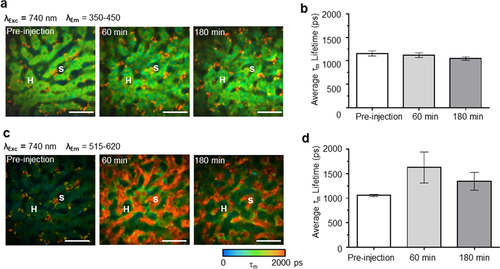
FLIM images of representative rat liver before, 60 min and 180 min after QD bolus injection in emission channel of 350–450 nm (a) and 515–620 nm (c). The pseudocolor is based on the average fluorescence lifetime τm (0–2000 ps; blue-green-red). (The symbol S indicates sinusoid, H indicates hepatocyte, scale bar: 20 μm). The average τm values at different time points before and after QDs injection are displayed in (b) (in channel of 350–450 nm) and (d) (in channel of 515–620 nm). The error bar indicates standard deviation (n = 3). Reproduced with permission 63. 2014. John Wiley and Sons.
Therapeutic cell imaging
Cell therapy has emerged as an evolutionary therapeutic force especially for diseases not curable by traditional therapeutics. Mesenchymal stem cell (MSC) is one of the most promising and widely used therapeutic cells for many debilitating diseases including liver cirrhosis, diabetes, spinal cord injury and myocardial infarction. Recently, a whole body PBPK model has been developed based on the organ disposition and cell-tissue interactions of GFP-expressing MSCs visualized by MPM 72. This imaging technique opens up a new window for more in-depth investigation about the disposition of molecules, nanoparticles and biological agents in the liver and other organs to understand their in vivo pharmacokinetics and pharmacodynamics.
Summary, limitation and future direction
A better understanding of the liver anatomy, physiology and pharmacology is necessary for developing new diagnostic and therapeutic strategies for liver diseases. This fundamental knowledge can be obtained using various techniques, among which the dynamic imaging tools provided by MPM have emerged as a very powerful option to researchers. FLIM adds the abilities of MPM to detect environmental changes and differentiate fluorophores from biological background according to their lifetimes. As summarized in this review, MPM-FLIM has been employed for both ex vivo or in vivo imaging of the liver. Intravital MPM preserves physiological conditions more faithfully, but it is a demanding technique that requires dedicated personnel. Although most of the aforementioned researches are based on animal studies, MPM has already been applied to clinical settings to diagnose and assess liver diseases.
Limited infiltration depth is one of the most significant limitations of MPM. Normally, the imaging depth is hundreds of micrometers in MPM. Thus early diseases arising deep in the liver tissue are difficult to be diagnosed with this technique. We anticipate that in the near future the penetration depths of MPM will be further increased, and new infrared dyes will be developed with longer excitation wavelengths that penetrate more deeply due to less absorption and scattering. Another limitation is that in vivo MPM imaging of the liver can only be achieved after surgical exposure, which grossly impedes its application in humans. Miniaturized laser scanning microscope has been developed, which allows minimal invasive imaging of the liver through keyhole incisions 73. Endoscope coupled with MPM has also been developed 74, which can image the liver through small surgical incision or intrahepatic bile duct as endoscopic retrograde cholangiopancreatography. These minimal invasive imaging techniques have provided the possibility of in vivo imaging the human liver. Therefore, we anticipate that in the near future MPM will be evaluated from bench to bedside, and especially be applied to endoscopic or laparoscopic systems, leading to a deep understanding of the anatomy, physiology and pharmacology of the human liver.
Acknowledgements
This work was supported by Graduate School International Travel Award of The University of Queensland, grants from Translational Australian Clinical Toxicology (TACT) Program and National Health and Medical Research Council (APP1049979 and APP1055176).


