Formulation and evaluation of repurposed ketoconazole-loaded transferosomal gel for enhanced trichogenic effects
Abstract
This study was focused to formulate and optimize transferosomes encapsulating ketoconazole (KTZ) for its repurposed use as a hair growth promoting agent. Ketoconazole exerts trichogenic effect in patients with androgenic alopecia androgen by acting on receptors present in keratinocytes and sebocytes of the scalp. This necessitates the penetration of ketoconazole into deep epidermal and dermal layers for exerting trichogenic effect. Transferosomes have been reported to improve drug penetration owing to their deformable vesicular structure. Thus, in the present work, transferosomal gel loaded with ketoconazole was developed with the intention to enhance drug permeation and improved hair proliferation activity. Solvent evaporation method has been adopted for the formulation of transferosomes and then optimized by quality by design approach. KTZ-TF (ketoconazole-transferosomes) were assessed for particle size, entrapment efficiency (%EE), surface charge, and morphology. The optimized KTZ-TF formulation demonstrated particle size of 151.22 ± 1.3 nm, PDI index of 0.191 ± 0.034, and ζ potential of –33.05 ± 01.3 mV, respectively. The developed formulation was further added into gel and compared with commercially available product. It was concluded that KTZ-TF gels showed control drug release (89.1 ± 2.12%) for 9 h. The in vivo skin irritation test demonstrated that the gel formulation caused minimal irritation and was well accepted by the scalp. In vivo qualitative hair growth activity demonstrated improved hair growth with the developed formulation in comparison to marketed KTZ. Histopathological studies also corroborated the findings through demonstrating increase in number of hair follicles. Hence, this study concluded that ketoconazole-loaded transferosomes are efficacious in hair growth activity.
1 INTRODUCTION
Androgenic alopecia (AGA), referred to as as male pattern baldness, is an ailment driven by presence of androgens. Primary androgen in males is testosterone, which is converted to a more active dihydrotestosterone in the hair follicles of AGA patients via Type II 5α reductase enzyme.1 Dihydrotestosterone progressively diminishes the anagen phase (growth phase of hair growth cycle), bringing about reduction of hair follicles size and ultimately leading to hair loss.2 The treatments approved by FDA for AGA consist of topical minoxidil, oral finasteride, and low-level light therapy.3 However, these treatments come with certain drawbacks. Topical minoxidil, causes hypersensitive skin reaction, skin irritation, scalp sensitivity and excessive facial hair growth.4 Oral therapy of finasteride is associated with orthostatic hypotension, dizziness, impotence, abnormal ejaculation decreased libido.5 This necessitates the need for alternative therapies for the treatment of AGA.
Drug Repurposing is an approach, in which drugs already approved by regulatory authorities for particular disease diagnose is repurposed for the treatment of another disease.6 Repurposing is economical and more efficient method because the clinical and nonclinical trials which shows safety and efficacy of these drugs have already been conducted.7 Moreover, the risk of failure is less for development of a repurposed drugs in comparison to the development of an entirely new active ingredient, as the safety and efficacy studies (which account for almost 45% failure cases) have already been done. Furthermore, the time line for drug development process is shortened by 5–7 years.8
Ketoconazole (KTZ), a conventional antifungal agent, has been repurposed for the treatment of AGA. KTZ has been shown to enhance hair volume, size, and balance of active hair follicles in patients with AGA. It exerts trichogenic effect in AGA patients via both androgenic and nonandrogenic pathways. Studies suggest that KTZ acts on the androgen receptors present in keratinocytes and sebocytes of the scalp. This necessitates topical treatment of KTZ for effective hair growth activity. Furthermore, skin papilla present in dermis are the primary targets for androgens in hair follicles, prompting a need for deeper penetration of KTZ into scalp for better efficacy.9 However, KTZ suffers from the drawbacks of limited water miscibility (17 µg/mL at 25°C) and relatively large molar mass (531.44 Da), which results in poor dermal absorption. The presently available formulations like shampoos and ointments lack sufficient penetration and contact time with scalp. Hence, there is a need for novel therapeutic strategies for better penetration and therapeutic efficacy.10
Nanolipidic formulations like transferosomes have been extensively used for achieving greater penetration across tissue layers owing to their deformable nature. These elastic, deformable systems consist of phospholipid bilayer and an edge activator.11 The inclusion of phospholipid and edge activator in transferosomes makes the vesicular layer deformable and flexible.12 Phospholipids like soya and egg lecithin, phosphatidylcholine have structure similar to cell membrane and hence are biomimicing and biocompatible. Edge activators, like cholesterol, sodium cholate, Tween 80, and Span 80 destabilize the phospholipid bilayer, making the membrane more flexible which helps the transferosomes to penetrate the skin in a better way. It has been reported that transferosomes smaller than 300 nm are 5–8 times more resilient and adaptable elastic and flexible than liposomes.12 Transferosmes have been explored for enhancing the permeation of a variety of drugs including vancomycin,13 fluconazole,14 felodipine,15 tacrolimus,16 etc.
In light of the above facts, the existing study attempts to improve the hair growth activity and skin permeability of KTZ via development of transferosomal gel formulation. A quality by design (QbD) methodology was utilized for optimization of transferosomal formulation. The transferosomes were evaluated for deformability and skin permeability. In vivo skin irritation and hair growth studies comparing the developed transferosomal gel with commercially available KTZ preparation were also carried out.
2 MATERIALS AND METHODS
2.1 Materials
Ketoconazole was acquired from Harman Finochem Ltd., India. Soya lecithin was obtained from VAV Life sciences, India. Span 80 was procured from Qualikems Fine Chem Pvt. Ltd., Vadodara and chloroform, methanol, and ethanol were obtained from Fisher Scientific India Pvt. Ltd.
3 METHODS
3.1 Preparation of calibration curve
A 100 µg/mL stock solution of KTZ was prepared by solubilizing adequate amount of drug in minimum quantity of methanol followed by volume make up with phosphate buffer pH 7.4. Dilutions were prepared in the range 2–10 µg/mL by suitable dilution with buffer. Absorbance of these solutions was recorded at 248 nm using UV-visible spectrophotometer and calibration curve was constructed. From the calibration curve intercept, slope, and the correlation coefficient were obtained.17
3.2 Formulation using QbD approach
3.2.1 Discernment of quality target product profile (QTTP)
The QTPP serves as the initial stage in the development of a formulation as per the QbD principles. For the ketoconazole transferosome formulation, the QTTP was established to optimize the therapeutic performance of the formulation, aiming to provide maximum therapeutic benefits to patients. The QTTP outlined for KTZ-TF (Ketoconazole loaded transferosomes) included essential quality attributes like type of formulation, strength, route, and product stability.18
3.2.2 Discernment of critical material attributes (CMA) and critical process parameters (CPP)
Critical material and process variables are vital in ensuring the effective achievement of Critical Quality Attributes (CQAs). These three concepts can be viewed as the foundational elements of the QTPP, forming the basis of the QbD approach. In this context, particle size (PS), entrapment efficiency (%EE), and zeta potential were identified as CQAs.19
3.2.3 Risk assessment
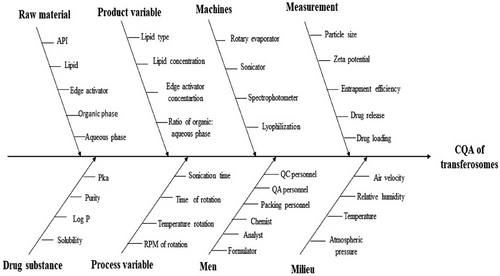
Critical Quality Attributes (CQAs) were discerned, and comprehensive risk estimation was carried out to for identification of critical material parameters and process parameters influencing CQAs. An Ishikawa fishbone diagram was developed to explore potential cause and effect relationships among various process and product variables and the selected CQAs. Afterward, every single variable influencing the CQAs was designated as having low, medium, or high risk (minimal, moderate, significant), and a risk estimation matrix was constructed.20
3.2.4 Preparation of transferosomal formulation
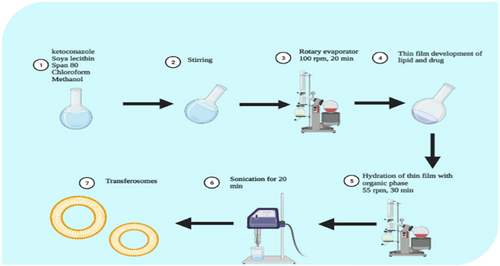
Thin film hydration methodology was used to prepare formulation.21 Figure 1 gives a pictorial view of the preparation method. Briefly, phospholipid and Edge activator were solubilized in Methanol and Chloroform (1:2). The round bottom flask was mounted on the rotatory evaporator (Perfit India VP50D, India) to remove the organic solvent at rotation speed of 55 ± 2°C and 100 rpm to get a uniform thin dry film. It was left overnight at room temperature for removal of trace solvents. Afterward, the film was hydrated with ethanol:water (7:3) on rotatory evaporator at 55 rpm at a temperature of 60 ± 2°C. The resulting transferosomes were sonicated (Skymen ultrasonic bath sonicator F2M197B, UK) for 20 min at 40°C to at a frequency of 53 kHz. The preparation then refrigerated in tightly closed container.
3.3 Screening design
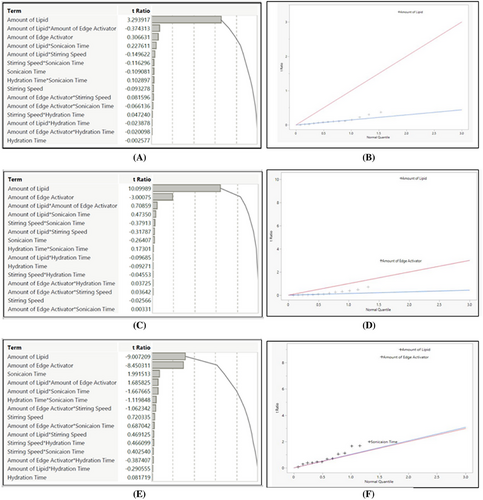
A Fractional-Factorial Design (FFD) comprising 18 runs with 5 factors, each having 3 levels, was implemented to identify the factors influencing the transferosomes CQAs. Table 1 presents the experimental matrix and factor descriptions. The KTZ-TF (ketoconazole-loaded transferosomes) were subsequently formulated and assessed for different CQAs. Half-normal plot and Pareto charts were employed to determine CPPs and/or CMAs and evaluate their impact on the selected CQAs.20
| Trials | Lipid | Span 80 | Stirring speed | Hydration time | Sonication |
|---|---|---|---|---|---|
| 1 | −1 | 1 | −1 | 1 | 1 |
| 2 | −1 | 1 | 1 | −1 | 1 |
| 3 | 0 | 0 | 0 | 0 | 0 |
| 4 | −1 | −1 | −1 | −1 | 1 |
| 5 | 1 | 1 | −1 | 1 | −1 |
| 6 | 0 | 0 | 0 | 0 | 0 |
| 7 | 1 | −1 | 1 | 1 | −1 |
| 8 | 1 | −1 | −1 | −1 | −1 |
| 9 | 1 | −1 | −1 | 1 | 1 |
| 10 | 1 | 1 | 1 | −1 | −1 |
| 11 | −1 | 1 | −1 | −1 | −1 |
| 12 | 1 | 1 | −1 | −1 | 1 |
| 13 | −1 | −1 | 1 | 1 | 1 |
| 14 | −1 | −1 | −1 | 1 | −1 |
| 15 | −1 | −1 | 1 | −1 | −1 |
| 16 | −1 | 1 | 1 | 1 | −1 |
| 17 | 1 | −1 | 1 | −1 | 1 |
| 18 | 1 | 1 | 1 | 1 | 1 |
3.4 Systematic optimization of ketoconazole-loaded transferosome
A systematic optimization of ketoconazole-loaded transferosome formulation was performed using a Central Composite Design (CCD). Table 2 outlines the 10 trials. Soya lecithin (PL) and span 80 (EA) were identified as the CMAs and were studied at three different levels. Additional variables including organic/aqueous phase proportion, agitation period, and agitation rate were kept constant. Each trial underwent comprehensive evaluation for selected CQAs. Mathematical modeling was used to investigate the effects of independent variables (PL, EA) on dependent/response variables (particle size, zeta potential, drug release, entrapment efficiency). The JMP® software (JMP software, Cary, North Carolina, United States) was used for optimization studies. Replicate runs were used in the design to check if inter trials variation was significant as compared with intra trial variation (experimental error).22, 23
| Trials | Lipid | Edge activator |
|---|---|---|
| KTZ-TF 1 | 0 | 0 |
| KTZ-TF 2 | 0 | 0 |
| KTZ-TF 3 | +1 | +1 |
| KTZ-TF 4 | +1 | −1 |
| KTZ-TF 5 | 0 | −1 |
| KTZ-TF 6 | +1 | 0 |
| KTZ-TF 7 | 0 | +1 |
| KTZ-TF 8 | −1 | 0 |
| KTZ-TF 9 | −1 | −1 |
| KTZ-TF 10 | −1 | +1 |
- Note: Level of factors: low (–1) high (+1). Amount of lipid (mg): 250 400. Amount of edge activator concentration (mg): 100 200.
3.5 Characterization of KTZ-TF
3.5.1 Entrapment efficiency (EE)
The EE was estimated by suitably diluting the dispersion with distilled water. The sample was centrifuged at 15 000 rpm for 60 min at 4°C using a high-speed refrigerated centrifuge (REMI 412LAG, India) to isolate the transferosomes from the free, un-encapsulated drug.
3.5.2 Particle size, polydispersity index, and zeta potential
Dynamic light scattering (Anton-Paar, Litesizer 500) was used. In summary, samples were suitably diluted and added to the sample holder unit for determining zeta potential and particle size, respectively.25
3.5.3 Degree of deformability/elasticity
3.5.4 Differential scanning calorimetry (DSC)
The thermal analyses was conducted using a Diamond DSC (Perkin-Elmer, MA, USA, 6090).28
3.5.5 Transmission electron microscopy (TEM)
Transmission electron microscope (Morgagni 268 D FEI Company 155, Netherlands) was utilized to analyze the morphology of the transferosomes. For TEM, KTZ transferosomes were spread over carbon-coated copper grid and examined under transmission electron microscope (Morgagni 268 D FEI Company 155, Netherlands) at an accelerating voltage of 40 to 120 keV. The instrument was equipped with an AMT XR41-B 4-megapixel (2048 × 2048) bottom mount camera.29
3.5.6 Formulation of optimized KTZ-TF gel
The optimized KTZ-TF preparation had been incorporated into a Carbopol 940 gel. In summary, a 1% gel was prepared in phosphate buffer pH 7.4 using magnetic stirrer and kept for 24 h to allow complete hydration. Thereafter, KTZ-TF preparation was incorporated into 1% w/v gel-base using magnetic stirring.30
3.5.7 Evaluation of optimized KTZ-TF gel (KTZ-TFG)
Visual examination of color, consistency, and appearance was carried out.31 Brookfield digital viscometer (Model DV-II, USA) equipped with spindle S27 was employed for viscosity measurements of the developed gel at speeds of 30, 50, and 100 rpm.17 The pH of the transfersomal gel formulations was measured in triplicate at room temperature using a digital pH meter.17 The spreadability of the formulated gels was evaluated three times using a glass slide setup. For this 0.5 g of gel was spread on glass plate (2 cm diameter) with premarked circle T. Another glass plate with 500 mg weight was kept for 5 min on the top of the experimental set up. The change in diameter because of spreading of the test formulation was recorded.32
3.5.8 In vitro drug release
In vitro release studies of the prepared transfersomal gel formulation and commercially available KTZ ointment (Ketostar, Mankind Pharma Ltd, 2% w/w ointment) was accomplished in phosphate buffer with pH 7.4 using a modified Franz diffusion cell fitted with a dialysis membrane (mol wt cut-off 10 000–12 000 Da) as per previous reported method. The process parameters were temperature 37.0 ± 0.5°C, rotational speed of 100 rpm and formulation equivalent to 2 g of the KTZ-TFG. The samples were examined via UV spectroscopy following suitable dilutions and drug release was calculated.30
3.5.9 In vivo studies
Twelve healthy male albino rats, weighing 200–250 g, were picked for the study. All the test animals were caged in a group of four and kept at room temperature (25 ± 2°C) in a normal day night cycle (06.00 h to 18.00 h) with access to standard diet and water under the supervision of animal house supervisor. The rats were divided into three groups (six animals in each group) and were demarcated as group A (control group), B (test group), and C (standard), respectively. The control group was considered without any treatment, test group consisted of KTZ-TFG formulation, and standard group was treated with commercially available KTZ formulation. Each group (A, B, and C) was treated with their respective formulation every day. The treatment schedule was continued for for 27 days and the hair growth activity was monitored at 00 day, 7th day, 14th day, 21th day, and 27th days.
3.5.10 Primary skin irritation test
The hair on the back of each rat of were shaved along the side of spine to unveil 2 cm2 area. The test area was cleaned with surgical sprit before the application of formulation. KTZ-TFG and commercially available KTZ formulation were applied over the designated test sites. The application site was then monitored for erythema and edema for 72 h. Any observed erythema was graded according to irritation table (Table 3),33 A mean grade was reported for each group.
| Observation | Grade of irritation | Indication |
|---|---|---|
| No redness | 0 | No irritation |
| Slight Redness | + | Mild irritation |
| Mild redness | ++ | Moderate irritation |
| Severe redness | +++ | Severe irritation |
3.6 Hair growth study
The onset of h air growth was observed and documented, referring to the shortest duration needed to trigger the hair growth on unveiled skin of rats. The time taken for the full regrowth of hair, covering unveiled area was also documented. Hair growth was rated based on the percentage of hair coverage (Table 4).
| Observation | Hair growth score |
|---|---|
| No hair | 0 |
| Hair growth between 10% and 20%, | 1 |
| Hair growth between 20% and 40%, | 2 |
| Hair growth between 40% and 60%, | 3 |
| Hair growth between 60% and 80%, | 4 |
| 100% hair growth | 5 |
3.7 Histological analysis
Rat was euthanized with and skin tissue extracted. The dermal skin samples were collected and preserved in 10% buffered formalin for 24 h and then processed by embedding in paraffin wax using conventional methods The specimen were sectioned with microtone (Leica RM 2125, Leica Microsystems Nussloch GmbH, Germany). General histology was examined through hematoxylin and eosin (H&E) staining under light microscopy. Photomicrographs of chosen skin samples were captured with TMX 200 film under ×10, ×25, and ×40 objective using a Leitz Dialux 20 Wild Photo Automat MPS 51 microscope.34
4 RESULTS AND DISCUSSIONS
4.1 Defining QTPP
The classification of the QTPP stands as a principle and crucial prerequisite in the formulation development process based onQbD principles. The QTPP comprises a set of quality parameters that are developed to assure the safety as well as efficiency of the concluding outcome The specific QTPP for ketoconazole-loaded transfersomal formulation is detailed in Table 5.35
| Target product profile | Aim | Rationale |
|---|---|---|
| Formulation | Ketoconazole-loaded transferosomes |
Convenient transdermal application and permeation |
| Route of administration | Skin |
Assists in targeted delivery and minimizes overall side effects when compared to conventional oral treatment |
| Dosage | 2% w/w |
Minimum effective concentration should be reached |
| Appearances | smooth gel | Smooth, consistent, colorless and odorless gel |
| Particle size | <150 nm | Help in improved permeation through stratum corneum |
| Entrapment efficiency | Maximum with desired particle size range | Maximal encapsulation aids in appropriate drug loading |
4.2 Discernment of CQAs
Particle size, zeta potential, % drug release and entrapment efficiency were selected as the CQAs of the formulation. Table 6 gives the justification of the selected CQAs in order to achieve QTTP.35
| CQAs | Justification |
|---|---|
| Particle size | To demonstrate enhanced transdermal permeation and controlled release approach |
| Zeta potential | Zeta potential ensures the stability of particle |
| Entrapment efficiency |
The entrapment should be maximal to ensure high drug loading. |
| % drug release | For sustaining the release of drug |
4.3 Discernment of CMAs and CPPs
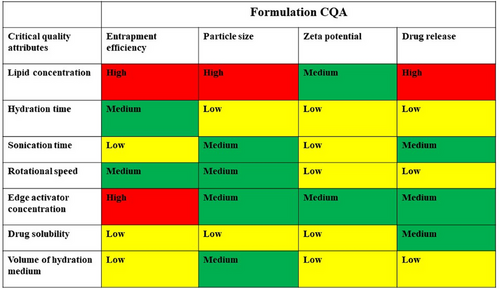
To assess their influence on product quality and performance, the CMA and CPP parameters were evaluated and listed in Figure 2.36 These attributes and parameters were further depicted in an Ishikawa fish-bone diagram presented in Figure 3, illustrating their impact on the quality of developed formulation.
4.4 Risk estimation and screening studies
A preliminary risk evaluation encompassing several factor was carried out. This assessment aimed to determine their potential impact on CQAs. The factors were assessed qualitatively and categorized as per their risk levels (high, medium, low) using the Risk Estimation Matrix (REM) analysis (Figure 3). Based on the findings from different studies,37 it was identified that the strength of phospholipid and edge activator exerted a significant influence on CQAs indicating high risk. On the other hand, medium risk was associated with factors like hydration time and speed of rotation. Consequently, lipid and edge activator concentration were discerned as CMAs, while stirring speed, hydration time, and sonication were recognized as probable CPPs impacting the CQAs.
4.5 Screening of influential variables
Half-normal and Pareto charts (Figure 4) demonstrated PL and EA to be the most significant factors (p < .005), while stirring time and speed do not have significant effect on the outcomes.
4.6 Optimization of transfersomal formulation through QbD approach
A central composite design (CCD) with 10 trials was utilized for the optimization studies of the KTZ-TF formulation. To analyze the experimental data, a polynomial model was constructed. The significance of the selected model was determined according to the values of correlation coefficient and lack of fit values. The mathematical optimization process was conducted using JMP® software, subscription 17.1, developed by JMP®, USA.39
The research utilized a response surface methodology. The independent/input variables consisted of lipid concentration (X1) and edge activator (X2) concentration. On the other hand, the response variables included entrapment efficiency (Y1), zeta potential (Y2), particle size (Y3), and the percentage of drug release (Y4). The details of the experimental runs for KTZ-TF, along with the different levels of each factor, are summarized in Table 7.
| Trails | Coded factor for lipid conc | Coded factor for edge activator conc | Entrapment efficiency (%) | Particle size (nm) | Zeta potential (mV) | Drug release (%) |
|---|---|---|---|---|---|---|
| KTZ-TF-1 | 0 | 0 | 83.97 ± 1.12 | 150.61 ± 0.12 | −33.16 ± 0.4 | 91.65 ± 1.21 |
| KTZ-TF-2 | 0 | 0 | 82.99 ± 2.02 | 151.22 ± 1.3 | −33.05 ± 1.3 | 92.14 ± 0.34 |
| KTZ-TF-3 | +1 | +1 | 79.65 ± 0.15 | 168.34 ± 0.05 | −39.55 ± 0.9 | 79.32 ± 1.23 |
| KTZ-TF-4 | +1 | −1 | 79.43 ± 1.25 | 175.43 ± 1.23 | −32.54 ± 1.2 | 74.96 ± 0.09 |
| KTZ-TF-5 | 0 | −1 | 69.21 ± 0.14 | 162.11 ± 0.53 | −31.43 ± 2.1 | 82.98 ± 1.67 |
| KTZ-TF-6 | +1 | 0 | 80.11 ± 1.01 | 171.97 ± 1.13 | −38.97 ± 1.7 | 76.09 ± 1.45 |
| KTZ-TF-7 | 0 | +1 | 75.87 ± 0.99 | 146.54 ± 0.27 | −34.97 ± 1.4 | 93.43 ± 0.89 |
| KTZ-TF-8 | −1 | 0 | 59.79 ± 1.37 | 139.43 ± 0.78 | −28.09 ± 2.5 | 96.11 ± 1.13 |
| KTZ-TF-9 | −1 | −1 | 53.21 ± 1.64 | 146.54 ± 0.93 | −23.99 ± 1.9 | 94.21 ± 0.54 |
| KTZ-TF-10 | −1 | +1 | 57.21 ± 1.64 | 135.11 ± 0.62 | −31.32 ± 0.5 | 97.02 ± 2.34 |
All the models selected for the response variables exhibited a good correlation coefficient (R2) and significant p-value (p < .05). Table 8 summarizes the various model parameters obtain for each of the response variable. All the variables were found to have a good fit into quadratic models.
| Response | RMSE | R2 | p-value |
|---|---|---|---|
| Entrapment efficiency (Y1) | 3.6449 | 0.96 | 0.0085 |
| Zeta potential (Y2) | 1.4375 | 0.96 | 0.0077 |
| Particle size (Y3) | 2.1521 | 0.9894 | 0.0005 |
| % Drug release (Y4) | 2.5308 | 0.96 | 0.0064 |
4.7 Characterization of KTZ-TF formulation
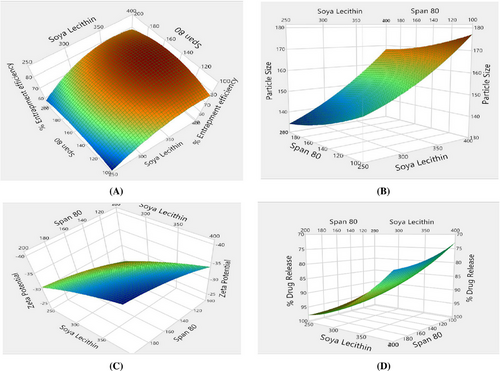
The %EE of KTZ-TF preparations, spanned from 53.21 ± 1.64% to 83.97 ± 1.12%. Among the formulations, KTZ-TF-1 exhibited the highest entrapment efficiency of 83.97 ± 1.12%. %EE was greatest at medium edge activator concentrations, while it diminished at both high and low concentrations, as illustrated from the response surface plots (Figure 7A). This trend could be attributed to the fact that at low edge activator concentration there is greater solubilization of drug in TF while pore formation within the bilayer structure occurred at higher concentration causing a decline in entrapment efficiency.29
The zeta potential values for KTZ-TF-1 through KTZ-TF-10 ranged from –23.99 ± 1.9 mV to –39.55 ± 0.9 mV, indicating satisfactory stability and dispersion characteristics. It was found that a rise in the proportion of edge activator and phospholipid within the formulation led to a more negative zeta potential. This occurrence can be attributed to the higher concentration of negatively charged phospholipids and edge activators within the transfersomal formulation.
Although edge activators, being nonionic surfactants, lack the ability to dissociate into charged entities such as their ionic counterparts, they still exhibited an impact on the zeta potential. This influence could potentially stem from molecular polarization and the adsorption of edge activator at the interface between phospholipidic bilayer structure and the surrounding hydration medium. These mechanisms contribute to the observed changes in zeta potential.140
The vesicle dimensions of KTZ formulations, spanning from KTZ-1 to KTZ-TF-10, exhibited a range of 135.11 ± 0.62 nm to 175.43 ± 1.23 nm. As depicted in Figure 5B, there is an elevation in edge activator proportion and a subsequent decrease in particle size; this is due to membrane fluidization and surface tension reduction done by edge activator in formulations.41
4.8 Drug release from KTZ-TF
The percentage of drug release across KTZ-TF formulations, spanning from KTZ-TF-1 to KTZ-TF-10, displayed a range from 74.96 ± 0.09% to 97.02 ± 2.34%. It was evident that the level of drug release was influenced by the particle size. Notably, KTZ-TF-10 exhibited the highest percentage of drug release at 97.02 ± 2.34% (Figure 5). Smaller particle sizes correspond to larger surface areas, resulting in enhanced drug release rates. Conversely, larger particle sizes lead to reduced surface areas, resulting in slower drug release rates.26
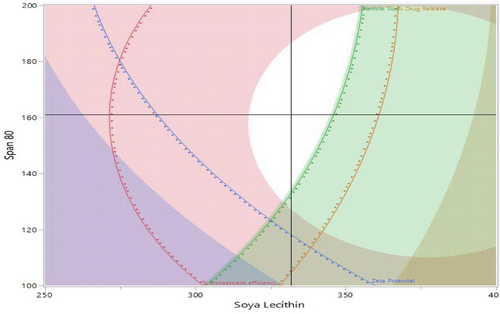
Furthermore, a design space was established through the utilization of the desirability approach, which involved weighing the trade-offs among various Critical Quality Attributes (CQAs) to achieve specific objectives. These objectives encompassed achieving smaller particle size, maximum negative zeta potential, optimal entrapment efficiency, and a high percentage of drug release. To achieve these objectives, both numerical and graphical optimization techniques were employed to approximate a desirability value close to unity. Incorporating these concepts, Figure 6 illustrates an overlay plot and the designated design space. Subsequently, the optimization formulation was chosen utilizing the point prediction method. Formulation KTZ-TF-1 was identified as the optimized formulation. With the intention to validate the chosen design, the experimental values for various CQAs were compared against the model-predicted values. The analysis revealed no significant difference (p < .05, at a 95% confidence interval) between the experimental and predicted values, thereby affirming the credibility of the selected design. This was used for further studies.42
4.9 Degree of deformability
The defining characteristic of transferosomes resides in the elasticity and deformability of their membranes. This unique quality enables transferosomes to navigate through apertures considerably smaller than their own size. This attribute is a result of their membrane's heightened flexibility, facilitating the transportation of drug-loaded transferosomes into deeper layers of tissue. The interplay of phospholipid and edge activator proportions within the transfersomal formulation is responsible for enhancing membrane elasticity and flexibility within tissue.43 To assess the extent of deformability and elasticity, the optimized KTZ-TF formulation (KTZ-TF 1) was subjected to passage through a microporous filter. The degree of deformability was evaluated to be 13.78 ± 1.78% confirming elasticity of the prepared vesicles.
4.10 Differential scanning calorimetry (DSC)
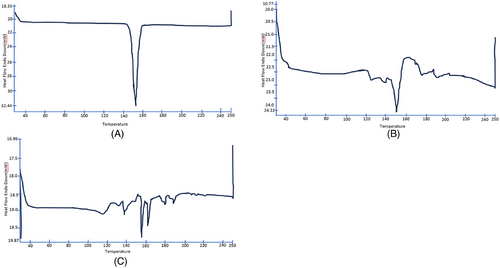
The thermal analysis of KTZ revealed a significant melting endothermic peak at 152°C with enthalpy of 85.03J/g (Figure 7A) that was ascribed to drug melting. DSC of physical mixture exhibited endothermic peaks at 151.12°C with an enthalpy of 11.88 J/g (Figure 7B). DSC thermogram of the lyophilized KTZ-TF-1 (Figure 7C) showed sharp endothermic peak at 155°C, with low enthalpy (3.61 J/g). The slight shift from the actual drug melting peak in both KTZ-TF-1 and the physical mixture can be accredited to the plasticizing influence of the edge activator on the phospholipid. Further, the appearance of sharp peak in thermogram of KTZ-TF-1 indicates presences of drug in stable crystalline form in the lipid layer.44
4.11 Transmission electron microscopy
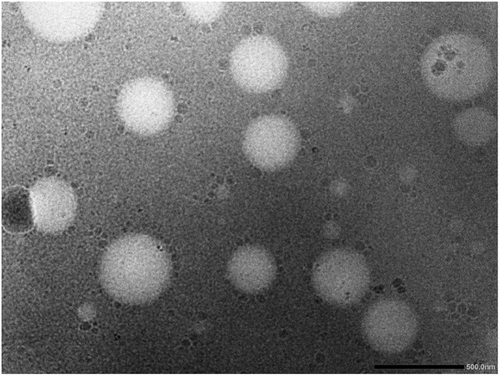
The Transmission electron microscopy reveal the uniform round shape of transferosomes (Figure 8).45
4.12 Evaluation of ketoconazole-loaded transfersomal gel (KTZ-TFG)
To facilitate the practical application of transferosomes the optimized KTZ-TF was loaded into carbopol gel. This also aids in providing a controlled release of drug. The prepared gel was off-white in color. Viscosity determination of transfersomal gel demonstrated that the thickness of the gel reduces as the spindle speed or shear rate increases.46 Viscosity at 30, 50, and 100 rpm was 620.04 ± 0.56, 515.23 ± 0.02, and 428.61 ± 0.75 cps, respectively.
The pH level of the gel preparation was determined to be 5.5 ± 0.15. This pH value closely aligns with the natural pH of the human scalp, thus, the prepared gel will not cause scalp irritation.47
Spreadability signifies that the gel can easily spread with minimal shear force. The spreadibility of the KTZ-TFG gormulation was found satisfactory; the diameters of the resulting spread circles were measured to be 5.6 ± 0.33 cm.48
4.13 In vitro drug release and kinetics
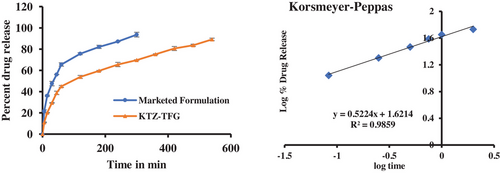
In vitro studies revealed that (Figure 9) cumulative release of marketed formulation was 93.6 ± 2.21% within 5 h. The cumulative drug release of KTZ-TFG was 69.67 ± 1.78% after 5 h respectively. The transfersomal gel showed controlled release with 89.1 ± 1.2% release at the end of 9 h. To illustrate the drug release mechanism, the release data was fitted into various mathematical models and the best fit mode laws predicted based on R2 value. Data were fitted into various models like zero order, first order, Hixon Crowell and Korsmeyer–Peppas equation. The maximum value of R2 (.9859) was found for Korsmeyer–Peppas equation; the value of release exponent n was 0.5224 indicating release to be a combination of diffusion and swelling (anomalous transport). The control release of KTZ can be attributed to development of transferosomes and gel formulation, which allows for slow release of drug.49
4.14 In Vivo Studies
4.14.1 Primary skin irritation test
Irritation studies were carried out on KTZ-TFG and commercialized product on the denuded uninjured skin of rats The application areas were monitored for redness and swelling over a 72-h period following the formulation application. An irritation score was assigned based on the degree of redness observed on skin. All the formulations were given 0 score at 7th, 14th, 21th, and 27th day as no redness or swelling appeared on the skin of the test animals indicating KTZ-TFG and marketed formulation were non- irritant to rat skin.50
4.14.2 Hair growth activity
The outcomes were documented based on the duration required for the onset of growth and hair follicle number. Group A served as control group, Group B received treatment with KTZ-TFG formulation, Group C received treatment with marketed formulation.34
After depilation, thin layer (2 mL) of KTZ-TFG and marketed formulation was applied on the respective groups for four weeks (once a day). The skin was observed and photographed at day 0, 7, 14, 21, and 27 as shown in Figure 10.
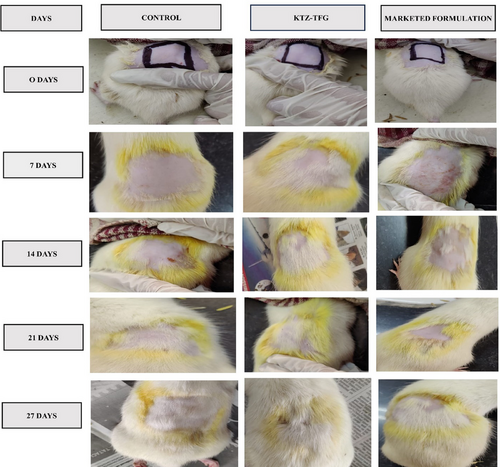
Application of KTZ-TFG formulation let to quickest initiation of hair growth at 7th day of treatment, while the other groups showed a delayed response. Complete hair growth was achieved only in the test formulation during the study period. Application KTZ-TFG was assigned a hair growth score of 5 at 21st day study (Table 9). Marketed and control formulation were unable to achieve complete hair growth at the end of 27 days and a score of 3 and 2, respectively, was assigned to them.
| Formulation | Number of rats | Time required for initiation of hair growth (in days) | Time required for complete hair growth | Hair growth score at 21 days |
|---|---|---|---|---|
| Group A (control group) | 06 | 21 | >27 | 2 |
| Group B (KTZ-TFG) | 06 | 07 | 21 | 5 |
| Group C (marketed formulation) | 06 | 14 | >27 | 3 |
The result indicates the developed formulation exhibit hair growth effects, which are better than the marketed formulation. However, further detailed quantitative hair growth studies are required to further validate the results.
4.15 Histological studies
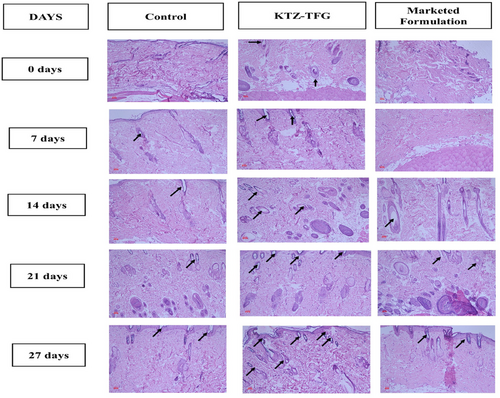
Histopathological studies were conducted on the excised rat skin. The number of hair follicles were observed by light microscopy (Axio imager, Carl Zeiss, Germany). The results (Figure 11) are in consonance with the hair growth activity studies. The number of follicles observed were more in the KTZ-TFG treated group at all the time points as shown in Figure 11. This indicates that treatment with KTZ-TFG not only quickened the hair growth process but also promoted development of hair follicles. The better performance of developed formulation can be attributed to its formulation characteristics. The deformable nature of transferosomes could have promoted passage of transferosomes into the underlying layers of hair scalp to deliver the ketoconazole near the hair follicles promoting quicker onset and faster hair growth. The marketed formulation was unable to penetrate the deeper layers of the skin and hence did not lead to proper hair growth during the study period. Also, the development of adhesive gel led to prolonged retention on hair scalp and sustain release of ketoconazole, further adding on to its therapeutic efficacy.51 Thus, the present investigation holds a great potential for commercialization after thorough scale up studies and the optimization of production cost involved in developed of vesicular systems.
5 CONCLUSION
The study was focused to investigate the hair growth activity of KTZ-loaded transferosomal gel. Transferosomes were formulated through solvent evaporation technique using phospholipid and edge activator. Prepared transferosomes were screened and optimized for vesicle size, drug entrapment efficiency, and zeta potential through QbD approach. The DSC and TEM studies confirmed the formation of transferosomes. The ketoconazole-loaded transferosomes were then blended into Carbopol 940 gel. The in vitro drug release investigations demonstrated sustained KTZ release as compared to marketed formulation. In vivo hair growth activity studies and histopathological studies also revealed better efficacy of KTZ-TFG, indicating that the repurposed KTZ developed formulation is a suitable candidate for hair growth.
AUTHOR CONTRIBUTIONS
Conceptualization: GK, VS, and PB. Data curation: TGS, NPK, and LSW. Formal analysis: SR, GoK, GK, and VK. Funding acquisition: TGS and VS. Investigation: MM and GT. Methodology: PB, MM, and GG. Project administration: VS. Resources: PB. Software: PB. Supervision: VS and PB. Writing—original draft: MM and GT. Writing—review and editing: GG, NPK, and PB.
ACKNOWLEDGMENTS
The authors are thankful to SAS Institute Inc., USA for providing a complimentary license of the software (JMP® student subscription 17.1.0).
CONFLICT OF INTEREST STATEMENT
The authors declare no conflicts of interest.
FUNDING INFORMATION
No external funding.
ETHICS STATEMENT
The experimental protocol was approved by Institutional animal ethical committee (IAEC/CCP/24/01/PR-20).
Open Research
DATA AVAILABILITY STATEMENT
The original contributions presented in the study are included in the article; further inquiries can be directed to the corresponding authors.


