Data-driven Bayesian network learning analysis on the regulatory mechanism between carcinogenic genes and immune cells
Weixiao Bu and Huaxia Mu contributed equally to this study.
Abstract
Background
In recent years, it has become a research focus to accurately extract key genes influencing the occurrence and development of diseases from massive genomic data and study their regulatory mechanisms. Further exploration of these large databases is beneficial for us to identify key regulatory mechanisms in the occurrence and development of diseases, providing direction and theoretical basis for subsequent experimental design and research.
Methods
By using data from The Cancer Genome Atlas (TCGA) for lung adenocarcinoma (LUAD), the immune cell content of patients was obtained through deconvolution calculations in CIBERSORTx. Combined with Bayesian network inference methods, the impact of key gene expression on the heterocellular network influencing lung cancer was analyzed.
Results
We found CD36 and ADRA1A genes were identified as two key mRNA genes influencing lung adenocarcinoma. The sensitivity analysis shows that the model performs well on both the testing set (error rate = 4%, AUC = 0.9804), the training set (error rate = 5.637%, AUC = 0.9746) and the verification set (error rate = 28.85%, AUC = 0.8689). The model has excellent predictive capabilities.
Conclusion
We found that CD36 and ADRA1A genes may influence the development of lung cancer by affecting regulatory T cell and follicular helper T cell populations. Additionally, plasma cells may affect the expression of the CD36 gene. And the mutual information calculated by the model for these two genes is also the highest, indicating their potential as tumour biomarkers. Combining the network model, it can be inferred that CD36 and ADRA1A are likely to influence the occurrence and development of the disease through follicular helper T cells and regulatory T cells.
1 BACKGROUND
In recent years, mRNA technologies and other biological small-molecule drugs have made significant progress in clinical medicine.1 However, the development of new drugs targeting mRNA still faces many challenges.2 One current focus of research is how to select key RNAs from a large number of genes and then explore their underlying molecular mechanisms.3, 4 With the advancement of sequencing technologies, various high-throughput methods have been developed to detect molecular components in biological systems. However, the exploration of different types of omics data is still not deep enough. With the rapid advancement of single-cell sequencing technology, the use of ‘digital cytometry’ enables deconvolution calculations of the composition of individual cell types within a heterogeneous cell population, thus allowing for more in-depth exploration of many online databases.5, 6
Transcriptomics, first proposed by Velculescu et al.,7 is a discipline that studies the overall transcriptional regulation patterns of genes within cells. Currently, most studies focus on analyzing genes with differential expression among different tissues. However, such studies only provide information about the correlation between genes and diseases, without further analyzing causal relationships. Additionally, even after gene screening, there are still hundreds or thousands of genes remaining. For researchers or clinicians who want to conduct further experimental or clinical studies, choosing which gene to study remains a major challenge. Therefore, exploring the genetic regulatory mechanisms of disease development has become a current research hotspot, and the Bayesian network method plays an important role in the field of studying gene regulatory mechanisms.
2 METHODS
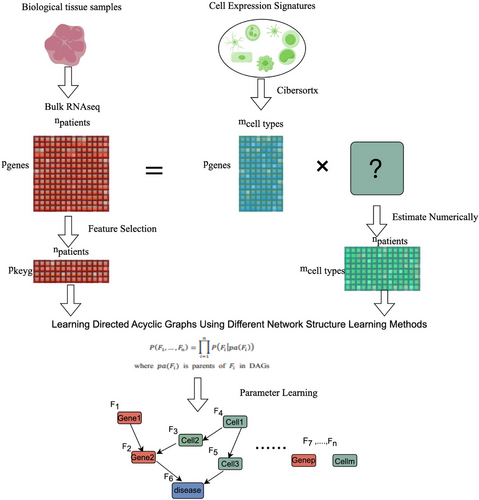
As summarized in Figure 1 (By Figdraw), we combine features screening methods, digital cytology, and Bayesian network inference methods to analyze the molecular mechanisms that affect the occurrence and development of cancer.
2.1 Data
Transcriptomic RNA sequencing data from lung adenocarcinoma (LUAD) tissue samples from The Cancer Genome Atlas (TCGA) were used for omics analysis. The data were randomly split into a training set and a testing set in a 7:3 ratio, and the GSE115002 gene chip data were used as an external verification set. The LM22 immune cell gene signature in CIBERSORTx was used to calculate the abundance of each immune cell and perform a logarithmic transformation. Bayesian network parameter and structure learning were conducted based on the expression features of the two key genes.
2.2 Transcriptomics gene expression analysis
Differential gene expression refers to the variation in gene expression levels in different tissues caused by selective expression of genes in time or space. Differential expression genes are genes with significantly large fold changes in expression and statistical significance. Comparative analysis using gene expression data is performed to determine if there is differential expression of the same gene between two sets of samples (e.g., colon tumour tissue samples and normal tissue samples). The “limma” package8 in R language is used to analyze genes with differential expression levels between different tissues. The selection criteria include P < 0.01 and LogFC > 10.
The most challenging issue in gene data analysis is the curse of dimensionality, especially in small sample sizes with high-dimensional data. Traditional analysis methods are easily influenced by various confounding factors, and most studies only focus on the level of correlation analysis. Further data mining of publicly available databases can better utilize these databases. Moreover, by using Bayesian network algorithms, it is possible to learn causal relationships between different features, which can help researchers discover and improve the possible regulatory mechanisms within the entire disease process (e.g., which gene may have more research value in the occurrence of lung cancer). This provides a theoretical basis for further research. Therefore, in order to filter high-dimensional gene data, this study first employed lasso regression9 and enrichment analysis10 methods . Considering that different structural learning algorithms have different underlying assumptions, we used an ensemble approach to average the results from different algorithms to identify potential arc lists for the final learning of the directed acyclic graph (DAG). Subsequently, we combined these results using various structural learning algorithms to form the prior information of a Bayesian network, aiming to obtain more reliable estimation results. To avoid potential collinearity issues among genes, this study further screens differential expression genes using lasso regression models. Kegg pathway analysis and GO biological function enrichment analysis were used to preliminarily identify potential regulatory mechanisms of genes and select key genes for subsequent construction of the network model.
2.3 CIBERSORTx immune infiltration analysis
Tumor immune cell infiltration analysis.CIBERSORTx11 is used to perform deconvolution calculations to obtain the immune cell content of the samples. Heatmaps, box plots, and other analyses are used to analyze the changes in different cell contents in different tissue samples. Furthermore, a comparison is made to determine if there are differences in the content of each immune cell type between the two groups, using the Wilcoxon rank-sum test for intergroup difference analysis.
2.4 Bayesian network model
Bayesian networks are directed acyclic graph methods that express probabilistic causal relationships between various indicators. With the development of Bayesian network algorithms, they have been used to model intracellular signaling pathways, such as identifying known DNA repair networks in Escherichia coli using microarray data or identifying simple phosphorylation cascades in T cells using flow cytometry data. However, there are also some issues in these studies, especially when the sample size is much smaller than the number of variables, both the computation and accuracy of the network will be adversely affected.12-14 Transcriptomic data often have a large number of random variables and a small number of biological replicates, making inference of gene-level networks computationally challenging and introducing greater uncertainty into the inference.15 Therefore, variable selection methods often have significant importance in the early application of these studies.
2.5 Bayesian network structure learning
Bayesian network inference16, 17 involves inferring the structure of the network, capturing specific causal interactions or arcs between network nodes, and representing them as a DAG, followed by estimating the parameters of the conditional probability distribution from the dataset. First, use professional prior knowledge to determine the edges that are definitely not included in the network structure (‘blacklist’). Then, through various different structural learning algorithms, determine a set of possible edge relationships that consider the trade-off between regression accuracy and model complexity (‘whitelist’). Finally, use our initial prior information together with the results of the initial structural learning as a prior to learn the network structure. Seven different structure learning algorithms were used, including Incremental Association Markov Blanket (IAMB), IAMB with False Discovery Rate control (IAMB.FDR), PC.STABLE (Practical Constraint), Grow-Shrink, Hill-Climbing and Max-Min Hill-Climbing, Restricted Search Maximum (RSMAX2). The values of Bayesian information criterion (BIC) are calculated for the entire DAG and each node with respect to the inferred parent nodes (Table 1: parent node count / BIC). The ‘whitelist’ is determined based on the minimum BIC values. Additionally, we also note that if the inferred directions of arcs differ among algorithms, they are excluded from the ‘whitelist’ when exploring the impact of strength thresholds. While increasing the number of arcs in the DAG can better approximate the joint probability distribution, complex networks limit interpretability. We use BIC to quantify the trade-off between regression accuracy and model complexity, with the optimal balance at the minimum value.
| Node | Iamb | iamb.far | pc.stable | hc | Max-Min Hill-Climbing (MMHC) | RSMAX2 | Grow-Shrink (GS) |
|---|---|---|---|---|---|---|---|
| Plasma.cells | 1 / −291.8023401921 | 0 / −294.459206418878 | 3 / −266.31031936216 | 2 / −287.840888063344 | 1 / −289.502223426822 | 1 / −289.502223426822 | 1 / −291.8023401921 |
| T.cells.CD8 | 1 / 81.3499978811879 | 0 / 75.8029440759014 | 0 / 75.8029440759014 | 1 / 81.3499978811879 | 0 / 75.8029440759014 | 0 / 75.8029440759014 | 1 / 81.3499978811879 |
| T.cells.follicular.helper_lg | 2 / −379.336840560616 | 0 / −387.741134260541 | 0 / −387.741134260541 | 2 / −378.795426819561 | 1 / −381.546618055557 | 1 / −381.546618055557 | 1 / −383.830431491035 |
| T.cells.regulatory_lg | 0 / −420.975741012612 | 0 / −420.975741012612 | 3 / −393.666493118798 | 1 / −397.093904536166 | 1 / −397.093904536166 | 1 / −397.093904536166 | 1 / −418.420616001946 |
| Dendritic.cells_lg | 1 / −273.795810430027 | 0 / −276.027622301972 | 1 / −274.291846120123 | 3 / −271.301502477843 | 2 / −271.422695593853 | 2 / −271.422695593853 | 1 / −273.795810430027 |
| PM0 | 0 / −75.0997855604118 | 0 / −75.0997855604118 | 0 / −75.0997855604118 | 0 / −75.0997855604118 | 1 / −73.3084051474526 | 1 / −73.3084051474526 | 0 / −75.0997855604118 |
| PM1 | 1 / 109.958641006879 | 0 / 108.568085319071 | 1 / 109.958641006879 | 1 / 109.958641006879 | 1 / 109.958641006879 | 1 / 109.958641006879 | 1 / 109.958641006879 |
| B.cells.memory_lg | 0 / −429.435498539186 | 1 / −407.65349782971 | 0 / −429.435498539186 | 3 / −406.593255154128 | 1 / −407.65349782971 | 1 / −407.65349782971 | 0 / −429.435498539186 |
| NK.cells_lg | 2 / 422.90051029627 | 0 / 420.587271998107 | 2 / 422.90051029627 | 0 / 420.587271998107 | 2 / 422.90051029627 | 2 / 422.90051029627 | 2 / 422.90051029627 |
| Mast.cells.resting | 2 / −95.373106203756 | 1 / −96.2100050114938 | 1 / −107.458439403548 | 3 / −103.077460005434 | 2 / −93.8179730572125 | 1 / −96.2100050114938 | 2 / −95.373106203756 |
| Eosinophils_lg | 0 / −192.350223203287 | 0 / −192.350223203287 | 0 / −192.350223203287 | 2 / −185.240108812062 | 0 / −192.350223203287 | 0 / −192.350223203287 | 0 / −192.350223203287 |
| Neutrophils_lg | 2 / −420.87358200131 | 0 / −429.401183024767 | 0 / −429.401183024767 | 1 / −421.683572407939 | 1 / −421.683572407939 | 1 / −421.683572407939 | 1 / −421.683572407939 |
| T.cells.CD4.memory.resting | 1 / −129.330739573543 | 0 / −130.356382829532 | 2 / −125.553977090909 | 2 / −125.553977090909 | 2 / −125.553977090909 | 1 / −126.445680060034 | 1 / −129.330739573543 |
| T.cells.CD4.memory.activated | 1 / −407.658151297368 | 2 / −401.074318906455 | 4 / −389.197066356366 | 4 / −387.46442612204 | 2 / −401.074318906455 | 2 / −401.074318906455 | 1 / −407.658151297368 |
| CD36 | 1 / −423.825828990464 | 0 / −428.782811982521 | 2 / −355.373989215767 | 0 / −428.782811982521 | 0 / −428.782811982521 | 0 / −428.782811982521 | 1 / −423.825828990464 |
| ADRA1A | 2 / −216.101482490065 | 2 / −216.101482490065 | 0 / −298.28317102778 | 1 / −227.925544870692 | 1 / −227.925544870692 | 1 / −227.925544870692 | 2 / −216.101482490065 |
| event | 6 / 46.839645438495 | 4 / 41.1209214621561 | 6 / 46.839645438495 | 5 / 47.0693325765038 | 5 / 47.0693325765038 | 5 / 47.0693325765038 | 5 / 47.0693325765038 |
The bootstrap resampling method, which involves replacing sampling from the dataset to generate synthetic datasets of similar size to the original dataset, was used. Each algorithm learned the inferred network structure using the synthetic datasets, resulting in 10 000 network structures. For each algorithm, the average network structure was computed from its set of network structures, and the threshold for including arcs in the average network was automatically determined by each algorithm.
2.6 Bayesian network parameter learning
The dataset was divided into a training set and a testing set in a 7:3 ratio, with the training set used for model parameter learning. The network structure learned from the final structure was imported into the software, and the maximum a posteriori estimate method was used to estimate the parameters of each node.
The Netica software allows us to obtain the conditional probability distribution of other nodes and model predictions by determining the node status. The validation set was used for model validation, and evaluation indices mainly included the area under the ROC curve and confusion matrix.
3 RESULTS
3.1 Mono-omics correlation analysis and dimensionality reduction processing
3.1.1 Transcriptomics gene expression differential analysis
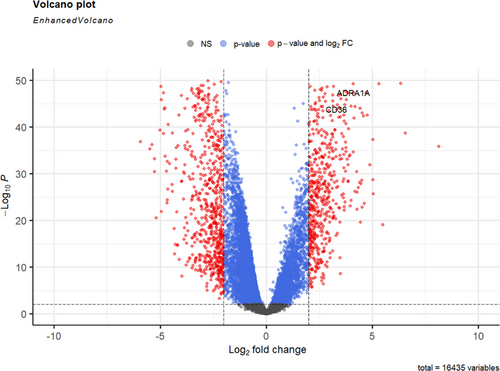
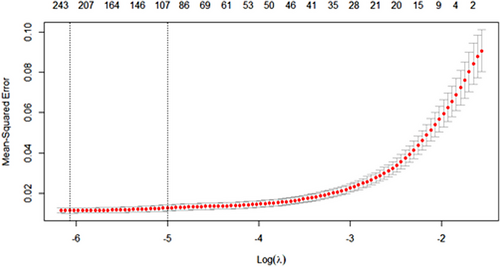
First, a gene differential expression analysis was conducted, and 1294 genes that were differentially expressed between healthy and cancerous tissues were obtained (Figure 2). After that, to eliminate possible collinearity among variables, we used lasso regression to reduce the dimensionality of variables and selected the optimal λ value (0.002307535) through cross-validation (Figure 3), resulting in 227 genes in the model for KEGG pathway analysis and GO enrichment analysis. Finally, through these functional analyses, we could then identify the potential associations between transcriptomic gene expression and cellular functions. Genes that are significantly associated with cellular functions are of great significance for constructing gene-cell regulatory networks in subsequent studies.
3.2 Transcriptomics gene expression functional analysis
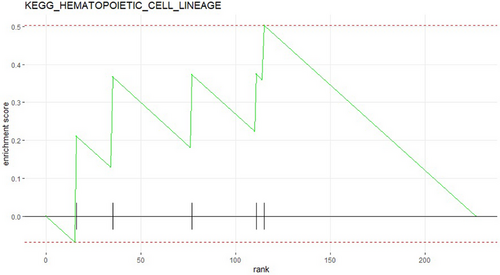
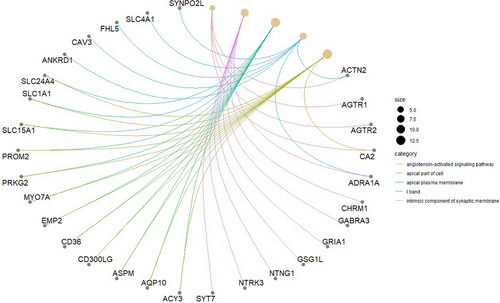
The KEGG pathway analysis revealed that various genes in non-small cell lung cancer patients may have abnormal expression in different pathways. For example, as shown in the Figure 4, five genes were up-regulated in the HEMATOPOIETIC_CELL_LINEAGE pathway. This suggests that these genes may influence the occurrence and development of the disease through these regulatory pathways. The GO biological enrichment analysis identified the main molecular functions, cellular components, or biological processes in which the genes are predominantly enriched. For example, as shown in the Figure 5, four genes were found to be enriched in the Angiotensin-activation signaling pathway. The genes that are identified in both analyses may be key genes that contribute to the development of the disease. Investigating the regulatory mechanisms of these genes may hold greater research value. Based on KEGG pathway analysis and GO enrichment analysis, we selected the genes ‘CD36’ and ‘ADRA1A’ for further analysis (See Table 2).
| KEGG pathway | Gene |
|---|---|
| KEGG_NEUROACTIVE_LIGAND_RECEPTOR_INTERACTION | ‘SSTR4’ ‘CHRM1’ ‘CHRM2’ ‘ADRA1A’ ‘GRIA1’ |
| KEGG_HEMATOPOIETIC_CELL_LINEAGE | ‘CD36’ ‘MME’ ‘CSF3’ ‘IL6’ ‘IL1A’ |
| KEGG_JAK_STAT_SIGNALING_PATHWAY | ‘CBLC’ ‘IL22RA2’ |
| KEGG_CYTOKINE_CYTOKINE_RECEPTOR_INTERACTION | ‘IL22RA2’ ‘IL20RB’ ‘CCL24’ ‘IL1A’ ‘IL6’ ‘PF4’ ‘CSF3’ ‘CCL23’ |
3.3 CIBERSORTx immune infiltration analysis
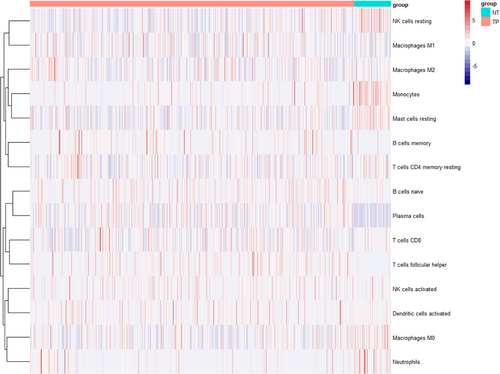
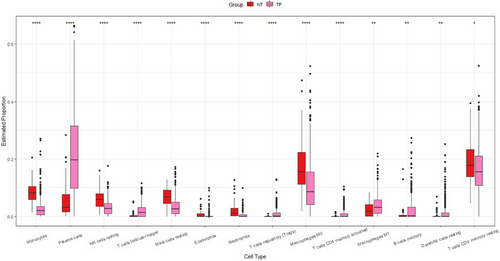
CIBERSORTx was used to calculate the content of immune cells in each sample and compare whether the content of each immune cell was different between healthy and cancerous tissues. The heatmap of cell abundance provides a rough display of the immune cell content in each sample. The Wilcoxon test is used to compare whether there are differences in cell abundance between different tissues.
In order to optimize the graph model and reduce computational complexity, we prioritize analyzing immune cell types with different abundance between different tissues. For example, in Figure 6, the abundance of plasma cells in normal tissues is significantly lower, so the high expression in cancer tissues may be caused by gene expression changes. Moreover, the differences between the two groups in Figure 7 are also statistically significant. Therefore, we further include this cell type data in subsequent analysis. Therefore, among the common 22 cell types provided by CIBERSORTx, we only selected 14 cell types (as shown in Figure 7).
3.4 Determination of network structure priors (consensus seed network) using multiple structure learning algorithms
Due to the different underlying assumptions of various structural learning algorithms, a single algorithm may perform poorly on a given dataset. Therefore, we utilized multiple diverse structural learning algorithms to obtain the initial structure of the network. When an edge is identified by multiple methods simultaneously, we have reasons to believe that the edge truly exists. Additionally, we pay attention to the BIC value. When a node has different numbers of parent nodes, we prioritize the case with the lowest BIC value. The cells highlighted in green indicate the minimum BIC values and corresponding arc counts included in the consensus whitelist.
3.5 Bayesian network
The final network structure of the dataset was generated using the IAMB algorithm based on the ‘blacklist’ specified by previous knowledge and the ‘whitelist’ corresponding to the consensus seed network (the average network was extracted after generating 10000 networks using bootstrap method, see Figure 8).
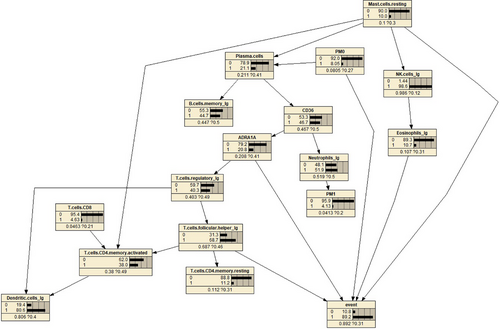
The probability distribution is marked in the Figure 8, such as the probability of the ‘normal’ state and ‘Cancer’ state of the event node being 10.8% and 89.2%, respectively, based on the current data.
3.6 Sensitivity and diagnostic analysis
Performing cause-oriented sensitivity analysis and result-oriented diagnostic analysis on the Bayesian network can effectively measure the influence relationships between factors in the model. Sensitivity analysis of the network involves observing the changes in probability parameters of output variables by varying the parameter values of input nodes, typically by comparing the magnitude of variance reduction or entropy reduction. The larger the variance reduction and entropy reduction values, the greater the influence of the respective indicators on the outcome. Diagnostic analysis, based on sensitivity analysis results, involves observing the changes in probability tables of influencing factors through Bayesian model inference. The larger the probability changes, the closer the relationship between the two.
3.7 Sensitivity analysis
Setting the analysis variable as the ‘event’ in the target variable (1 for cancer tissue), sensitivity analysis is performed on other factors using Netica software, and the results are shown in Table 3. The ‘entropy reduction value’ in Table 3 measures the interdependence between factors, and entropy reduction percentage and variance represent the degree of influence between factors.
| Nodes | Mutual information | Entropy reduction | Variance reduction |
|---|---|---|---|
| ADRA1A | 0.10106 | 20.4000 | 0.016990 |
| CD36 | 0.03034 | 6.14000 | 0.003935 |
| T.cells.follicular.helper_lg | 0.02280 | 4.61000 | 0.003293 |
| Eosinophils_lg | 0.01856 | 3.75000 | 0.003203 |
| Mast.cells.resting | 0.01472 | 2.98000 | 0.002512 |
| T.cells.regulatory_lg | 0.01436 | 2.90000 | 0.001779 |
| PM0 | 0.00905 | 1.83000 | 0.001523 |
| Plasma.cells | 0.00273 | 0.55300 | 0.000336 |
| Neutrophils_lg | 0.00133 | 0.26800 | 0.000176 |
| NK.cells_lg | 0.00056 | 0.11400 | 0.000089 |
| Dendritic.cells_lg | 0.00061 | 0.12300 | 0.000078 |
| T.cells.CD4.memory.resting | 0.00038 | 0.07590 | 0.000053 |
| B.cells.memory_lg | 0.00018 | 0.03610 | 0.000024 |
| T.cells.CD4.memory.activated | 0.00005 | 0.00956 | 0.000006 |
| PM1 | 0.00003 | 0.00555 | 0.000004 |
From the table, it can be observed that ADRA1A has the most significant effect on the disease condition, with the highest entropy reduction percentage of 20.4%, while PM1 has an entropy reduction percentage of 0.00555, indicating the least impact on the disease condition.
3.8 Diagnostic analysis
For diagnostic analysis, we selected eight features that have a significant impact on the disease condition. Using the reverse inference of the Bayesian network model, we set the ‘event’ node to states ‘normal’ and ‘cancer’ representing the assumption of non-disease and disease conditions, respectively. We observed the changes in the probability parameter tables for each feature, and the results are shown in Figures 9 and 10.
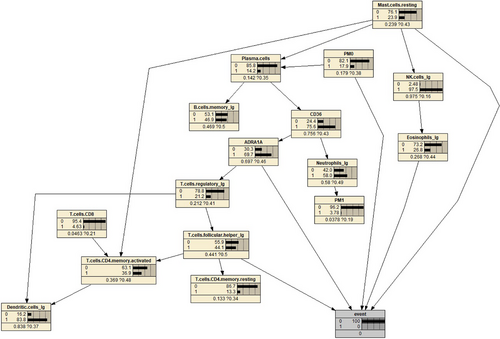
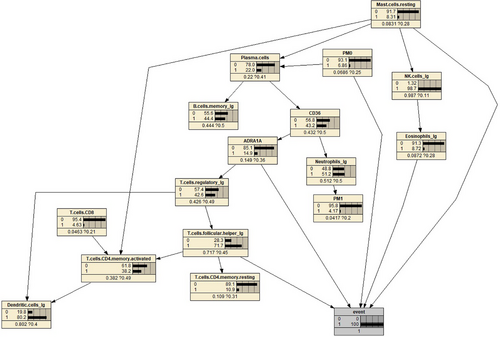
By comparing the two graphs, it is not difficult to find that the probability of ADRA1A nodes varies significantly.
3.9 Model prediction
Model prediction evaluation was performed using a training set and a validation set, and the results are shown in Table 4. From the table, it can be observed that the model achieved an accuracy of around 96%, and the AUC values were around 0.98, indicating good predictive performance and generalizability of the model. The external validation dataset used in this study was randomly selected from the GEO public database, which may have different experimental designs that could result in prediction results that are not as good as the original data. However, the model still demonstrates high prediction accuracy (error = 28.85%, AUC = 0.8689), indicating that it has a certain degree of extrapolation capability.
| Testing set | Training set | Verification set | ||||||
|---|---|---|---|---|---|---|---|---|
| Predicted | Predicted | Predicted | ||||||
| Actual | 0 | 1 | Actual | 0 | 1 | Actual | 0 | 1 |
| 0 | 18 | 1 | 0 | 0 | 36 | 0 | 24 | 28 |
| 1 | 6 | 150 | 1 | 1 | 19 | 1 | 2 | 50 |
| Error rate | 4.000% | 5.637% | 28.85% | |||||
| AUC | 0.9804 | 0.9746 | 0.8689 | |||||
4 DISCUSSION
Mechanistic modeling and simulation have become increasingly important in the development of clinical medicine. In recent years, it has become a research focus to accurately extract key genes influencing the occurrence and development of diseases from massive genomic data and study their regulatory mechanisms. The establishment of numerous bioinformatics databases also urgently requires in-depth exploration by researchers. Unlike previous studies, we determine the nodes and prior information included in Bayesian network modeling from the perspective of data analysis, which can compensate for our lack of professional knowledge and discover new potential regulatory mechanisms.
There are currently many methods, such as graph convolutional neural networks and conditional random fields for predicting human lncRNA miRNA interactions,18 or network distance analysis models (NDALMA)19 for lncRNA miRNA association prediction. These methods also have good learning effects, but machine learning methods are difficult to explain how they learn. The Bayesian network method we use can intuitively observe the structure and parameters of the model, It can provide better theoretical support for further research, etc.
In this study, we utilized a combination of single-omics analysis methods, lasso dimension reduction, and Bayesian network approaches to explore the key genes influencing the occurrence and progression of lung cancer. We constructed a Bayesian network model and conducted sensitivity analysis to validate its predictive ability and extrapolation. Furthermore, by integrating immune cell data, we gained further insights into the regulatory mechanisms of genes, such as how genes are influenced by immune cells in the development of lung cancer.
This provides a theoretical basis for future research. By referring to Figure 8, we can easily observe the regulatory relationship between the two genes within the entire cell regulatory network. By controlling the parent nodes, we can observe the changes in the child nodes, as shown in Figure 11. It is evident that the expression of CD36 is significantly suppressed when there is an increase in the abundance of plasma cells. Special transport proteins (such as CD36 and fatty acid transport proteins)20 can accelerate the uptake of fatty acids from the surrounding microenvironment, and these transport proteins are upregulated in tumour cells, serving as potentially important targets for cancer treatment. These fatty acid transport proteins play a crucial role in altering the metabolic phenotype of tumour cells. Recent studies have found that CD36 can regulate tumour development by reprogramming glucose and fatty acid metabolism.21 In addition, CD36 also mediates complex interactions between tumour cells and immune cells in the tumour microenvironment, thus affecting the malignant behavior of tumour cells. Research has reported that CD36 is an innate immune receptor involved in initiating inflammation after ischemia and is an unrecognized neutrophil cytotoxicity regulator. This effect is mediated by the upregulation of neutrophil activator CSF3 by endothelial CD36 and is consistent with our findings in the constructed network model.22, 23

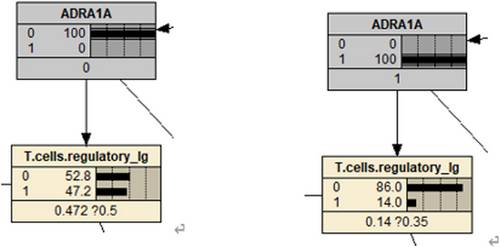
According to Figure 12, it can be observed that high expression of ADRA1A gene mRNA leads to a decrease in the abundance of regulatory T cells. Previous studies have found that the ADRA1A gene is a promising biomarker for the diagnosis of hepatocellular carcinoma.24 A two-stage case-control study showed that the variant T allele of rs6998591 in ADRA1A is significantly associated with an increased risk of cancer.25 Some studies have suggested that the activation of ADRA1A can promote the proliferation and metastasis of tumour cells, indicating the potential of inhibiting ADRA1A activity for cancer treatment. The activation of ADRA1A can inhibit the function of immune cells, weakening the immune response and allowing tumour cells to evade attacks from the immune system.26
By observing the network model, we found that the mRNA of the CD36 gene may affect the expression of ADRA1A. And four cell types directly pointing to the ‘event’ node, namely helper T cells, eosinophils, resting macrophages and PM0 cells, their abundance to some extent affects the occurrence of cancer. Here, we also encounter some limitations. Due to limitations in computational capacity, this study only selected two key genes for analysis. For example, the regulatory relationship between mRNA expression of these two genes in the model may be influenced by other omics data, such as proteomics. In the future, expanding the analysis to include more omics data can help improve the entire network structure. Therefore, we will not extensively discuss other non-included nodes in this context. However, based on the predictive performance of the model, it suggests that these two genes have the potential to serve as tumour markers. Additionally, although gene testing technology has made significant advancements, conducting a comprehensive gene test or screening still incurs substantial costs. By incorporating immune cell data for analysis in this study, it provides a different perspective for further research. For example, if the detection of CD36 and ADRA1A is challenging, can we infer gene expression by testing immune cell abundance, and so on.
There are limitations to the research. In order to explore a comprehensive molecular regulatory mechanism, we should have expanded the scope of analysis and integrated other genomic data to enhance the model. However, due to resource limitations and the interpretability of the model, we have not yet reached this stage. In the future, we can continue to add DNA mutations, proteomics, and clinical intervention data. Empirical research is also very important, and we will gradually increase this part of the study to provide additional evidence.
Although current research is still limited, CD36 and ADRA1A hold promise as a potential therapeutic target in cancer treatment. Future studies can further explore the role of CD36 or ADRA1A in cancer development and treatment and develop new treatment strategies targeting CD36 or ADRA1A.
5 CONCLUSION
In this study, through lasso regression, we reduced the dimensionality of a large number of differentially expressed genes between different tissues and screened 227 genes. Through KEGG pathway analysis and GO enrichment analysis, we found that CD36 and ADRA1A can participate in both pathway regulation and certain biological functions. Therefore, we believe that the expression of these two genes should play an important role in the occurrence and development of lung cancer, we further analyzed the regulatory relationship between these two genes and various immune cells. We have demonstrated the technical and accuracy of our model through external data validation. We further interpret the learned model. We identified CD36 and ADRA1A as two key genes influencing lung adenocarcinoma. Bayesian network analysis revealed that CD36 and ADRA1A may affect lung adenocarcinoma through their influence on regulatory T cells and follicular helper T cells, while plasma cells may impact the expression of the CD36 gene. These findings provide insights into the molecular mechanisms of lung adenocarcinoma and its interaction with the immune system. It is important to note that this study is a preliminary exploration and further experimental validation and functional studies are needed to confirm the regulatory effects of CD36 and ADRA1A on immune cells in lung adenocarcinoma patients. Additionally, the complexity of the tumour microenvironment warrants further investigation to fully understand its potential molecular mechanisms and implications.
AUTHOR CONTRIBUTIONS
Weixiao Bu, Huaxia Mu and Yujia Kong contributed to the conception and design of this manuscript. Weixiao Bu was responsible for the development of methodology. Huaxia Mu, Weixiao Bu, Mengyao Gao and Weiqiang Su extracted the datasets. Huaxia Mu and Weixiao Bu analyzed the data and drafted the first version of the manuscript. Yujia Kong provided financial support. All authors revised and revised the manuscript.
ACKNOWLEDGEMENTS
The observational study was from the TCGA (https://portal.gdc.cancer.gov) and GEO (https://www.ncbi.nlm.nih.gov/geo/query/acc.cgi?acc=GSE115002), which belongs to public databases. This work was supported by the National Natural Science Foundation of China, Grant Number: 82003560; National Natural Science Foundation of Shandong, Grant Numbers: ZR2020MH340 and ZR2023MH313, and Shandong Provincial Youth Innovation Team Development Plan of Colleges and Universities: Lu-jiao2019-6-156.
CONFLICT OF INTEREST STATEMENT
All authors declared no potential conflict of interest with respect to the research, authorship and publication of this article.
ETHICS APPROVAL
We acknowledge TCGA and GEO database for providing their platforms and contributors for uploading their meaningful datasets. TCGA and GEO belong to public databases. The patients involved in the database have obtained ethical approval. Users can download relevant data for free for research and publish relevant articles. Our study is based on open source data, so there are no ethical issues and other conflicts of interest.
Open Research
DATA AVAILABILITY STATEMENT
The datasets generated and analyzed during the current study are available in TCGA (https://portal.gdc.cancer.gov) and GEO (https://www.ncbi.nlm.nih.gov/geo/query/acc.cgi?acc=GSE115002).


