Attenuation of the severity and changes in the microbiota in an animal model of primary biliary cholangitis by FOXP3− regulatory T cells
Abstract
Background
Primary biliary cholangitis (PBC), an autoimmune liver disease, presents with progressive damage to the intrahepatic bile ducts with infiltrating mononuclear cells and the appearance of anti-mitochondrial antibodies (AMAs). The initiation of autoimmune liver disease is permissively mediated by dysfunctional regulatory T cells (Treg cells). Naïve CD4+ T cells cultured with splenic B220+ cells without additional cytokines or chemicals can differentiate into specific types of Treg cells (Treg/B cells) without expressing forkhead box P3. In this study, we explored the effects of Treg/B cells on disease severity and changes in intestinal microbiota in a murine model of PBC.
Methods
Treg/B cells were administered to 2-octenoic acid-induced PBC mice. Enzyme-linked immunosorbent assay, flow cytometry and histopathological techniques were used to evaluate the severity of PBC and to assess its therapeutic effect. Diversity of the intestinal microbiota was determined using 16S rRNA sequencing. The suppressive mechanisms of Treg/B cells were investigated using the bone marrow-derived dendritic cells (BMDCs).
Results
Treg/B-cell treatment significantly decreased the levels of serum AMAs against pyruvate dehydrogenase complex E2, lowered the levels of serum bile acids, attenuated inflammatory cell infiltration, reduced dendritic cell activation, altered the population of T cells in the liver and alleviated liver collagen synthesis in PBC mice. In addition, the Treg/B-cell treatment changed the faecal microbial diversity in PBC mice. Furthermore, Treg/B-cell treatment decreased the levels of proinflammatory cytokines and expression of costimulatory molecules in BMDCs. This inhibitory effect was partially mediated by the cytotoxic T-lymphocyte-associated antigen 4 pathway.
Conclusion
Treatment with Treg/B cells in a murine model of PBC attenuated liver inflammation and altered the gut microbiota. Immune regulation of Treg/B cells may be a potential therapeutic strategy for treating autoimmune liver disease.
1 INTRODUCTION
Primary biliary cholangitis (PBC), a prototypical autoimmune liver disease, histologically presents with inflammatory cell infiltration around the injured bile ducts and production of mitochondrial antibodies (AMAs) against pyruvate dehydrogenase complex E2 (PDC-E2).1, 2 Genetic and environmental factors are critical in the aetiology of PBC.3 Numerous studies have indicated that Il12a, Il12rb2 and Stat4 control interleukin-12 (IL-12) signalling and modulate naïve T lymphocytes towards inflammatory Th1 lymphocytes; Cd80 controls antigen presentation; and other genes that affect the immune response to microbes have a strong association with PBC.4-6 The levels of serum interferon-γ (IFN-γ), tumour necrosis factor-α (TNF-α) and bile acids are higher in patients with PBC than in healthy controls.7-10 Infections with Escherichia coli or Novosphingobium aromaticivorans, which contain PDC-E2 or PDC-E2 mimics, increase the risk of developing PBC.11 In addition, 2-octenoic acid (2-OA), a xenobiotic, is a crucial pathogenic inducer in animal models.12, 13 However, the aetiology and key regulators of PBC remain unclear.
Regulatory T cells (Treg cells) exert suppressive effects and are crucial for the immune homeostasis.14 Defective functions or numbers of Treg cells result in dysregulation of immune responses, which contributes to autoimmune attacks.15-17 Forkhead box P3 (Foxp3)-deficient mice showed high titre of immunoglobulin G (IgG) and IgM against PDC-E2, increased serum levels of IFN-γ and TNF-α, and significant lymphocytic infiltration combined with bile duct damage.18 CD86-expressing cells present antigens to helper T cells that infiltrate around bile ducts.19 CD86-expressing CD1c+ cells in the liver of patients with PBC were negatively correlated with Treg cells and were higher than those in healthy controls. Furthermore, the proportion and IL-10 secretion by Treg cells in patients with PBC were significantly lower, and impaired Treg cells reduced the suppressive ability of CD86 expression.20 Treg cells from patients with PBC are more sensitive to IL-12 and increase the expression of IFN-γ and T-bet.21 These results indicate that maintaining a balance in the costimulation of antigen-presenting cells and functional Tregs could be beneficial for alleviating the severity of PBC.
B cells can present the antigens to naïve T cells to induce a specific subtype of CD4+ CD25+ Treg cells termed Treg/B cells.22 Treg/B cells express cytotoxic T-lymphocyte-associated antigen 4 (CTLA-4), lymphocyte-activation gene 3 (LAG3) and programmed cell death protein 1 (PD-1) but do not express FOXP3. The suppressive mechanism of these specific Treg cells on the CD4+ T-cell proliferation is cell contact.23 Treg/B cells could alleviate asthmatic symptoms, induce oral tolerance in a mouse model24, 25 and prevent T-cell-mediated colitis through an IL-10-independent mechanism.26 In addition, the Peyer's patch B cells induce Treg cell differentiation via the signal transducer and activator of transcription 6 (STAT6)–LAG3 axis, and these specific Treg cells can reduce asthmatic symptoms and inflammation in mice.27 Treatment with LAG3high Treg/B cells ameliorated joint inflammation and clinical symptoms in collagen-induced arthritis mice.28 Treg/B cells repressed NLRP3 inflammasome activation and attenuated gouty inflammation in a murine air pouch model.29 However, the detailed mechanisms and applications of Treg/B cells in autoimmune liver diseases have not been elucidated.
In this study, Treg/B cells were injected into 2-OA-inducing PBC mice to investigate the therapeutic potential of Treg/B cells in this disease. Additionally, the bone marrow-derived dendritic cells (BMDCs) were cultured with Treg/B cells to investigate the immune regulatory mechanisms of Treg/B cells. Administration of Treg/B cells significantly attenuated 2-OA-induced inflammation and fibrosis in the liver and altered the microbial community in the gut. Moreover, Treg/B cells regulate lipopolysaccharide (LPS)-induced BMDC activation. These findings provide insights into the interplay between immune therapy with Treg/B cells and the gut microbiota and reveal the therapeutic potential of Treg/B cells in autoimmune liver diseases.
2 METHODS
2.1 Preparation of BMDCs
After sacrifice, bone marrow cells were isolated from femurs of C57BL/6 mice (female, aged 4−6 weeks, National Laboratory Animal Center, Taiwan) and cultured in culture medium containing 5% foetal bovine serum (FBS; Gibco, Thermo Fisher Scientific, USA) in Roswell Park Memorial Institute-1640 (RPMI-1640) (GE Healthcare, Canada) supplemented with 1% penicillin/streptomycin/amphotericin B (P/S/A) solution (Biological Industries, Israel), 1% L-glutamine (Biological Industries), 1% N-2-hydroxyethylpiperazine-N-2-ethane sulfonic acid (HEPES) (Gibco), IL-4 (20 ng/mL, BioLegend, USA) and granulocyte macrophage-colony stimulating factor (GM-CSF) (20 ng/mL, BioLegend). The medium was renewed every 3 days for 6 days for BMDCs differentiation. After 24 h of pre-culture with or without Treg/B cells (1 × 10⁶ cells, ratio of 1:1), BMDCs were treated with LPS (100 ng/mL, Sigma–Aldrich, USA) in a 24-well culture plate. The levels of cytokines in the culture medium were determined by enzyme-linked immunosorbent assay (ELISA). The expressions of CD80, CD86 and MHC II on the BMDCs were determined by flow cytometry.
2.2 Generation of Treg/B cells
After sacrifice, splenocytes were isolated from C57BL/6 mice (female, aged 6−8 weeks). Splenic B220+ cells were positively isolated by anti-mouse CD45R/B220 magnetic particles (BD Bioscience). Splenic CD4+ T cells were negatively isolated by a mouse CD4+ T-cell isolation kit (STEMCELL Technologies, Taiwan). Naïve T cells (CD4+CD25−) and Treg cells (CD4+CD25+) were separated using phycoerythrin (PE)-conjugated anti-CD25 (clone PC61, BD Bioscience, USA) and anti-PE magnetic particles (BD Bioscience). The procedures of cell isolation were performed according to the manufacturer's protocols. Treg/B cells were generated by culturing naïve T cells in a 1:1 ratio with B220+ B cells for 3 days. The culture medium was RPMI-1640 containing 5% FBS, 1% L-glutamine, 1% P/S/A solution, 1% non-essential amino acids (NEAA) (Gibco), 1% sodium pyruvate (Sigma–Aldrich), 0.05 mM 2-mercaptoethanol (2-ME) (Sigma–Aldrich), anti-CD3ε antibody (0.5 μg/mL, BioLegend) and anti-CD28 antibody (0.5 μg/mL, BioLegend). The Treg/B cells were suspended in fresh medium after B220+ cell depletion. The molecular expressions, including CTLA-4, FOXP3, inducible costimulator (ICOS), LAG3, OX40 and PD-1, of Treg/B cells were determined by flow cytometry.
In the antibody blockade experiment, Treg/B cells were incubated with the CTLA-4 blocking antibody (clone UC10-4F10-11, 10 μg/mL, BD Bioscience) for 1 h before culturing with BMDCs. For cell tracking, Treg/B cells were stained with CFSE (2.5 mM, BD Bioscience) for 20 min at 37°C and washed twice with phosphate-buffered saline (PBS) buffer. The CFSE+ Treg/B cells (5 × 10⁶ cells/mouse) were suspended in PBS buffer and intravenously injected into the 2-OA-induced PBC mice (n = 3). After 24 h, the distributions of CFSE+ Treg/B cells in the livers, spleens and lymph nodes were determined using flow cytometry. For cytokine profiles, naïve T cells, Treg cells and Treg/B cells were re-stimulated with splenic antigen-presenting cells (APCs) pretreated with mitomycin C and anti-CD3ε/CD28 antibody (1 μg/mL) for 48 h. The culture supernatants were analysed using an ELISA.
2.3 Phagocytosis assay
After pre-cultured with Treg/B cells for 24 h, BMDCs were incubated with fluorescein isothiocyanate (FITC)-conjugated dextran (0.2 mg/mL, Sigma–Aldrich). The cells were separated into two groups: one group was incubated at 37°C for 1 h, and the other group was incubated at 4°C as the phagocytosis control. The ability of phagocytosis was determined by flow cytometry.
2.4 Fluorescence flow cytometry
Cells were stained with fluorescence-conjugated antibodies at 4°C for 30 min. The following antibodies were used: FITC-anti-CD4 (clone GK1.5), FITC-anti-CD62L (clone MLE-14), FITC-anti-CD69 (clone H1.2F3), FITC-anti-CD86 (clone GL1) and FITC-anti-MHC II (clone Mh/114.15.2); PE-anti-CD19 (clone 1D3), PE-anti-CD44 (clone IM7) and PE-anti-CD80 (clone 16-10A1); PerCP-5.5-anti-CD8 (clone 53-6.7); APC-anti-CD11c (clone N418), APC-anti-CTLA-4 (clone UC10-4B9), APC-anti-FOXP3 (clone FJK-16s), APC-anti-ICOS (clone C398.4A), APC-anti-LAG3 (clone C9B7W), APC-anti-NK1.1 (clone PK136), APC-anti-OX40 (clone OX-86) and APC-anti-PD-1 (clone 29F.1A12); PE-Cy7-anti-CD3ε (clone 145-2C11); APC-Cy7-anti-CD4 (clone GK1.5). These fluorescence-conjugated antibodies were purchased from BD Bioscience and BioLegend. After washing with fluorescence-activated cell sorting (FACS) buffer twice, the cells were fixed and further analysed by BD FACSCalibur and FACSVerse (BD Bioscience).
2.5 Suppressive assay
Treg/B cells (1 × 10⁵/well) were cultured with CD4+CD25− T cells (responder T cells, Tresp, 1 × 10⁵/well), mitomycin C-treated splenic APCs (1 × 10⁵/well) and T-cell receptor (TCR) activation (anti-CD3ε and CD28 antibodies, 1 μg/mL) for 3 days. CD4+CD25+ Treg cells were used as suppressor control. After 3 days at 37°C, cells were pulsed with [3H]-thymidine (5 mCi/mL, PerkinElmer, USA) for 16−18 h. The suppressive assay was measured using a β-counter and the incorporation of [3H]-thymidine.
2.6 Quantitative polymerase chain reaction
The RNA extractions in liver sections were isolated using the REzol reagent (PROtech Technology Enterprise Co., Taiwan). The cDNA was converted with total RNA, 50 μM random hexamer primers (MDBio Inc., Taiwan), 10 μM deoxy-ribonucleoside triphosphate (dNTP) (Won-Won Biotechnology Co., Taiwan) and a Super-Script III RNase H− reverse transcriptase kit (Thermo Fisher Scientific). SYBR Green expressing assays were used for quantitative polymerase chain reaction (qPCR) on the StepOnePlus Real-Time PCR machine (Applied Biosystem, USA). The level of GAPDH mRNA was the internal standard for gene normalisation.
2.7 ELISA for cytokines and AMAs
The cytokine levels were determined by ELISA kits (R&D Systems, USA). The capture antibody against the target cytokine was diluted with PBS buffer and loaded in 96-well ELISA plates overnight. After blocking with 1% bovine serum albumin (BSA) in PBS buffer for 1 h, samples and standard cytokines were loaded for 2 h. After washing, the detection antibody against the target cytokine was added for 2 h. After washing, streptavidin–HRP (horseradish peroxidase) antibody was added for 20 min. Finally, 3, 3', 5, 5'-tetramethylbenzidine (TMB) substrate (Clinical Science Products, USA) was applied for 15 min before adding stop solution (1 N H2SO4). The absorbance value was measured at 450 and 540 nm.
The ELISA plate was coated with recombinant PDC-E2 (5 μg/mL), which was diluted with carbonate buffer (pH 9.6) at 4°C overnight. After washing and 1 h of blocking with 1% casein–PBS buffer at room temperature, the diluted serum samples were loaded to the coating plate for 2 h at room temperature. HRP-conjugated anti-mouse IgG and IgM (Invitrogen, USA) were loaded for 1 h at room temperature. TMB substrate was applied for 15 min before adding stop solution (1 N H2SO4). The absorbance value was measured at 450 and 540 nm.
2.8 Total bile acid assay
The level of serum bile acids was measured by a total bile acid assay kit (Abcam, UK). The serum and standards were diluted with double-distilled water (ddH2O) and reacted with the TBA probe mix for 10 min. The samples were mixed with the reaction reagents containing NADH and cycling enzymes and protected from light for 1 h. The absorbance value was read at 405 nm.
2.9 2-OA-OVA-induced mouse model
C57BL/6 mice (female, aged 8−10 weeks; n = 5 mice per group) were intraperitoneally immunised with 2-OA-OVA (ovalbumin) (20 μg) in the complete Freund's adjuvant (CFA) (Sigma–Aldrich). Every 2 weeks, mice were subsequently boosted with 2-OA-OVA and incomplete Freund's adjuvant (IFA) (Sigma–Aldrich). GalCer (2 mg, Cayman Chemical, USA) was diluted in PBS buffer and injected intravenously on the same day as the first immunisation. Mice were sacrificed 7 days after their last immunisation and then examined for cell infiltration by flow cytometry and histopathology in the liver. The titres of AMAs, cytokines and total bile acids in sera were analysed. The expression of mRNA in the liver was measured using qPCR. The microbiota diversity in the gut was analysed by 16S rRNA sequencing. All mice were housed and performed under license from the IACUC of the National Taiwan University College of Medicine.
2.10 Liver mononuclear cell isolation and measurement
All livers were perfused with PBS buffer, digested by collagenase for 1 h at 37°C, and re-suspended in 0.2% BSA–PBS buffer. After centrifugation, the parenchymal cells were deleted, and the non-parenchymal cells were separated by Percoll gradient. The 40% and 70% Percoll solutions were diluted with PBS buffer for the gradient. After Percoll gradient, the liver mononuclear cells were collected and washed with 0.2% BSA–PBS buffer twice. The cell numbers and viability were measured. The cell population of liver mononuclear cells was stained with fluorescence-conjugated antibodies and measured by flow cytometry.
2.11 Histopathological examination
Liver sections were cut and fixed with a 10% formalin solution. Paraffin-embedded tissue sections were made for histopathological examination. The collagen synthesis was analysed by Masson's trichrome staining, and the cell infiltration was determined by haematoxylin and eosin staining.
2.12 Stool DNA extraction
Microbiota DNA from faecal content was extracted using the QIAamp Fast DNA Stool Mini Kit (Qiagen, Germany). Stool samples were resuspended in InhibitEX buffer and reacted at 95°C for 5 min before being vortexed. After centrifugation, the clear supernatant was collected and added to buffer AL containing proteinase K, followed by 10 min of incubation at 70°C. The samples were mixed with ethanol and centrifuged, followed by washing with buffers AW1 and AW2. Finally, samples were centrifuged for 3 min with added buffer ATE to elute DNA.
2.13 Library preparations and sequencing
The prokaryotic 16S rRNA gene was amplified using 16S amplicon PCR forwards and reverse primers for the V3-V4 region, and 2× KAPA HiFi HotStart ReadyMix (KAPA Biosystems, USA). The PCR products (size of 550 base pairs) were purified with Agencourt AMPure XP beads (Beckman Coulter, USA) following the library preparation. A secondary PCR product of 16S rRNA V3-V4 region was carried out with the Nextera XT Index Kit and Illumina sequencing adapters (Illumina, USA). The indexed PCR product was qualitatively measured on the Qsep100TM system and Qubit 4.0 Fluorometer (Thermo Fisher Scientific). The libraries were finally submitted for sequencing on the Illumina MiSeq platform (Illumina).
2.14 Statistical analysis
Data were presented as the mean and standard deviation and analysed using GraphPad Prism 6 Software. All statistical analyses were measured using a one-way ANOVA, an unpaired two-tailed t-test, or a two-tailed Mann–Whitney U-test.
3 RESULTS
3.1 Treg/B cells expressed inhibitory molecules and exerted suppressive effects
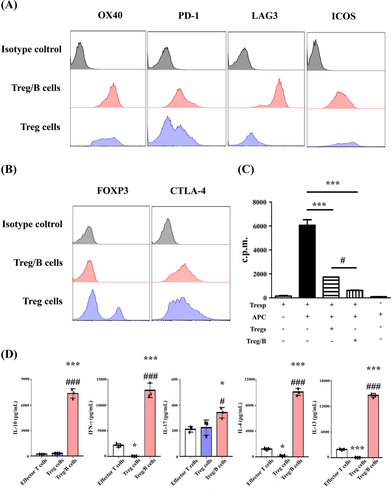
Treg/B cells were generated from the splenic cells and their phenotypes and functions were determined. After incubation with splenic B220+ cells and TCR activation, Treg/B cells showed higher expression of inhibitory molecules LAG3 and intracellular CTLA-4 than the Treg cells (Figure 1A). However, Treg/B cells did not express the master regulator FOXP3, which is found in Tregs (Figure 1B). To investigate whether Treg/B cells exerted suppressive effects, suppression of CD4+ T cells was analysed. The data showed that the suppressive ability of Treg/B cells was stronger than that of Treg cells (Figure 1C). In addition, the data showed that the IL-4, IL-10, IL-13 and IFN-γ levels in the supernatant of Treg/B cells group were higher than those of effector T cells or Treg cells (Figure 1D). These results showed that Treg/B cells exerted suppressive effects and inhibitory molecules, and were distinct from Treg cells, including the absence of FOXP3 expression and a different cytokine profile.
3.2 Treg/B cells reduced levels of serum AMAs, TNF-α and bile acids
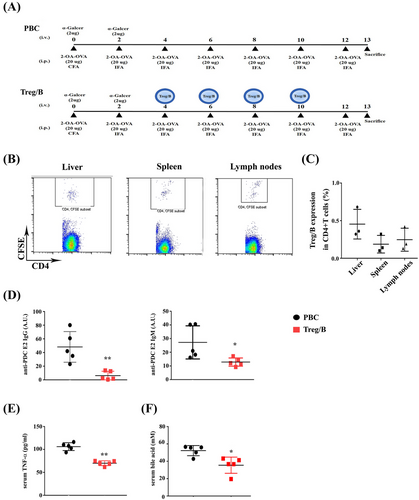
Treg/B cells show similarities in their immune regulatory characteristics with the Treg cells. Therefore, Treg/B cells were used in a murine model of PBC to investigate the therapeutic potential of PBC. CFSE+ Treg/B cells were determined using flow cytometry to determine the distribution of Treg/B cells in PBC-induced mice. CFSE+ CD4+ T cells were expressed in the liver, spleen and lymph nodes (Figure 2B,C). The presence of anti-PDC-E2 AMAs in the sera of patients was as the diagnostic hallmark of PBC. Notably, AMA reactivity develops in the early stages of the disease.30 Therefore, it might be aetiologically relevant. In this study, the titres of anti-PDC-E2 AMAs in sera were analysed to assess the therapeutic effects of Treg/B cells on PBC. After the induction of PBC for 13 weeks (Figure 2A), anti-PDC-E2 IgG and IgM levels in the sera of the treatment group were significantly reduced (Figure 2D). Serum TNF-α levels were also significantly lower in the treatment group (Figure 2E). However, the serum IFN-γ levels were no different between the two groups (data not shown). Recently, bile acids have been identified as effective biomarkers of PBC.31 Total bile acid levels in the sera of the treatment group were reduced (Figure 2F). These findings showed that Treg/B-cell treatment regulated the production of AMAs, proinflammatory cytokines, and total bile acids in the sera of PBC-treated mice. These data demonstrated the therapeutic potential of PBC.
3.3 Treg/B cells alleviated cell infiltration and modulated the immune response in the liver
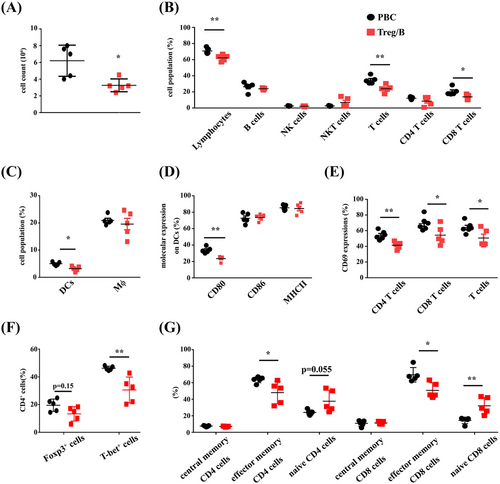
Cell infiltration was analysed using flow cytometry to determine the severity of liver inflammation. The findings represented that the total cell count in the livers of the Treg/B cells group was reduced (Figure 3A). The populations of lymphocytes, T cells and CD8+ T cells in the livers of the Treg/B cells group also showed a decreasing pattern (Figure 3B). Moreover, the expression of mature molecules and accumulation of macrophages and DCs in the liver were analysed. The data presented that the Treg/B-cell treatment decreased the percentage of DCs in the liver (Figure 3C). Furthermore, Treg/B-cell treatment significantly reduced CD80 expression in DCs. However, the expression of CD86 and MHC II in DCs was not different (Figure 3D). A decreasing trend was not observed in liver macrophages of the Treg/B cells group (data not shown). The data showed that Treg/B-cell treatment reduced cell infiltration and inhibited dendritic cells (DC) activation in the liver. To investigate whether Treg/B-cell treatment affects T-cell activation, CD69 expression was determined. The findings showed that Treg/B-cell treatment downregulated the CD69 expression in the CD4+ T and CD8+ T cells (Figure 3E). To determine whether Treg/B-cell treatment affected the assemblage of T-cell phenotypes, the proportion of FOXP3+ and T-bet+ CD4+ T cells was measured. The result presented that Treg/B-cell treatment significantly reduced the proportion of T-bet-expressing CD4+ T cells in the liver (Figure 3F). Additionally, antigen-specific T cells are highly converted into effector memory cells and accumulate in the peripheral tissues after chronic antigen exposure.32 Therefore, subtypes of memory CD4+ and CD8+ T cells were determined. Treg/B-cell treatment reduced the proportion of effector memory CD4+ and CD8+ T cells, but increased the proportion of naïve CD8+ T cells (Figure 3G). These results show that Treg/B cells have a therapeutic potential for PBC.
3.4 Treg/B-cell treatment reduced the levels of proinflammatory cytokines and collagen synthesis in the liver
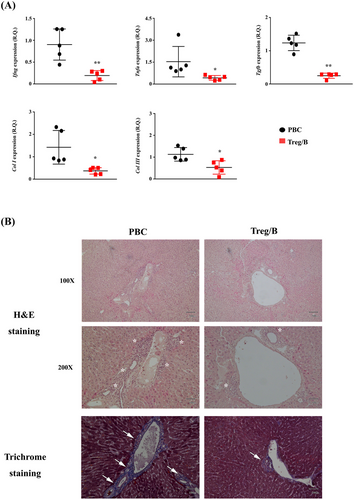
Inflammatory cells infiltrate liver tissues and release factors that induce collagen synthesis during PBC progression.33 In this study, the expression of proinflammatory genes, including Ifng, Tnfa, Tgfb, Col I and Col III, was analysed. Treg/B-cell treatment significantly attenuated the expression level of Tnfa. Notably, the gene expression of Ifng and Tgfb was reduced by half in the Treg/B cells group. The expression levels of Col I and Col III were significantly reduced by Treg/B-cell treatment (Figure 4A). To assess collagen synthesis and cell infiltration in the liver, liver sections were stained with Masson's trichrome, haematoxylin and eosin. Pathological analysis showed that cell infiltration and the level of collagen around the biliary ducts and blood vessels in the Treg/B cells group were significantly attenuated (Figure 4B). These findings showed that Treg/B-cell treatment reduced inflammation and attenuated the progression of PBC fibrosis in the liver.
3.5 Faecal microbial diversity in PBC was altered by Treg/B cells
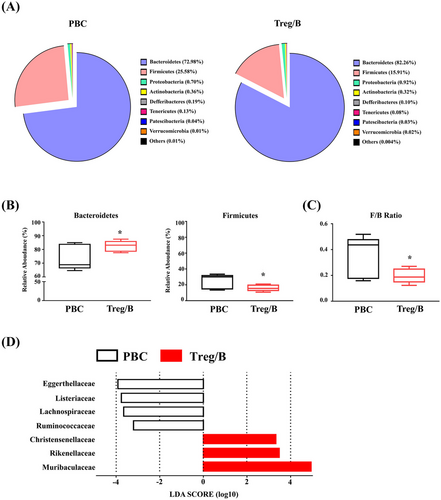
Alterations in gut microbial communities and increased total bacterial counts can result in immune dysregulation and lead to inflammatory disorders, such as allergies and autoimmune diseases.34 To investigate whether microbial diversity was affected by Treg/B-cell treatment, the faecal microbiota was analysed using 16S rRNA sequencing. The three most abundant phyla of microbial composition were Bacteroidetes, Firmicutes and Proteobacteria, which together accounted for approximately 99% of the total bacteria (Figure 5A). The Firmicutes/Bacteroidetes ratio (F/B ratio) is correlated with obesity and other diseases.35 Treg/B-cell treatment increased the relative abundance of Bacteroidetes and decreased the relative abundance of Firmicutes (Figure 5B). Furthermore, Treg/B-cell treatment significantly decreased the F/B ratio (Figure 5C). The LDA scores showed that the abundance of Muribaculaceae, Rikenellaceae and Christensenellaceae was enriched in the treatment group. In addition, Eggerthellaceae, Listeriaceae, Lachnospiraceae and Ruminococcaceae were enriched in the PBC group (Figure 5D). These findings imply that Treg/B-cell treatment changed the distribution of faecal microbiomes.
3.6 Treg/B cells modulated the maturation of LPS-treated BMDCs via a cell–cell contact mechanism
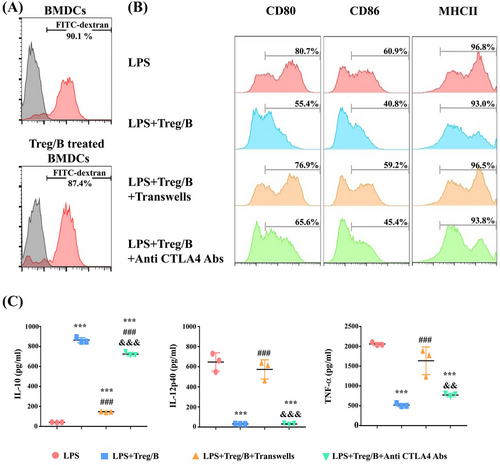
According to previous findings in this study, Treg/B cells attenuated CD80 expression in liver DCs of PBC-induced mice. To investigate whether Treg/B cells regulate the maturation of dendritic cells and to determine possible pathways, BMDCs were induced, cultured with Treg/B cells, and stimulated with LPS. As the phagocytosis affects the degree of maturation of DCs, the phagocytic ability of BMDCs was measured by FITC-dextran staining. The finding presented that the expression of FITC-dextran was similar in BMDCs cultured alone and in BMDCs cultured with Treg/B cells (Figure 6A). These findings suggest that Treg/B-cell treatment did not affect phagocytosis. Treg/B-cell treatment significantly downregulated the expression of CD80, CD86 and MHC II in BMDCs after LPS stimulation (Figure 6B). These results suggested that Treg/B cells might exert modulatory effects on the maturation of BMDCs. In addition, a transwell system was used to separate the Treg/B cells and BMDCs to elucidate the regulatory mechanisms of Treg/B cells. The expression of CD80, CD86 and MHC II was significantly reversed compared to that in Treg/B cells (Figure 6B). Furthermore, Treg/B-cell treatment attenuated the levels of proinflammatory cytokines in BMDCs following LPS stimulation (Figure 6C). These results indicated that Treg/B cells can inhibit maturation and regulate cytokine production in BMDCs via cell–cell contact.
3.7 Treg/B cells inhibited the maturation of BMDCs in part via the CTLA-4 pathway
To clarify whether inhibitory molecules expressed on Treg/B cells could regulate the maturation of BMDCs, antibodies against these molecules were added to the culture system. Compared to the LPS group, Treg/B cells exhibited downregulated expression of CD80, CD86 and MHC II in BMDCs. During the CTLA-4 blockade, CD80 expression in BMDCs was partially reversed (Figure 6B). The IL-12p40 and TNF-α levels did not increase, whereas the IL-10 levels decreased (Figure 6C). These data suggested that Treg/B cells inhibited the maturation of BMDCs partially via the CTLA-4 pathway.
4 DISCUSSION
PBC is characterised by immune dysregulation.36 The pathogenesis of PBC is mediated by adaptive immune response disorders, such as the production of AMAs and significant infiltration of T cells around the portal vein.37-39 The frequency and number of circulating monocytes are increased in patients with PBC, and these monocytes can produce higher levels of proinflammatory cytokines after stimulation with different toll-like receptor (TLR) ligands and promote Th1 differentiation via IL-12.40, 41 Furthermore, IFN-γ-mediated IL-12 and Th1 responses have been linked to the pathogenesis of autoimmune diseases.42, 43 In mice, the depletion of IL-12p40 prevents the development of cholangitis, including damage to biliary epithelial cells and cell infiltration around the portal vein. In 2-OA-induced PBC mice, IFN-γ deletion completely suppressed the inflammatory cell infiltration into the liver, prevented bile duct damage, and reduced AMA production. However, the deletion of either IL-12p19 or IL-23p35 is not adequate to prevent the development of cholangitis.44 Therefore, targeting the upstream immune responses may be feasible for the development of possible therapeutic strategies.
Antigen-presenting cells produce IL-12 in the setting of an infection.45 Dendritic cells (DCs) take up Ag–Ig complexes and present processed antigenic peptides to T cells. These CD4+ T cells also affect the activation of DCs, altering the priming of CD8+ T cells.46 IL-12 from APCs induces Treg cells to polarise into Th1-like cells and decreases the suppressive capacity of Treg cells.47 Activation of CD8+ T cells in patients with PBC was augmented by enhanced immune cross-presentation by DCs.37 Excessive activation of CD1c+ cells expressing high levels of CD80 and CD86 mediates PBC progression and negatively correlates with impaired Treg cells. After IgG stimulation, IL-12 production in the PBMCs of patients with PBC was increased compared to that in healthy controls.20 Treg cells from patients with PBC are sensitive to IL-12 and enhance IFN-γ production.21 These studies demonstrated the importance of APCs in PBC progression. These findings demonstrate that Treg/B cells decreased the production of IL-12p40 and TNF-α and attenuated CD80 and CD86 expression in BMDCs via cell–cell contact. Treg/B-cell treatment diminished CD80 expression in DCs and cell infiltration in the liver in a murine model of PBC. These results demonstrate that Treg/B cells regulate the DC activation.
T cells play an important role in the pathogenesis of PBC. The frequency and amount of effector memory T cells in the blood and liver of patients with PBC increase after chronic antigen stimulation of T cells.48, 49 The proportion of Th1 and Th17 cells in PBMCs from patients was higher than that in PBMCs from healthy individuals.50 After 2-OA immunisation, IL-17A−/− mice and IFN-γ−/− mice showed significant alleviation of bile duct damage and portal inflammation. In particular, IFN-γ−/− mice showed reduced lymphocyte infiltration.44 In addition, the number and function of Tregs were impaired in autoimmune diseases.51, 52 The lack of Treg cells resulted in CD8+ T-cell-mediated damage in IL-2Rα/CD25-deficient mice, and this finding was similar to those in patients with PBC.15, 53 Foxp3-deficient mice showed high levels of proinflammatory cytokines in the sera and liver.18 Administration of PDC-E2-specific Treg cells suppressed the proinflammatory capacity of myeloid DCs and Kupffer cells in the liver.54 Treg cells expressing higher levels of IL-10 and other inhibitory molecules predominantly reduced the pathological changes seen in murine autoimmune cholangitis.55 These studies suggest that Treg cells are critical for maintaining immune balance in PBC and reflect their therapeutic potential. The results of our study showed that Treg/B-cell treatment decreased the IFN-γ level, CD69 expression, percentage of T-bet-expressing CD4+ T cells, infiltration of CD8+ T cells, and collagen synthesis in the liver of the PBC-induced mice. Thus, these findings suggest that Treg/B cells may have therapeutic potential for PBC through modulation of T-cell activation.
CTLA-4, a regulatory receptor constitutively expressed in Treg cells, acts as an immune checkpoint and binds to CD80/CD86,56 resulting in the inhibition of cell cycle, downregulation of TCR signalling, cytokine production and decreased activation of APCs.57 CTLA-4-Ig impairs the migratory capacity of monocytes, inflammatory activity of synovial macrophages, and production of indoleamine 2,3-dioxygenase (IDO) in DCs in patients with rheumatoid arthritis.58-60 A recent study reported that the lower expression of CTLA-4, which is associated with the single-nucleotide polymorphism (SNP) allele variant CTLA-4-SNP rs733618, might promote the progression of PBC without affecting its general susceptibility.61 CTLA-4-Ig administration leads to reduced levels of pathogenic effector T cells and attenuates the severity of biliary cell destruction in 2-OA-induced cholangitis in murine autoimmune cholangitis.62, 63 In a clinical trial, CTLA-4 IgG (abatacept) treatment only altered the CD4+ T-cell subpopulation in circulating PBMCs from PBC patients with an insufficient response to ursodeoxycholic acid therapy.64 In our study, Treg/B cells predominantly expressed CTLA-4, and the administration of Treg/B cells attenuated cell infiltration and maturation of APCs in the PBC-induced mice. Treg/B-cell treatment suppressed the CD80, CD86 and MHC II expression in BMDCs via cell–cell contact in vitro. However, pretreatment of Treg/B cells with antibodies against CTLA-4 partially reversed the suppression of costimulatory molecule CD80 and only affected IL-10 production in BMDCs. This result suggested that other inhibitory mechanisms might mediate the suppression exerted by Treg/B cells.
The gut microbiota has been implicated as a significant contributor to the mucosal immune response and tolerance.34 The liver is highly exposed to circulating antigens and endotoxins released from the gut microbiota through enterohepatic circulation. Therefore, gut microbiota is critical for maintaining immune homeostasis.65 Alterations in the composition of gut microbiota lead to inflammation, bacterial translocation and immune cell infiltration in the liver. Therefore, recent investigations have focused on exploring the complex interactions of the microbiome–immune–liver axis.66 Our previous study showed that Treg/B-cell treatment could alleviate intestinal inflammation in the CD4+CD45RBhigh T-cell-induced colitis.26 The application of probiotics, prebiotics and antibiotics can reduce bacterial infections and hepatic encephalopathy in patients with cirrhosis.67-69 The composition of faecal microbiota in patients with PBC was different from that in healthy controls. An apparent decrease in the Bacteroidetes phylum but a marked increase in the Gammaproteobacteria and Firmicutes phyla was observed in patients with cirrhosis.70 After ursodeoxycholic acid treatment, the relative abundance of Bacteroidetes spp. increased, but not Pseudomonas spp. and Haemophilus spp., which decreased.71 Bacteroidetes and Firmicutes are the two primary phyla in the human gut microbiome. The F/B ratio is positively correlated with the inflammatory disease and obesity, and a changed F/B ratio is indicative of dysbiosis.35 In our study, Treg/B-cell treatment increased the relative abundance of Bacteroidetes and decreased the relative abundance of Firmicutes phyla. Therefore, the F/B ratio in the Treg/B cells group was significantly lower than that of the PBC group. In this study, the abundances of Rikenellaceae, Christensenellaceae and Muribaculaceae were increased in the treatment group, whereas the abundances of Eggerthellaceae, Listeriaceae, Lachnospiraceae and Ruminococcaceae were increased in the patients with PBC. Rikenellaceae and Christensenellaceae were increased in the feces of healthy individuals compared to the patients with PBC.31 Muribaculaceae can generate short-chain fatty acids (SCFAs) and digest mucin O-glycans to maintain microbial colonisation and balance of the intestinal mucus barrier.72, 73 The relative abundance of Ruminococcaceae and Rikenellaceae in feces was significantly reduced in the dominantly negative transforming growth factor beta (TGF-β) receptor II (dnTGFβRII) mice, a spontaneous animal model of autoimmune cholangitis, while the relative abundance of Lachnospiraceae, which participates in carbohydrate fermentation by SCFAs, was increased.74 The Eggerthellaceae family belongs to Coriobacteriia, and these bacteria play important roles in host lipid and xenobiotic metabolism.75 The Eggerthellaceae was increased in the feces of patients with PBC and excess fat mass.76 In comparison with the control mice, the relative abundance of Eggerthellaceae was increased in the mice with non-alcoholic fatty liver disease and was positively correlated with butyrate.77 The findings of our study showed the differences in the abundance of microbiota after Treg/B-cell treatment. These data indicate that Treg/B-cell treatment may affect the diversity of the gut microbiota by modulating immune responses in the gut.
In summary, Treg/B cells suppressed cell proliferation, expressed the inhibitory molecule CTLA-4, and secreted high levels of regulatory IL-10. Cell treatment reduced the levels of AMAs against PDC-E2, TNF-α and bile acids in sera; attenuated the expression of IFN-γ, TNF-α and TGF-β in the liver; decreased cell infiltration by reducing antigen presentation of DCs and T-cell activation; and decreased collagen synthesis in the livers of the mice with PBC. Furthermore, Treg/B-cell treatment affected the diversity of the gut microbiome in the PBC-treated mice. These data indicate that Treg/B cells may be a potential therapeutic target for PBC.
AUTHOR CONTRIBUTIONS
Yi-Lien Chen performed the experiments, analyzed the data and wrote the manuscript. Szu-Ying Chen set up the culture protocol of Treg-of-B cells. Ya-Hui Chuang directed the murine model of PBC. Bor-Luen Chiang directed the project.
ACKNOWLEDGEMENTS
The authors thank the Eighth Core Lab, Department of the Medical Research, National Taiwan University Hospital for the support with BD FACSVerse. The authors thank Biotools for the assistance with microbiota sequencing and analysis. The authors would like to appreciate BioRender.com for the convenience of the creation of the figures. This research was supported by research funds from National Taiwan University Hospital (NTUH.108-S4320 and 109C101-81) and Ministry of Science and Technology(MOST 107-2321-B-002-029).
CONFLICT OF INTEREST STATEMENT
The authors declare no conflicts of interest.
ETHICAL APPROVAL
All animal experiments were permitted by the Institutional Animal Care and Use Committee (IACUC) of the College of Medicine at National Taiwan University.
CONSENT FOR PUBLICATION
Not applicable.
[Correction added on July 15,2023 after first online publication: the Author Contributions, Acknowledgments, Funding, Conflicts of Interest, Data Availability Statement and Ethical approval has been updated]
Open Research
DATA AVAILABILITY STATEMENT
The data used and analyzed during the current study are available from the corresponding author on reasonable request.


