A pan-cancer analysis of Wnt family member 7B in human cancers
Rui Wang, Ni-sha Wu, and Li Wang contributed equally to this study and shared the first authorship.
Abstract
Background
Previous studies have highlighted the crucial role of Wnt7B in the development of various cancers, including breast, pancreatic, and gastric cancers. However, research into the involvement of Wnt7B is often confined to specific tumor types, with a noticeable lack of comprehensive studies spanning multiple cancer forms. The potential of Wnt7B as a diagnostic or prognostic cancer biomarker has not been fully explored.
Methods
In this study, we combined bioinformatics and immunohistochemistry analyses to examine the expression patterns and functions of Wnt7B in cancerous and adjacent noncancerous tissues across a range of tumors.
Results
Our data indicate that Wnt7B may serve as a novel prognostic biomarker and therapeutic target in certain cancers.
Conclusion
We found significant upregulation of Wnt7B expression levels in the majority of cancer cases examined. Furthermore, Wnt7B can influence cancer prognosis by modulating the tumor microenvironment, immune cell infiltration, and tumor stemness, among other factors. Additionally, we examined the associations between anticancer drug sensitivity and Wnt7B expression, which could aid in the development of more precise clinical therapies.
Abbreviations
-
- BRCA
-
- breast invasive carcinoma
-
- CHOL
-
- cholangiocarcinoma
-
- COAD
-
- colon adenocarcinoma
-
- COADREAD
-
- colon adenocarcinoma/rectum adenocarcinoma esophageal carcinoma
-
- ESCA
-
- esophageal carcinoma
-
- GBMLGG
-
- glioma
-
- HCC
-
- hepatocellular carcinoma
-
- HNSC
-
- head and neck squamous cell carcinoma
-
- IHC
-
- immunohistochemistry
-
- KICH
-
- kidney chromophobe
-
- KIPAN
-
- pan-kidney cohort
-
- KIRC
-
- kidney renal clear cell carcinoma
-
- KIRP
-
- kidney renal papillary cell carcinoma
-
- LGG
-
- brain lower grade glioma
-
- LIHC
-
- liver hepatocellular carcinoma
-
- LUAD
-
- lung adenocarcinoma
-
- LUSC
-
- lung squamous cell carcinoma
-
- MSI
-
- microsatellite instability
-
- OV
-
- ovarian serous cystadenocarcinoma
-
- PAAD
-
- pancreatic adenocarcinoma
-
- PCPG
-
- pheochromocytoma and paraganglioma
-
- READ
-
- rectum adenocarcinoma
-
- SARC
-
- sarcoma
-
- SKCM
-
- skin cutaneous melanoma
-
- STAD
-
- stomach adenocarcinoma
-
- STES
-
- stomach and esophageal carcinoma
-
- TGCT
-
- testicular germ cell tumors
-
- THCA
-
- thyroid carcinoma
-
- THYM
-
- thymoma
-
- TME
-
- tumor microenvironment
-
- UVM
-
- uveal melanoma
-
- Wnt7B
-
- Wnt family member 7B
1 INTRODUCTION
Cancer remains a leading cause of mortality worldwide, posing significant public health challenges. For 2022, the American Cancer Society projected that there would be 1,918,030 new cancer cases, leading to 609,360 cancer-related fatalities in the United States [1]. On a global scale, the number of new cancer diagnoses is expected to reach 28.4 million by 2040, marking a dramatic 47% increase from 2020. This estimate excludes basal cell carcinoma of the skin, but includes other nonmelanoma skin cancers [2]. Although cancer survival rates have improved [3], many survivors endure a range of challenges, including physical, cognitive, and psychological difficulties, stemming from the disease and its treatments, as well as associated economic burdens [4]. This emphasizes the importance of researching the molecular mechanisms underlying cancer biology to help develop precision-targeted therapies. Such therapeutic approaches aim to enhance treatment effectiveness while simultaneously reducing adverse side effects. The advent of targeted therapies has been propelled by technological advancements in genomics, transcriptomics, proteomics, and epigenomics, which are continuing to evolve. Therefore, identifying new biomarkers and establishing targeted treatment methods are essential for cancer therapy development.
The Wingless-related integration site (Wnt) proteins constitute a family present in numerous multicellular organisms, playing a pivotal role in mediating extracellular-to-intracellular signaling [5]. Beyond its vital functions in development and tissue homeostasis, the Wnt signaling pathway is dysregulated to various extents across a broad spectrum of chronic diseases. Furthermore, dysfunctions within this signaling pathway have been closely associated with human carcinogenesis, highlighting the significance of Wnt proteins in a cancer biology context and the potential for targeted therapeutic interventions [6-11].
Wnt7B, a member of the Wingless-Type MMTV Integration Site family, is a secreted signaling molecule with profound effects on developmental processes and carcinogenesis [10, 12]. It is involved in regulating cell fate and patterning during embryogenesis and exhibits low expression levels in normal adult lung, brain, and prostate tissues [13]. Wnt7B activation through the canonical Wnt signaling pathway plays critical roles in the growth, invasion, and metastasis of breast and pancreatic adenocarcinomas [14, 15]. Notably, breast cancer tissues show significantly elevated Wnt7B expression levels compared with benign breast tissues. The miR-640/Wnt7B axis has been shown to inhibit tumorigenesis via the Wnt/β-catenin signaling pathway in breast cancer cells, suggesting a potential therapeutic target for breast cancer [16]. Moreover, Wnt7B is a key factor in the differential activation of the Wnt/β-catenin pathway in pancreatic adenocarcinoma [14]. Additionally, Wnt7B can promote cell proliferation and metastasis in hepatocellular carcinoma (HCC) [17, 18]. In gastric cancer, Wnt7B and N6-methyladenosine methylation mutually enhance tumor progression and metastasis through the Wnt/β-catenin signaling pathway [19].
Autocrine activation of Wnt7B initiates the epithelial-mesenchymal transition process through the Wnt/β-catenin signaling pathway, facilitating metastasis in colorectal cancer [20, 21]. Additionally, Wnt7B is significantly expressed in prostate cancer (PC) [22], where androgen receptor-mediated signaling is critical for the development of castration-resistant prostate cancer and for acquiring osteoblast bone-responsive features in advanced PC cases. [23] Functional experiments have demonstrated that inhibiting the Wnt7B/β-catenin pathway can significantly reduce the proliferation, invasion, and migration rates of glioma cells, while also inducing apoptosis [24].
Although research on Wnt7B in human tumors has been confined to certain cancer types, there is a noticeable absence of comprehensive pan-cancer studies. Therefore, conducting a pan-cancer analysis of Wnt7B is crucial for identifying commonalities and disparities among various cancers. In this study, we leveraged public databases to thoroughly investigate and analyze Wnt7B gene expression patterns, associations with immune cell infiltration, and functional mechanisms across different tumor types. Our findings indicate that Wnt7B could potentially act as a reliable biomarker for predicting clinical outcomes and responses to immunotherapy in cancer patients, underscoring the importance of Wnt7B in the broader context of cancer research and patient care.
2 MATERIALS AND METHODS
2.1 Wnt7B expression and prognostic analyses
Analyses of Wnt7B expression and its association with patient prognosis across various cancer types were conducted using the “Cancer Exploration” module of the “TIMER2.0” database [25-27], accessible at www.cistrome.org. For cancers lacking corresponding normal tissue data, such as adrenocortical carcinoma (ACC), diffuse large B cell lymphoma (DLBC), and acute myeloid leukemia (LAML), the “Expression DIY” module from the “GEPIA2” database [28] was applied. Here, the “Box Plot” representation was selected to visualize differences in gene expression levels between cancerous and noncancerous tissues. Standard samples for this analysis were derived from “Match TCGA normal and GTEx data,” with the p value cut-off value set to 0.05 and log2 fold-change (FC) cut-off value set to 1. Data transformation was performed using log2 (transcripts per million (TPM)+ 1) for normalization, with the outcomes depicted as violin plots.
The “Survival Analysis” module of the GEPIA2 database was used to examine the patient overall survival (OS) and disease-free survival (DFS) rates associated with Wnt7B expression levels in various cancer types. This analysis employed the Cox proportional hazards model to determine the hazard ratios (HRs), comparing the median Wnt7B expression levels in the high and low expression groups. The 95% confidence interval (CI) of each HR was illustrated using a dotted line.
2.2 Wnt7B-associated immune cell infiltration analysis
The TCGA pan-cancer (PANCAN) data set, which was uniformly normalized and comprised 10,535 samples and 60,499 genes [29, 30], is accessible at http://genome.ucsc.edu. The Wnt7B gene expression data of each sample were extracted from this data set and aligned with GeneSymbol, which facilitated the compilation of gene expression profiles for each tumor type. Following this, the R package “ESTIMATE” was employed to calculate stromal scores, immune scores, and ESTIMATE scores for each patient across the various cancer types from their gene expression profiles. The ESTIMATE score represents a composite measure reflecting the proportion of stromal and immune scores within the tumor microenvironment (TME). The TIMER2 database was used to ascertain the relationships between Wnt7B expression patterns and different immune cell types. Analyses were conducted using several algorithms, including CIBERSORT, TIMER, CIBERSORT-ABS, XCELL, MCPCOUNTER, QUANTISEQ, and EPIC. These analyses focused on CD4+ T cells, CD8+T cells, B cells, neutrophils, dendritic cells (DCs), and macrophages. The “Purity Adjustment” feature was selected for these analyses, employing partial Spearman's correlation to assess the associations.
2.3 Wnt7B-associated immunotherapy analysis
For each sample, we extracted expression data from the pan-cancer data set for Wnt7B and 60 genes associated with immune checkpoint pathways, including 24 inhibitory pathways and 36 stimulatory pathways. The analysis focused on samples from primary blood derived cancer-peripheral blood and primary tumor, excluding all normal samples. Subsequently, we determined the Spearman's correlation value between Wnt7B expression and each immune checkpoint pathway to investigate their associations. The RNA-sequencing expression data (level 3) and corresponding clinical information were sourced from the TCGA data set, available at https://portal.gdc.com. Using this information, the tumor mutation burden (TMB) [31] and microsatellite instability (MSI) [32] values were calculated. Spearman's correlation analysis was then applied to explore the correlation between TMB/MSI levels and Wnt7B gene expression.
2.4 Gene enrichment correlation analysis
The STRING database was used to identify genes interacting with Wnt7B in human samples, with specific criteria set to refine the search. These parameters included a minimum required interaction score set to “low confidence (0.150),” indicating the threshold for including interactions in the analysis. The network edges were set to represent “evidence,” showcasing the nature of the underlying support for each interaction. The maximum number of interactors displayed in the first shell was limited to “no more than 50 interactors,” ensuring the network's manageability and focus on the most relevant interactions. Active interaction sources were specified as “experiments,” highlighting the preference for experimentally verified interactions involving Wnt7B-binding proteins. Further exploration of genes exhibiting any similarity to Wnt7B within tumors was conducted using the GEPIA2 database “similar gene detection” module. This analysis aimed to identify the top 100 genes that share expression patterns with Wnt7B across the TCGA Tumor data set. The relationships between Wnt7B and the top five genes with the most similar expression patterns were then examined using the GEPIA2 “correlation analysis” module, which uses Pearson's correlation analysis to quantify the strength and direction of these associations.
To visualize the correlations between Wnt7B and its related genes in various cancers, a dot plot was created using log2 TPM values, highlighting the p values and correlation coefficients (R). Additionally, the TIMER2 database “Gene_Corr” module was used to generate a heat map displaying the correlation in each cancer type. This module provided data on partial correlation (cor) and p values derived from the purity-adjusted Spearman's rank correlation test, offering a nuanced view of the interactions within the TME. A Venn diagram was generated to facilitate the intersection analysis and enable the identification of shared genes across different datasets or conditions. To prepare a new data set for gene enrichment analysis, the “Molecular Signatures Database” module of the Gene Set Enrichment Analysis (GSEA) database was accessed to download the c5.go.bp.v7.4.symbols.gmt subset as the background. Genes were mapped against this background set, with the R package “clusterProfiler (version 3.14.3)” used for enrichment analysis. This process resulted in gene ontology (GO) enrichment results. This adhered to the following criteria: a minimum gene set of 5, maximum gene set of 5000, p < 0.05, and false discovery rate (FDR) <0.1. Furthermore, the latest Kyoto Encyclopedia of Genes and Genomes (KEGG) pathway gene annotations were sourced from https://www.kegg.jp/kegg/rest/keggapi.html. Like in the GO analysis, genes were mapped to this data set and the “clusterProfiler” R package was used to conduct KEGG enrichment analysis with the following criteria: a minimum gene set of 5 genes, maximum gene set of 5000 genes, p < 0.05, and FDR < 0.1.
2.5 Drug sensitivity analysis
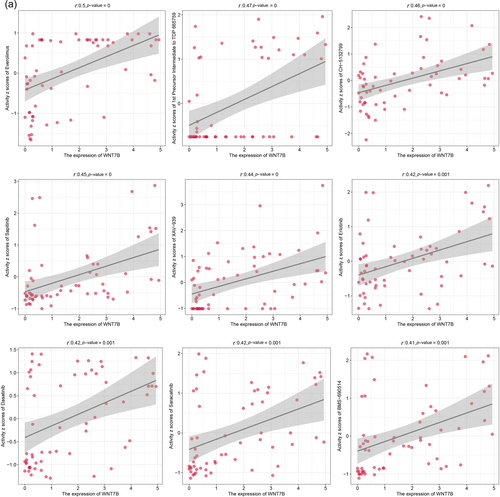
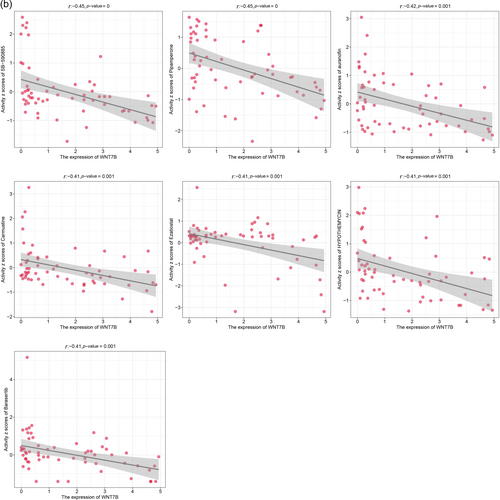
The CellMiner database was used to obtain drug sensitivity data for a range of cancer cell lines [33, 34]. These data were filtered according to clinical laboratory validation criteria and FDA approval status. To explore the relationship between Wnt7B expression patterns and the sensitivity of cancer cell lines to various drugs, Pearson's correlation coefficients were calculated. Significant correlations were visualized using the “ggplot2” software package. This analysis focused on identifying significant correlations, emphasizing the results with a correlation coefficient ≥0.4 and p < 0.01.
2.6 Immunohistochemistry (IHC)
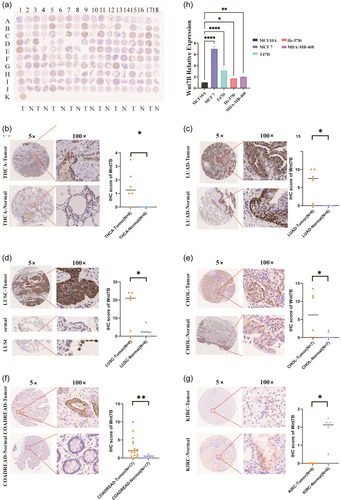
Tissue sections were acquired from Shanghai Xinchao Biotechnology Co., Ltd. Tissue procurement and sectioning were approved by the Ethics Committee of Shanghai Xinchao Biotechnology Co., Ltd. (Ethics Approval No. SHYJS-CP-2210040). This process included detailed clinical information of the patients. The tissue sections were deparaffinized in xylene, then rehydrated through a graded ethanol series, followed by antigen retrieval. The sections were then incubated with primary and secondary antibodies (GK800711). Subsequently, they were counterstained with hematoxylin (Sigma-Aldrich) for 1 min, immersed in 0.25% acidic alcohol for approximately 10 s, rinsed with tap water for 5 min, and finally mounted and coverslipped. The Allred scoring system was used for protein staining quantification, which involves scoring the positive staining as follows: 0 for less than 1%, 1 for 1%–25%, 2 for 26%–50%, 3 for 51%–75%, and 4 for more than 75%. The staining intensity was also scored on a scale from 0 to 3, where 0 indicates no staining, 1 indicates weak staining, 2 indicates moderate staining, and 3 indicates strong staining. A composite score was calculated by multiplying the intensity score by the Allred score, resulting in possible scores ranging from 0 to 12.
2.7 Cell lines and culture
The human normal mammary epithelial cell line MCF-10A was cultured in special medium from Pronosel (Catalog No. CM-0525). The human breast cancer cell lines MCF-7, T47D, Hs-578t, and MDA-MB-468 were cultured in Dulbecco's Modified Eagle's Medium (DMEM) with high glucose content (4.5 g/L glucose) provided by HyClone. This culture medium was enriched with 10% fetal bovine serum (FBS) from Biochannel and supplemented with 100 U/mL penicillin and 100 mg/mL streptomycin to prevent bacterial contamination. All cell lines were incubated under optimal growth conditions at 37°C and 5% CO2 in an incubator (SANYO MCO-175).
2.8 RNA extraction and quantitative real-time PCR (qRT-PCR)
Total RNA was extracted from breast cancer and normal breast cell lines using TRIzol Reagent from Servicebio. Approximately 1 μg of total RNA was reverse-transcribed into cDNA using the PrimeScript™ RT Reagent Kit with gDNA Eraser (Perfect Real Time) following the instructions from Takara. TB Green™ Premix Ex Taq II (Takara) was used for qRT-PCR assays on a CFX Connect™ Real-Time PCR Detection System (Bio-Rad). Wnt7B gene expression levels were quantified and normalized to β-Actin expression levels. Data analysis was performed using the comparative Ct method (ΔΔCt).
2.9 Statistical analysis
Statistical analyses were performed using the appropriate packages in R software (https://www.r-project.org/). Normally distributed data for continuous variables are reported as the mean value with the standard deviation (SD). Data that were not normally distributed are presented as the median value with the interquartile range (IQR). The Wilcoxon test was used to compare two groups, providing a non-parametric method for assessing differences between the median values. One-way analysis of variance (ANOVA) was used to evaluate the differences among three or more groups. Survival differences between groups were assessed using Kaplan–Meier analysis coupled with log-rank tests. Pearson's correlation coefficient was applied to examine the relationship between Wnt7B-related gene expression and drug susceptibility. Specific R software packages were used to visualize the results, especially the enrichment analysis data. The IHC results were analyzed according to the Allred scoring system for quantifying protein expression. The scores were further analyzed using paired Student's t-tests. p < 0.05 indicated statistical significance. All p values reported were two-sided.
3 RESULTS
3.1 Expression and prognostic analysis of Wnt7B
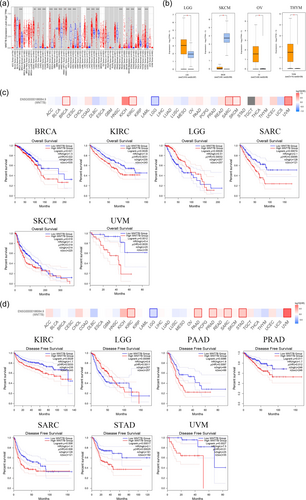
Analysis using the TIMER2 database revealed a significant upregulation of Wnt7B expression levels in tumor tissues compared with the corresponding normal tissues in various cancer types, including cholangiocarcinoma (CHOL), breast invasive carcinoma (BRCA), lung squamous cell carcinoma (LUSC), cervical squamous cell carcinoma and endocervical adenocarcinoma (CESC), colon adenocarcinoma (COAD), esophageal carcinoma (ESCA), head and neck squamous cell carcinoma (HNSC), lung adenocarcinoma (LUAD), rectum adenocarcinoma (READ), stomach adenocarcinoma (STAD), thyroid carcinoma (THCA), and uterine corpus endometrial carcinoma (UCEC) (Figure 1a, all p < 0.01). However, in glioblastoma multiforme (GBM), kidney chromophobe (KICH), kidney renal clear cell carcinoma (KIRC), and liver hepatocellular carcinoma (LIHC), Wnt7B expression levels were significantly lower in the tumor tissues (Figure 1a, all p < 0.001). Because of limited normal tissue controls in the TIMER2 database, the TCGA and GTEx data sets from the GEPIA2 database were investigated. These data further indicated that Wnt7B expression levels were significantly elevated in tumor tissues compared with normal tissues, except for in specific cases that showed higher levels in the normal tissues. In brain lower grade glioma (LGG), ovarian serous cystadenocarcinoma (OV), and thymoma (THYM), Wnt7B expression levels were notably higher in the normal tissues than in skin cutaneous melanoma (SKCM) (Figure 1b, all p < 0.05). Expression differences in the other tumor types examined did not reach statistical significance. As shown in Figure 1c, the correlations between Wnt7B gene expression patterns and patient survival rates for various cancers were also investigated using the GEPIA2 database. These results suggested that high Wnt7B expression is associated with poor overall survival in several cancer types, such as BRCA, KIRC, Sarcoma (SARC), SKCM, and uveal melanoma (UVM), while indicating good prognosis in others, such as LGG. High Wnt7B expression was associated with poor DFS in KIRC, pancreatic adenocarcinoma (PAAD), prostate adenocarcinoma (PRAD), SARC, STAD, and UVM, while the prognosis was good in LGG (Figure 1d, all p < 0.05).
3.2 Wnt7B-associated immune cell infiltration analysis
Next, we assessed the association between Wnt7B expression levels and cancer immune cell infiltration using the ImmuneScore and StromalScore. Significantly, Wnt7B expression correlated with immune cell infiltration, as shown by the ImmuneScore (Figure 2a). Positive correlations were observed in COAD (p = 6.5 × 10⁻⁸), Colon adenocarcinoma/Rectum adenocarcinoma Esophageal carcinoma (COADREAD) (p = 4.5 × 10⁻⁹), LIHC (p = 1.3 × 10⁻³), OV (p = 9.0 × 10⁻³), SKCM (p = 0.03), and Pheochromocytoma and Paraganglioma (PCPG) (p = 1.2 × 10⁻³). Negative correlations were observed in Glioma (GBMLGG) (p = 1.4 × 10−51), LGG (p = 1.5 × 10⁻³⁰), Stomach and Esophageal carcinoma (STES) (p = 3.8 × 10⁻¹²), Kidney renal papillary cell carcinoma (KIRP) (p = 2.3 × 10⁻⁵), Pan-kidney cohort (KIPAN) (p = 1.8 × 10⁻⁹), STAD (p = 4.2 × 10⁻⁴), Head and HNSC (p = 1.4 × 10⁻¹²), LUSC (p = 1.4 × 10⁻¹⁴), THYM (p = 4.6 × 10⁻³), Testicular Germ Cell Tumors (TGCT) (p = 1.2 × 10⁻⁷), and BLCA (p = 1.4 × 10⁻⁹). For the StromalScore (Supplementary Figure S1a), positive correlations were found in COAD (p = 3.5 × 10⁻⁹), COADREAD (p = 1.9 × 10⁻¹¹), BRCA (p = 3.8 × 10⁻⁹), LIHC (p = 4.9 × 10⁻⁹), READ (p = 6.6 × 10⁻⁴), SKCM-M (p = 4.7 × 10⁻⁴), SKCM (p = 0.04), OV (p = 4.9 × 10⁻⁴), LAML (p = 0.01), PCPG (p = 7.3 × 10⁻⁶), KICH (p = 0.02), and TGCT (p = 0.01). Negative correlations were found in KIRC (p = 2.3 × 10⁻⁸), GBMLGG (p = 2.0 × 10−67), LGG (p = 8.7 × 10−39), STES (p = 2.4 × 10⁻³), KIRP (p = 1.0 × 10⁻³), KIPAN (p = 5.8 × 10⁻¹¹), LUSC (p = 4.6 × 10⁻⁷), and BLCA (p = 4.0 × 10⁻¹³). Furthermore, the ESTIMATEScore (Supplementary Figure S1b) revealed positive correlations in COAD (p = 2.3 × 10⁻⁹), COADREAD (p = 3.9 × 10⁻¹¹), LIHC (p = 5.6 × 10⁻⁶), READ (p = 4.9 × 10⁻³), OV (p = 9.0 × 10⁻⁴), PCPG (p = 5.6 × 10⁻⁵), and KICH (p = 0.04), while negative correlations were observed in GBMLGG (p = 3.0 × 10−60), LGG (p = 3.9 × 10⁻³⁵), STES (p = 2.6 × 10⁻⁸), KIRP (p = 2.8 × 10⁻⁵), KIPAN (p = 3.3 × 10⁻¹¹), STAD (p = 0.04), HNSC (p = 1.1 × 10⁻⁶), LUSC (p = 6.9 × 10⁻¹²), KIRC (p = 2.8 × 10⁻³), THYM (p = 9.7 × 10⁻⁴), TGCT (p = 3.8 × 10⁻³), and BLCA (p = 4.4 × 10⁻¹³).
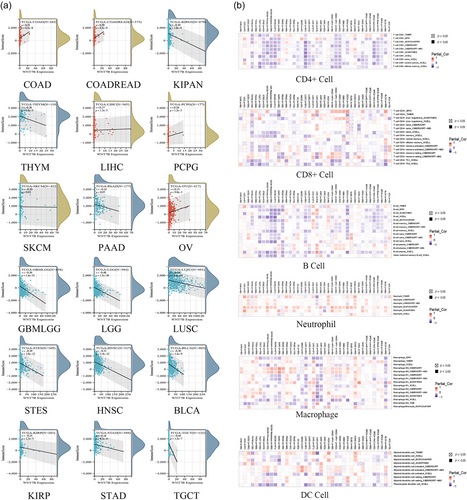
Different immune cell types can significantly influence the TME by affecting tumorigenesis, growth, and metastasis. Generally, a higher immune score suggests a better prognosis. Therefore, we hypothesized that for cancers such as COAD, COADREAD, and KIRC, patients with high Wnt7B expression levels may have a more favorable prognosis compared with those with lower Wnt7B expression levels. Conversely, for GBMLGG, LGG, and STES, the trend is possible. Using the TIMER2 database, which employs algorithms such as TIMER, CIBERSORT, CIBERSORT-ABS, QUANTISEQ, XCELL, MCPCOUNTER, and EPIC, we assessed the associations between Wnt7B expression patterns and immune cell infiltration across different cancers. Our findings indicate that CD8+ T cell infiltration is generally negatively correlated with most tumors, while neutrophil infiltration shows a positive correlation. CD4+ T cells, B cells, macrophages, and DCs exhibited varying levels of infiltration across different tumors (Figure 2b).
3.3 Wnt7B-associated immunotherapy analysis
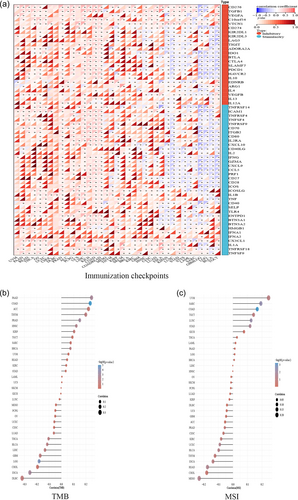
In 2017, the FDA approved the PD-1 inhibitor pembrolizumab for MSI-H solid tumors, marking a significant advancement in tumor immunotherapy development. As shown in Figure 3a, we analyzed the correlations between Wnt7B expression and 60 immune checkpoint genes using the UCSC pan-cancer data set. Negative correlations were observed between Wnt7B and genes such as PDCD1 in various cancers, including THYM, HNSC, ESCA, LUSC, STES, GBMLGG, LGG, BLCA, and TGCT. This suggests that increased Wnt7B expression levels may reduce PD-1 inhibitor effectiveness in these tumors. The TMB value, which is indicative of the neoantigen production capability of a tumor, was positively correlated with Wnt7B expression levels in cancers such as PAAD (r = 0.25, p = 0.01), COAD (r = 0.24, p = 9.88 × 10⁻⁶), THYM (r = 0.20, p = 0.03), PRAD (r = 0.15, p = 9.4 × 10⁻⁴), HNSC (r = 0.12, p = 6.88 × 10⁻³), and BRCA (r = 0.07, p = 0.02) (Figure 3b). This suggests that there may be a potentially higher immunotherapy efficacy with increased Wnt7B expression in these tumor types. Conversely, a negative correlation was observed between Wnt7B expression levels and TMB in ESCA (r = −0.26, p = 1.44 × 10⁻³), LGG (r = −0.19, p = 4.56 × 10⁻⁵), GBM (r = −0.18, p = 0.03), LIHC (r = −0.13, p = 0.03), BLCA (r = −0.12, p = 0.02), and THCA (r = −0.11, p = 0.02). A tumor being identified as MSI-H indicates that its somatic cells have undergone extensive mutations, resulting in significant neoantigen production. These neoantigens are unique to the tumor and can be easily identified by the immune system, enhancing the tumor's visibility to immune surveillance. Furthermore, the data in Figure 3c reveal that the MSI values positively correlated with Wnt7B expression levels in SARC (r = 0.20, p = 0.04), COAD (r = 0.17, p = 6.1 × 10⁻⁴), LUSC (r = 0.13, p = 5.4 × 10⁻³), and STAD (r = 0.19, p = 0.02), suggesting that tumors with higher Wnt7B expression levels could potentially be more easily recognized by the immune system. A negative correlation was observed between Wnt7B expression levels and MSI in MESO (r = −0.23, p = 0.03), READ (r = −0.18, p = 0.03), BLCA (r = −0.10, p = 0.04), and UCEC (r = −0.10, p = 0.03), indicating the opposite trend.
3.4 Gene enrichment correlation analysis
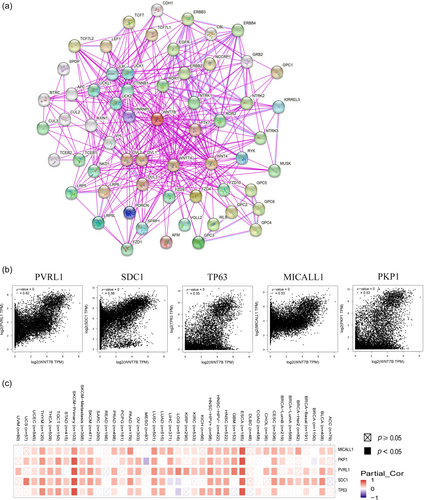
Next, gene enrichment analysis was conducted to explore the biological pathways and functions related to Wnt7B expression. Using the STRING tool, a network diagram of 60 proteins that have been experimentally shown to interact with Wnt7B was created (Figure 4a). GEPIA2 identified the top 100 TCGA pan-cancer genes with the highest correlations with Wnt7B expression. PVRL1 (r = 0.62), SDC1 (r = 0.56), TP63 (r = 0.55), MICALL1 (r = 0.53), and PKP1 (r = 0.53) showed the strongest associations (Figure 4b). The heat map shown in Figure 4c illustrates the positive correlations between Wnt7B and these genes across most cancers.
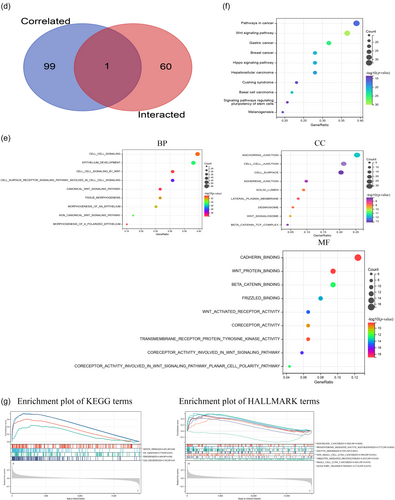
Further analysis involved the functional and mechanistic exploration of these genes (Figure 4d). GO enrichment analysis (Figure 4e) focused on molecular functions, like cadherin and Wnt protein binding, and biological processes, such as cell–cell signaling and Wnt signaling pathways. The cellular component category highlighted structures like anchoring junctions and cell surfaces. KEGG pathway enrichment analysis (Figure 4f) underscored the significance of the Wnt signaling pathway in various cancers, including gastric cancer, breast cancer, and HCC. Dividing the pan-cancer database samples into high and low Wnt7B expression groups revealed that high Wnt7B expression was associated with pathways linked to a variety of cancer types, as well as processes such as oocyte maturation and ubiquitin-mediated proteolysis. Low Wnt7B expression was correlated with olfactory transduction (Figure 4g). HALLMARK pathway analysis linked high Wnt7B expression to the mitotic spindle, E2F targets, peroxisome proliferation, and the G2M cell cycle checkpoint.
3.5 Drug sensitivity analysis
Utilizing the CellMiner database, we examined the impact of Wnt7B expression on drug sensitivity across various cancer cell lines. We discovered that drugs such as everolimus, TDP 665759, CH-5132799, and sapitinib exhibited significant positive correlations with Wnt7B expression, with sensitivity increasing as Wnt7B expression levels rose (Figure 5a). On the contrary, drugs like SB-590885, pipamperone, auranofin, and carmustine displayed increased effectiveness with lower levels of Wnt7B expression (Figure 5b). These findings indicate that Wnt7B expression could serve as a valuable predictive biomarker for drug responses, potentially aiding in establishing more precise cancer treatment regimens.
3.6 Wnt7B expression analysis
IHC analysis of a microarray with 180 tissues, adjusted for experiment-specific exclusions, resulted in 85 pairs of Wnt7B expression data (Figure 6a). This analysis revealed that Wnt7B protein was significantly overexpressed in THCA (p = 0.026), LUAD (p = 0.024), LUSC (p = 0.045), CHOL (p = 0.033), and COADREAD (p = 0.002) tissues compared with the respective adjacent nontumor tissues (Figure 6b–f). These IHC data corroborated our bioinformatics findings (Figure 1a). Conversely, KIRC (p = 0.014) showed lower Wnt7B expression levels compared with nontumors, also consistent with our previous bioinformatics results (Figure 6g). Further validation in breast cancer cell lines confirmed significantly higher Wnt7B expression levels compared with the normal epithelial cell line MCF-10A (MCF-7: p < 0.0001; T47D: p < 0.0001; Hs-578t: p = 0.0246; MDA-MB-468: p = 0.0029), consistent with both our bioinformatics analysis and IHC observations (Figure 6h).
4 DISCUSSION
In this study, we performed a pan-cancer analysis of Wnt7B gene expression and its impact on patient prognosis, revealing significant Wnt7B upregulation in various tumor types. While the IHC results aligned with most of our bioinformatics analyses, no statistical difference in Wnt7B expression was observed in BRCA, STAD, PAAD, and certain other cancers. The potential reasons for these findings include an insufficient sample size exacerbated by desquamation during experimentation, reducing reliability, because part of the paraffin sections of these cancer samples were not stained during the experiment. Furthermore, low IHC scores in tissue samples with few cancer cells could possibly mask statistical differences. For example, the IHC expression scores in all LIHC samples were zero, potentially caused by experimental error or poor tissue representation. Additionally, while exploring adenocarcinoma of the duodenum and Gastrointestinal Stromal Tumors (GIST), a trend toward higher Wnt7B expression was noted, but the data were not statistically significant. This was likely because of the limited sample size. Therefore, larger sample sizes may be necessary to accurately assess Wnt7B expression differences in these specific cancer types.
Our assessment of DFS and OS rates across various cancers suggested a significant link between high Wnt7B expression levels and poor prognosis in KIRC, SARC, and UVM patients. Conversely, good prognosis was associated with increased Wnt7B expression levels in LGG patients. Overall, Wnt7B is a potential prognostic biomarker in these cancers. However, the disparate results in KIRC, SKCM, and possibly other cancers highlight the need for further research to better understand the role of Wnt7B in these diseases. Our findings indicate that Wnt7B expression can either contribute to the inhibition or promotion of tumor progression. Given the small patient cohorts with high or low Wnt7B expression, larger studies are necessary to confirm these observations. Additionally, comprehensive molecular studies will be crucial for further elucidating how Wnt7B expression is involved in tumor pathogenesis.
Our study, utilizing the ImmuneScore and StromalScore, revealed a complex relationship between Wnt7B expression and the TME across various cancers. We found that Wnt7B expression levels were negatively correlated with the ImmuneScore in KIPAN, THYM, PAAD, GBMLGG, LGG, LUSC, STES, HNSC, BLCA, KIRP, STAD, and TGCT and positively correlated in COAD, COAREAD, LIHC, OV, SKCM, and PCPG. Additionally, significant associations were observed between Wnt7B expression levels and the degree of CD8+ T cell and neutrophil infiltration, highlighting their potential impact on tumor behavior. Tumor-infiltrating immune cells can significantly influence the TME and cancer progression, with the effects varying by cell type [35]. Gabrielson et al. [36] found that elevated CD8+ T cell infiltration in HCC and adjacent tissues correlated with reduced tumor recurrence. Neutrophils, which form tumor-associated neutrophils (TANs) at the tumor site, can both promote and suppress cancer through different mechanisms [37]. The observed correlations of Wnt7B expression levels with immune checkpoints, TMB, and MSI-H underscore its potential roles in modulating immune responses and enhancing immunotherapy effectiveness.
The association of high CD8+ T cell infiltration with lower tumor recurrence and the dual role of TANs in promoting or inhibiting tumor progression illustrate the complexity of immune responses in cancer. Furthermore, the significant correlations of Wnt7B expression with immune checkpoints, TMB, and MSI-H suggest that it has potential use as an independent prognostic biomarker. By influencing the regulation of immune and stromal elements, Wnt7B expression could be crucial for enhancing the efficacy of various immunotherapies.
In our gene enrichment analysis, we identified the genes closely associated with Wnt7B that play pivotal roles in cancer development and progression. PVRL1, an intercellular adhesion molecule, is crucial for cell-cell interactions and signal transduction, influencing tumor development and patient prognosis [38]. SDC1, a cell surface proteoglycan, is involved in cell signaling, adhesion, migration, and the regulation of cell proliferation and apoptosis [39]. TP63, which encodes the p63 protein, is vital for epidermal differentiation and may impact tumor occurrence and progression [40]. MICALL1 is associated with various biological processes and could influence tumor development [41]. PKP1, a cytoskeletal protein member, contributes to cell adhesion junctions, cell tight junctions, and polarity, playing a role in tumor progression [42]. Our findings highlight the intricate relationships between Wnt7B and these genes in tumorigenesis, offering insights into potential therapeutic targets.
This study has certain limitations that require attention and future resolution. The gene enrichment analysis indicated a potential role for Wnt7B through mechanisms such as the mitotic spindle, E2F targets, and peroxisome. However, we did not explore these aspects in depth, which will be the focus of forthcoming research efforts. Furthermore, our analyses predominantly utilized public databases and experimental IHC assays to confirm the varied expression patterns of Wnt7B. More extensive studies are required to thoroughly investigate how Wnt7B contributes to cancer pathogenesis and evaluate its feasibility as a therapeutic target across various cancer subtypes.
5 CONCLUSIONS
Wnt7B expression patterns across various tumors are intricately linked to the TME, immune infiltration, and immune checkpoints, indicating that Wnt7B could serve as an independent prognostic biomarker to assess patient prognosis and immunotherapy efficacy. While this study provides an initial understanding of Wnt7B-associated functions and mechanisms, further experimental validation is necessary to clarify its precise biological role in more detail.
AUTHOR CONTRIBUTIONS
Yan Liang, Yi Zhang, and Xiao-wei Qi contributed to conception and design of the study. Rui Wang organized the database. Ni-sha Wu performed the statistical analysis. Li Wang wrote the first draft of the manuscript. Zhi-zhao Zhang, Cheng-fang Wang, and Yan Wang wrote sections of the manuscript. All authors contributed to manuscript revision and read and approved the submitted version.
ACKNOWLEDGMENTS
None.
CONFLICT OF INTEREST STATEMENT
The authors declare no conflict of interest.
ETHICS STATEMENT
This study has been approved by Shanghai Xinchao Biotechnology Co., Ltd. (Ethics Approval No. SHYJS-CP-2210040) and operated in strict accordance with the ethical guidelines. In this study, we respect and protect the rights and privacy of participants and ensure the confidentiality of their personal information.
INFORMED CONSENT
Not applicable.
Open Research
DATA AVAILABILITY STATEMENT
The data sets generated during and/or analyzed during the current study are available from the corresponding author on reasonable request.


