Prediction of total carotenoids, color, and moisture content of carrot slices during hot air drying using non-invasive hyperspectral imaging technique
Abstract
The objective of this paper was to evaluate the performance of Partial Least Square Regression (PLSR) model and to assess the statistical agreement between two different measurement techniques, that is, Vis–NIR hyperspectral imaging (HSI) and standard laboratory methods for quality evaluation of dried carrots throughout the hot-air drying process. Carrots at commercial maturity of 3.5 months after planting were harvested in two seasons (2017 and 2018) and dried in a convective hot air dryer at 50°C, 60°C, and 70°C. Quality measurements were examined at intervals of 30 minutes. PLSR was performed as a regression model to predict quality attributes in carrots, while Passing–Bablok and Deming regressions alongside Blant–Altman analysis were applied as method comparisons. Excellent prediction performance for moisture content was observed with high R2T and R2v at 0.92 and 0.90 with values of RMSET and RMSEv at 8.15% and 8.16%. Satisfactory prediction accuracies were observed for total carotenoids (R2v = 0.64 and RMSEv = 32.62) μg/g, L* (R2v = 0.68 and RMSEv = 32.62), a* (R2v = 0.69 and RMSEv = 1.18), and b* (R2v = 0.60 and RMSEv = 1.45). Selected wavelengths for total carotenoids, moisture content, L*, a*, and b* based on the highest score of VIP loadings were 531, 973, 531, 531, and 680 nm, respectively. An adequate agreement of Blant–Altman analysis between the two methods within the upper and lower limits of 95% confidence interval (CI) were obtained for total carotenoids from 95.68 μg/g to 82.34 μg/g, moisture content (25.18% to 22.93%), L* (2.88 to −3.30), a* (4.15 to 3.43), and b* (4.53 to −3.11) with mean differences at 6.67, 1.12, −0.21, 0.36, and 0.71, respectively. Good correlation coefficients (r) were also observed at 0.89, 0.91, 0.78, and 0.83 for moisture content, L*, a*, and b* with a moderate correlation of total carotenoids at 0.69. The results indicate the potential feasibility of using non-invasive measurement of quality attributes using hyperspectral imaging during the drying of carrots.
Novelty impact statement
- non-invasive measurement using hyperspectral imaging for quality determination in carrots during convective drying demonstrated promising results.
- Multivariate analysis of Partial Least Square Regression showed a good modeling performance for quality prediction in dried carrots.
- A good statistical agreements between non-invasive quality measurements using hyperspectral imaging and standard laboratory analysis were achieved by comparative analysis using Blant–Altman plot, Deming, and Passing–Bablok regression.
1 INTRODUCTION
Fruits and vegetables provide essential nutrients and minerals with significant health benefits to humans. Adequate intake of fruits and vegetables for daily consumption is recommended for health maintenance and disease prevention (Slavin & Llyod, 2012). One of the most popular and nutritious vegetable crops with an appreciable amount of phytochemical constituents is the carrot (Ahmad et al., 2019). Carrots are considered as a primary vegetable in many countries and the crop is widely cultivated and consumed globally due to its nutraceutical properties and culinary attributes with pleasant taste and flavors (Surbhi et al., 2018; Liu et al., 2016; Arscott & Tanumihardjo, 2010). The roots are rich in phytonutrients such as carotenoids (particularly ß-carotenes), phenolic compounds, dietary fibers, and minerals. All these bioactive components possess specific health-promoting properties with a great potential for providing a protection mechanism against coronary heart disease and certain cancers (Surbhi et al., 2018; Da Silva Dias, 2014). Carrots can be eaten fresh and cooked into a variety of dishes or it can be processed into puree, juices, or dehydrated products (Nguyen & Nguyen, 2015; Arscott & Tanumihardjo, 2010). Fresh carrots can be converted into dehydrated form by drying and the dried carrots can be commercially used as a natural ingredient for the formulation and development of functional products such as dietary supplements, nutraceuticals, and cosmetics (Nguyen & Nguyen, 2015; Igielska-Kalwat et al., 2012; Anunciato & da Rocha Filho, 2012). The demand for dried carrots also rises in the instant food industry since the dried roots can be mixed with other ingredients for the development of instant soups and meals (Koca et al., 2007).
To this end, food producers are competing to produce high-quality of dried products with the need to have a reliable, accurate, and rapid assessment device for efficient quality assurance that could be advantageous for the food industry with an objective to minimize the overall operational time as well as to meet the consumer’s demand. Monitoring product quality along the production chain is very important in food processing in order to ensure the safety and quality of the end product (Pu et al., 2015).
In recent years, various non-destructive methods have been researched extensively and tested to evaluate the quality of fruits and vegetables starting from farm to retail market and some of them have commercially been applied for food grading and sorting in the packing houses and food processing lines (Kamal et al., 2019; Nicolaï et al., 2014). One of the most recent investigated non-destructive techniques is a hyperspectral imaging (HSI) which is capable to generate both spectral information and a spatial map simultaneously at a certain range of wavelengths and the acquired spectra are qualitatively related to the physical and chemical properties of the product. The key principle of HSI is by integrating both imaging technology coupled with spectrophotometry and this new hybrid technology has been comprehensively studied for evaluating the physical properties and internal qualities of fruits and vegetables during drying (Arefi et al., 2021; von Gersdoff et al., 2021; Sturm et al., 2020; Yu et al., 2020: Amjad et al., 2019; Liu et al., 2017). Recently, the potential usage of hyperspectral imaging was also documented for the identification of saccharin jujube (Zhang et al., 2020) and the retention of anthocyanin in purple-fleshed sweet potato during convective and microwave drying (Tian et al., 2021).
The applicability of this new generation of sensing technology for non-invasive measurement techniques has intensively been studied over the past 10 years in order to develop a quick, simple, chemical-free procedure and convenient application for quality evaluation of food materials during processing (Zhang et al., 2018). The use of existing standard laboratory analyses can be time-consuming, labor intensive, and require expert and skillful laboratory personnel with complex sample preparations and hazardous solvents. Moreover, the utilization of expensive instruments could contribute to the additional operating and maintenance cost. Therefore, it is necessary to explore and establish a new technology for rapid and effective quantification methods that could potentially be applied for online and real-time quality assessment during drying since this technique enables an automatic prediction of the quality attributes of fruits and vegetables in a non-destructive manner.
The most notable benefit of HSI is the ability to identify various components simultaneously and this method provides scientific tools for non-destructive quality inspection with minimal sample preparation and rapid acquisition times with simultaneous visualization of the spatial distribution of numerous chemical components (Elmasry & Sun, 2010; Wu & Sun, 2013). The spectral data include two-dimensional spatial vector array reflecting the spectrum at each pixel of the 3D image with a three-dimensional data set which is known as the data cube or hypercube. The resulting spectra from HSI must be extracted, processed, and interpret by means of chemometric methods, so that the large data set can be transformed into useful information, and finally a relationship between the target attributes and their corresponding hyperspectral data of the tested samples can be established (Bro et al., 2002). The most common chemometric algorithms are regression algorithms which can be classified into linear and nonlinear analysis such as partial least square regression (PLSR) (Pan et al., 2016). PLSR technique is widely used in the modeling of hyperspectral data due to its versatility in multivariate approaches and this model was performed for data computation in this study.
The ability of HSI to generate a large amount of spectral data over a wide range of wavelengths causes sizable amounts of redundant information due to multicollinearity with high covariance which requires high storage capacity and lengthy processing time (Baek et al., 2019; He & Sun, 2015). Therefore, the optimal variable selection method based on the Variable Importance in Projection (VIP) scores needs to be carried out in order to extract the most influential wavelengths in the multivariate models for specific quality attributes. The main goal of selecting the feature wavelengths is to improve the validation performance while eliminating uninformative data and thus, reducing the computation time (Baek et al., 2019; Chen et al., 2014). A higher VIP score indicates greater importance of the respond variable as a predictor (Rahman et al., 2018). Normally, a threshold value of VIP scores between 0.83 and 1.21 is highly significant and recommended (Chong & Jun, 2005).
For many years, regression analysis which is in accordance with the correlation coefficient has been used to evaluate and describe the strength of a relationship between two variables without providing their agreement (Doğan, 2018; Bilic-Zulle, 2011). The range of the correlation coefficient (r) from −1.0 to +1.0 indicates the strength level of the linear relationship between variables. The higher the correlation coefficient, the greater the strength of the relationship. However, according to Doğan (2018), a strong correlation does not necessarily suggest that the two methods can be performed interchangeably with a good agreement. In addition, data that appear to be in a weak agreement may generate very strong correlations or vice versa (Doğan, 2018). The comparative methods are necessary to confirm the reliability, stability, and accuracy of the new method whether it can be used interchangeably and replacing the conventional laboratory method for estimating the quality parameters of carrots during drying. This statistical approach is very common in medical science and clinical research, but very limited studies have been published on its application in the food science. This approach is very useful if a new measurement technique which has some advantages needs to be introduced over an existing measurement method (Gold standard). The new potential method must be validated in order to demonstrate its equal reliability, precision, and repeatability for the intended usage. The most common statistical analysis for method comparisons is Passing–Bablok and Deming regressions (Haeckel et al., 2013) as well as Blant–Altman analysis (Hanneman, 2008).
The Blant–Altman plot shows the mean difference between the measurements by two methods (vertical axis) and their mean (horizontal axis) with the addition of agreement limits (Hofman et al., 2015). Blant–Altman plots are commonly used to evaluate the agreement between two different instruments or two techniques of measurement such as comparing a new technique of non-destructive quality measurement using HSI with a gold standard of laboratory analysis in this study. Blant–Altman plots also allow any systematic discrepancy between measurements (i.e., fixed bias) or potential outliers to be possibly detected (Hannemen, 2008), while Passing–Bablok assumes both methods are highly correlated having a linear relationship (Passing and Bablok, 1983). Deming regression can be helpful and favorable for comparing analytical methods due to its robustness against outliers. This method also considers measurement errors between the test and reference methods (Giavarina, 2015; Cornbleet & Gochman, 1979).
In light of this, a new approach of method comparison using both regression techniques of Passing–Bablok and Deming regressions combined with Blant–Altman analysis will be tested in this study for assessing and comparing the performance of this new method of non-destructive measurement using HSI with a standard laboratory method.
The main objectives of the current study were as follows: (1) To evaluate the performance of PLSR modeling for predicting the quality attributes in carrots during drying, (2) To determine the important wavelengths which correspond to specific quality attributes based on the highest score of Variable Importance in Projection plots (VIP), and (3) To evaluate the statistical agreement between conventional laboratory methods with non-destructive measurements of HSI using Passing–Bablok and Deming regressions alongside with Blant–Altman analysis for method comparisons.
2 MATERIAL AND METHODS
2.1 Raw materials
Organic carrots (var. Laguna) at an optimum maturity of 3.5 months after planting were harvested at different seasons during autumn (2017) and summer (2018) from the University of Kassel’s farm in Frankenhausen, Kassel, Germany. All carrots from both seasons were harvested in the morning prior to drying experiments. The average daily temperatures for both seasons were 16°C and 28°C, respectively. Therefore, the harvested roots were observed to have different characteristics with large variations of total carotenoids content and color intensity. The observations were confirmed by a study conducted by Brunsgaard et al. (1994). The authors reported significant variations of chemical compositions in different varieties of carrots harvested from two consequent years of 1990 and 1991. After that, the roots were washed with distilled water, peeled, and sliced by using a food slicer (Graef, E21EU, Germany) prior to all drying experiments. The exterior diameter for each slice was kept constant at 2.5 ± 0.1 cm by using a custom-made rounded stainless steel cutter. The diameter of carrots was measured manually using a Vernier caliper (Kinzo, 98,618, Netherlands).
2.2 Drying procedure
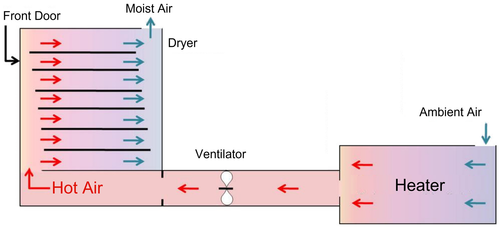
Drying experiments from both years were carried out using a small-scale commercial dryer (Innotech Ingenieursgesellschaft, HT mini, Germany) at a constant air rate of 0.6 m/s. The dimensions of the dryer are 50 × 40 × 60 cm (L × W × H) as in Figure 1. The humidity in the dryer was in the range between 6% and 10%. The first drying experiment which was conducted in 2017 investigated the effect of different drying temperatures and thickness on quality changes in carrots (Md Saleh et al., 2019). In this experiment, about 200 g of sliced carrots of different thicknesses of 3 and 6 mm were placed as a single layer in the dryer and dried at 50°C, 60°C, and 70°C. The second experiment on critical control point-based intermittent drying was carried out in 2018 (Md Saleh et al., 2020). During the trial, 50 g of sliced carrots of the thickness of 3.5 mm was used in the study. The sliced carrots were subjected to different combinations of drying strategies based on intermittency at the critical point of quality degradations. The samples were dried at 60°C and 70°C, and tempering was conducted for 1 and 3 h at 30% and 40% moisture levels. All experiments from both drying strategies were performed in three replicates. Before each drying run, the dryer was started 1 h in advance to reach steady-state conditions. The initial moisture content of carrots was determined according to the AOAC method (2012) by drying the sample in an oven at 105°C for 24 h (Mermert, ULM 400, Germany). The initial moisture content of the fresh carrots was recorded to be around 88% (7.54 gw/gdm ± 0.3). The drying process for both experiments takes place in a single layer. Samples withdrawal prior to hyperspectral imaging and laboratory analysis for moisture content, color, and total carotenoids throughout the drying period were carried out every 30 minutes for both experiments. For every drying point, four slices from four roots for each replicate were evaluated and a total of 12 slices per drying point were used in this study. The same slices were used for both non-destructive analysis of hyperspectral imaging and laboratory analysis in order to ensure consistency. Moisture content was determined by weighing the samples manually using an electronic balance (Sartorius, E2000D, Germany) until the samples reached a final moisture content of 10% (0.10 ± 0.02 gw/gdm) (Zhao et al., 2014).
2.3 Measurement of color
Color measurements were performed using a Minolta chroma meter (Minolta, CR-400, Japan). The chroma meter was calibrated against a standard white reference tile prior to sample measurements. The observer used was 2° closely matches CIE 1931 Standard Observer with a silicon photocells detector and a setting illuminant at °C and D65 (Anon, 2002). The color was determined on four slices from four roots at each measurement point for each replicate. For each slice, measurements were taken at two points on the surface and the results were averaged over the slice. The color measurements were carried out based on the three-dimensional color space of CIE L*a*b* scale where L* represents the brightness of the color, a* shows the hue color from red (+) to green (−), and b* lies between yellow (+) and blue (−) (Joshi et al., 2009).
2.4 Determination of total carotenoids
2.5 Hyperspectral imaging system
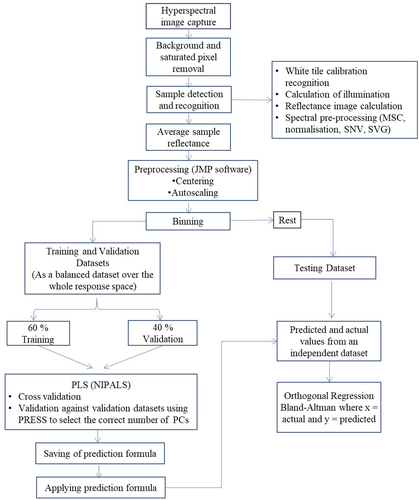
The image of the samples was captured by employing a hyperspectral imaging system (model: V10E PFD, Specim Spectral Imaging Ltd., Finland) equipped with a 35 mm lens (Schneider Optische Werke GmbH, Xenoplan 1.9/35, Germany) and a linear translation stage (Specim Spectral Imaging Ltd., Finland). The illumination system consisted of three 60 W halogen lamps positioned at an angle of 45°. A set of four slices of carrots along with a white tile were captured at each drying point in the spectral range of 400–1010 nm. A total of 1368 carrot slices from two growing seasons were used in this study. The average spectrum from three replicates for every drying point was used for further computations. It is noteworthy that dark images were taken by closing the shutter to take the sensor noise into consideration.
2.6 Image processing and visualization
2.7 Multivariate analysis
2.8 Methods comparison
The Bland–Altman (BA) analysis, Passing–Bablock (PBR), and Deming regression (DR) were used as a method comparison in this study for assessing the agreement between the destructive laboratory method and non-destructive HSI technique for all quality parameters. The BA method is expressed as 95% agreement limits, that is, determined by mean difference ± 1.96 standard deviations and these values describe the range within which most differences will exist between the two methods. Therefore, the smaller the range between these two limits the better is the agreement between the two methods (Carkeet & Goh, 2018). The aim of BA analysis was to identify and assess significant trends in the graph which can be either a constant bias or a nonconstant bias as well as variance heterogeneities (Bland & Altman, 1999; Carkeet & Goh, 2018). A graphical plot with scattered data points around the regression line with an ideal value of slope equals 1 and an intercept equals to zero (0) will be displayed after computation in PBR. However, the experimental results can divert from the ideal values in various ways (Shrestha et al., 2019). So the test method’s bias can be measured by the difference between the regression line (fitting line) and the equality line (y = x). The linear regression analysis technique of PBR was also used to estimate the agreement of the analytical methods and to detect possible systematic bias between both measuring methods which is a statistical and nonparametric test procedure (Arendse et al., 2018). The basic principle of the DR (Orthagonal) technique is fitting a straight line to two-dimensional data where both variables, X and Y, are measured with error which are proportional to the overall average value of the test and comparative results for each sample (Sârbu et al., 2000).
3 RESULTS AND DISCUSSION
3.1 Multivariate analysis of partial Least Square regression (PLSR)
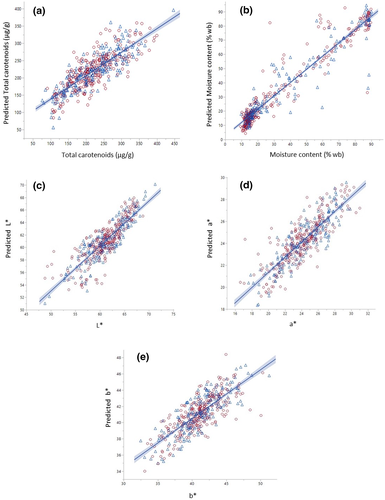
Figure 3 and Table 1 show statistical parameters with satisfactory prediction accuracy of R2 for both validation and training sets for all quality attributes. The results obtained indicate substantial variations for each individual slices leading to an acceptable measurement accuracy. These divergences might be attributed to irregular shapes and size of each slice such as severe shrinkage, curvature, and folded surface at certain drying points resulting in varying degree of physical disfiguration of carrot slices causing light dispersion and finally resulting in spectral deviations.
| Quality parameters | Statistical parameters and selected wavelengths | |||||
|---|---|---|---|---|---|---|
| Calibration | Validation | Root MeanPRESS | Selected wavelengths based on VIP scores | |||
| RMSET | RMSEv | |||||
| L* | 0.78 | 1.56 | 0.68 | 1.75 | 0.63 | 531, 592, 654, 685, 960, 980 |
| a* | 0.77 | 1.06 | 0.69 | 1.18 | 0.57 | 531, 600, 624, 660, 685, 975 |
| b* | 0.67 | 1.40 | 0.60 | 1.45 | 0.77 | 531, 592, 629, 650, 680, 960 |
| Moisture content (% wb) | 0.92 | 8.15 | 0.90 | 8.16 | 0.32 | 531, 585, 973 |
| Total carotenoids (μg/g) | 0.74 | 28.68 | 0.64 | 32.62 | 0.61 | 531, 598.97, 623, 654.03, 685, 970 |
- Abbreviations: , Coefficient of determination for training set; , Coefficient of determination for validation set; RMSE T, Root Mean Square Error for training set; RMSEv, Root Mean Square Error for validation set; Root Mean PRESS, Root Mean of Predicted Residual Sum of Squares.
It was also reported that light scattering greatly depended on the physical properties of the produce’s tissue (Udomkun et al., 2014). Moreover, high variability of physical characteristics in food materials will reduce prediction accuracy because it will directly impact the optical properties, lightness distribution as well as interaction behaviors with incident light (Zhang et al., 2018). An acceptable statistical performance from the data sets was observed with satisfactory values of R2T for training set at 0.74, 0.92, 0.78 and 0.77, and R2v for the validation set at 0.64, 0.90, 0.68, and 0.69 for total carotenoid, moisture content, L* and a*, respectively (Table 1). A strong correlation to predict moisture content between the two methods was observed in this study with a high coefficient of determination (R2) of more than 0.9 for both data sets (Table 1). Similar results were obtained by Elmasry et al. (2007). The authors reported identical values of R2 at 0.90 when evaluating moisture content in strawberries during ripening. An acceptable prediction accuracy of total carotenoids was also observed in this study with a value of R2T at 0.74 and R2v at 0.64 (Table 1) which is comparable to previous result reported by Rungpichayapichet et al. (2015) on the prediction of β-carotene content in mangoes during ripening. The authors reported an R2 at 0.64 and 0.84 with standard errors of prediction at 20.81 and 14.61 for both calibration and validation data sets when the samples were subjected to a long wave of NIR at 1000–2500 nm. Other nutrients such as vitamin C in different varieties of apples also showed a similar trend with a value of R2 at 0.8 when using NIR spectroscopy in the region between 400 and 2500 nm (Pissard et al., 2013). In this present study, low R2 at 0.67 and 0.59 were observed for the color parameter b* for both training and validation data sets which indicate an error might occur from both measuring methods due to curvature or glossiness of the sample’s surface (van Roy et al., 2017). It was also mentioned that the curve surface of fruits and vegetables will cause uneven light distribution leading to variability in spectral absorbance and finally affecting the prediction accuracy of chemometrics models (Zhang et al., 2015). Nonuniform color distribution during drying also impacts visible differences in appearance and texture that could trigger the irregularity in spectrum pattern since color changes during drying were not homogeneous (Fernandez et al., 2005). Similar results were also obtained by van Roy et al. (2017) and Larraín et al. (2008) on the color parameter of b* for tomato and beef by using hyperspectral imaging and digital imaging with low R2 at 0.42 and 0.56, respectively. Furthermore, irregular sample surface, size, and geometry also influence the reflectance variability especially if the window or sensor of the instrument is not completely cover the product surface leading to inaccurate color measurements (van Roy et al., 2017). Minimal values of RMSET and RMSEv for both data sets were also observed for moisture content, L*, a*, and b* at 8.15, 1.56, 1.06, and 1.40 for training set, and 8.16, 1.75, 1.18, and 1.45 for validation set, respectively. It was noted that a large range of RMSET and RMSEv at 28.68 and 32.62 were observed for total carotenoids in both data sets as compared with other quality attributes (Table 1). The results suggest high variation of total carotenoids due to different levels of thermal degradation during drying and vast measurement errors leading to a wide range of total carotenoids concentration across the whole data sets. A similar trend was also reported by Ihsan et al. (2019) on high RMSE at 39.21 for carotenoids content in apple leaves using hyperspectral imaging with a range of wavelength from 400 to 1000 nm. Moreover, high variation in spectral reflectance related to total carotenoids can be caused by scattering effects of the tissue and consequently impacting the spectral intensities (Zude et al., 2007). Furthermore, the large variations of total carotenoids in this study might be due to the heterogeneity of total carotenoids for each slice because of different harvesting seasons and years since the nutritional compounds of carrot were reported to vary with season (Horvitz et al., 2004) and environmental conditions (Rosenfeld et al., 1998). In addition, different drying strategies from two different drying experiments in this study also caused varying degree of total carotenoids degradation since it was mentioned that different drying techniques will strongly influence the decomposition of carotenoids (Cui et al., 2004),
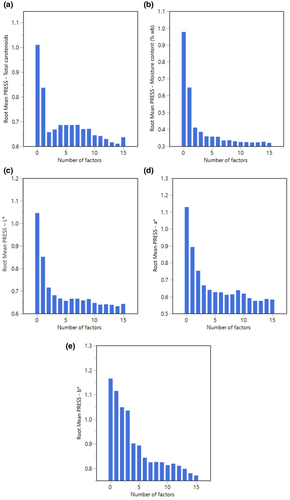
Table 1 and Figure 4 present optimum latent variables of 14, 15, 14, 13, and 15 with the least Root Mean PRESS at 0.61, 0.32, 0.63, 0.57, and 0.77 for total carotenoids, moisture content, L*, a*, and b*, respectively. The number of latent factors with the least PRESS values was selected in this study according to Shrestha et al. (2019) and Khodabakhshian et al. (2017). These factors were chosen in order to prevent overfitting of the data due to choosing too many latent variables or inadequate fraction of training and testing data sets and also underfitting caused by selecting a low number of variables (Shrestha et al., 2019). Thereby, these optimal factors were sufficient for capturing and modeling the data variability. The respective latent factors in PLSR were employed for simultaneous identification of the analytes using the validation method across all the spectral data. It is also possible to analyze the interrelation between quality attributes in order to relate the interaction between quality parameters that could influence the spectral pattern as reported by Schmilovitch et al. (2014). The authors observed a satisfactory level of R2 at 0.70 for the interaction between total soluble solids and total carotenoids which indicates the possibility to apply HSI with the consideration to oversee the correlation between relevant qualities attributes. In this study, the excellent prediction accuracy of R2 at 0.85 and low Root mean PRESS at 0.47 were obtained when two responses of total carotenoids and moisture content were analyzed together showing a significant correlation between these two variables during the drying process. The results were confirmed by our previous work on the influence of moisture content on total carotenoids retention during drying (Md Saleh et al., 2019). There is also a possible interaction between color parameter a* with both moisture content and total carotenoids in carrots during drying which shows a good correlation of R2 at 0.76 with low Root mean PRESS value at 0.52 (Table 2). However, a moderate correlation of R2 between a* and total carotenoids was observed at 0.69 with a slightly higher value of Root mean PRESS at 0.58. The above computed outputs from PLSR modeling provide encouraging results with useful information on the possibility to apply non-invasive quality measurements to facilitate the online monitoring of the drying process. However, continuous method improvements must be carried out before it can be implemented into practical applications since considerable variability of resulting spectra for each individual slice was observed in this study, indicating a challenging task for upgrading and refining both procedures along the processing chain.
| Quality parameters | Statistical parameters | |
|---|---|---|
| R2 | Root Mean PRESS | |
| Interaction between moisture content (% wb) and total carotenoids | 0.85 | 0.47 |
| Interaction between a* and total carotenoids | 0.69 | 0.58 |
| Interaction between a*, moisture content and total carotenoids | 0.76 | 0.52 |
- Abbreviations: R2, Coefficient of determination; Root Mean PRESS, Root Mean of Predicted Residual Sum of Squares.
All aspects of quality management need to be optimized and standardized starting from the preparation of the raw material to the end products with a constant development of a new simplified algorithm for efficient and reliable data extraction, processing, and computation since all variations greatly depend on instrumental noise, complex chemical composition of products, environmental factors, and other sources of variations that can complicate the resulting spectrum (Li et al., 2018; Liu et al., 2015).
3.2 Analysis of spectral reflectance and wavelength selection based on VIP plot
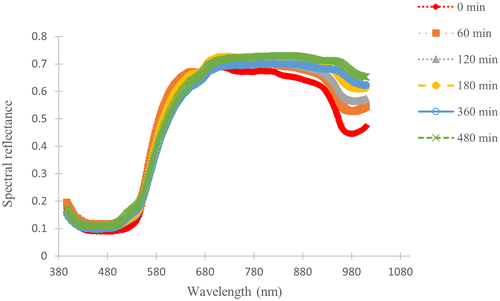
The average spectral reflectance of carrots over the range of wavelength from 400 to 1010 nm at different time points of the drying process is shown in Figure 5. Similar trends of spectra were observed for all measurement points indicating consistent changes of reflectance throughout the drying process. Lower reflectance intensities were observed in fresh samples in the regions between 500 to 540 nm and 900 to 980 nm. However, the reflectance values increased with an increase in drying time due to degradation of total carotenoids and reduction of moisture content. This is due to the fact that both regions correspond to total carotenoids and moisture content absorption peaks (Chaudhry et al., 2018; Liu et al., 2016). Changes in spectral reflectance in both regions during drying are related to the decomposition of color and changes in chemical compositions due to thermal damage of total carotenoids and moisture losses during drying. Furthermore, changes in spectral reflectance are caused by changes in absorption and scattering properties of fruits and vegetables during drying. These changes are influenced by physico-chemical transformations of chemical components, hardness, microstructure, and texture of the products which are induced by process conditions during convective drying (Mozaffari et al., 2016). According to Mozaffari et al. (2016), changes in spectral profile of laser backscattering imaging during drying of apples were closely related to enzymatic oxidation, nonenzymatic browning as well as degradation of color and carotenoids. In the case of carrots, any noticeable changes in color can be correlated with degradation of total carotenoids and nonenzymatic browning (Koca et al., 2007). Therefore, changes in the spectral pattern can be a potential indicator to predict both color and total carotenoids transformation and the application of non-invasive quality evaluation using HSI is helpful for evaluating the dynamic changes during drying without interrupting the process.
The VIP plots of total carotenoids, moisture content (%wb), L*, a*, and b* of carrots at 323 wavelengths from 500.55 to 1006.58 nm are displayed as in Figure 6. In this study, any wavelengths with a VIP score of more than 0.8 are considered as an important and significant wavelength for quality prediction (Shrestha et al., 2020). VIP plots also indicate which X variables (wavelengths) had the most influence on a model. The most influential wavelengths which correspond to the quality attributes of carrots were selected based on the highest loading of VIP scores in this study. It was found that the highest peak of spectral reflectance was dominant at certain wavelengths displaying different spectral signatures for specific quality attributes. Figure 6 (a) and Table 1 show noticeable peaks at the wavelength between 520 to 545 nm and the highest peak in that region was observed at 531 nm which can be attributed to total carotenoids content (Haas et al., 2019). A spike of peaks in the wavelength regions between 500.55 and 685.71 nm is illustrated in Figure 6c–e which might be related to color of carrots as denoted by the color parameters of L*, a* and b*. The highest peak for L*, a*, and b* were observed at 531, 531, and 680 nm, respectively, which might be related to chlorophyll “a” in carrots (Zude et al., 2008). It was reported that wavelength peaks from the region of 430–670 nm correspond to Chlorophyll a, and from 460 to 640 nm to Chlorophyll b. The range of carotenoid peaks was observed from the region from 470 to 530 nm (Chaudhry et al., 2018). So, the selected wavelengths obtained in this study for total carotenoids and color were close and within the particular regions as reported in the previous literatures.
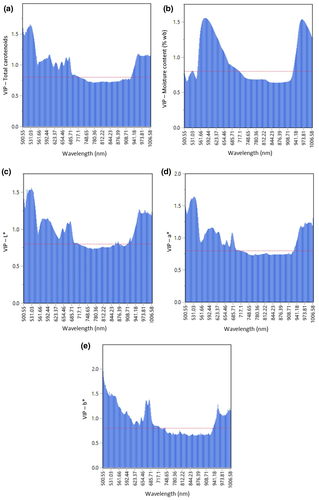
An apparent peak in the region between 959.11 to 985.26 was observed in VIP plot for moisture content with the highest peak spikes at 973 nm (Figure 6b and Table 1). The corresponding wavelength was related to moisture content due to the strong absorption of infrared radiation by water and the engagement of hydrogen bonds with one or two OH groups within a NIR spectrum between 730 and 2300 nm which in turn will influence the NIR absorption (Yu et al., 2019; Amodio et al., 2017). This noticeable peak was also associated with the stretching of the H–O–H bonds within water molecules and the prominent absorption peak for water was reported to be around 970 nm (Sturm et al., 2020; Kandpal et al., 2013).
3.3 Predictive ability of PLSR model and method comparison based on Passing–Bablok and Deming regressions
The statistical comparison between two methods in analytical chemistry is the most crucial step in method validation and the task is usually completed by employing a regression technique for method comparisons (Mocák et al., 2003). In our study, the results obtained from laboratory methods are considered as a reference method or gold standard and it will be plotted horizontally on the X axis and the predicted results acquired from HSI are plotted on the Y axis (Figure 7). The data set is strictly paired. The equality line is displayed as a dotted gray line with a slope of 1 and an intercept of 0. Statistically, the two methods would have a 100% agreement if all observed points were set on this line with a R2 equal to 1 which is unlikely to happen in a real situation since no measurement methods are perfect (Ludbrook, 2010). The DR (red line) and the PBR (blue line) were evaluated simultaneously. A random scattering patterns around the equality line were observed between measured and predicted values of total carotenoids, moisture content (% wb), L*, a*, and b* which indicates that there is a discrepancy between the methods. However, the values of concordance correlation coefficient (r) from DR are 0.69. 0.89, 0.91, 0.78, and 0.83 for total carotenoids, moisture content (% wb), L*, a*, and b*, respectively, which indicate satisfactory correlations between the two compared methods for moisture content and color but a moderate predictive performance for total carotenoids. This is in accordance with findings of other researchers since it is a great challenge to accurately predict the internal quality of fruits and vegetables using hyperspectral imaging (Lu et al., 2017). However, a good agreement between these two methods was observed at medium concentrations of total carotenoids around 180 μg/g to 260 μg/g with almost an equal scattered distribution from both sides of the equality line (Figure 7a). This is because, at that concentration, most of the carrot slices still contained substantial amounts of moisture (MC >30%) and they were still in a good shape with low levels of shrinkage and minor physical deformation resulting in better light absorption into the materials. It was also testified that the reduction of moisture content in apples during hot air drying caused changes in absorption and scattering properties of the product due to structural modification of the tissue such as changes in size, density, and food matrix (Mozaffari et al., 2016; Udomkun et al., 2014). The results signify that, minimal physical deformation in carrots results in lower light scattering incidence which leads to a good prediction of total carotenoids by using HSI. The same pattern of observation based on DR was also reported by Chen et al. (2013) on insulin detection by two different methods. The authors indicated a good agreement between the two methods was observed at lower concentrations of insulin which implied that the measurements from both methods from the previous study can be in a good agreements to some extend or as in our case of carrots drying, there is a limitation at which the new method of HSI can be reliable at a certain range of total carotenoids concentrations and moisture levels since a good agreement for both methods was observed at higher moisture contents (>30%). Additionally, the simultaneous response and interference from other compounds which occur in parallel with dynamic changes from a combination of multi chemical components in food during drying will influence the reflectance performance resulting in spectral variation and overlapping in the spectral regions, thus leading to complicated spectra (Li et al., 2013). Moreover, heterogeneity of physical and biological properties of agricultural products greatly influences their optical propagation properties and interaction behaviors with incident light, thus reducing the accuracy of quality measurements (Zhang et al., 2018). The same observations of low coefficient of determination at less than 0.20 were also reported on sucrose prediction by HSI in wheat kernels (Delwiche et al., 2013).
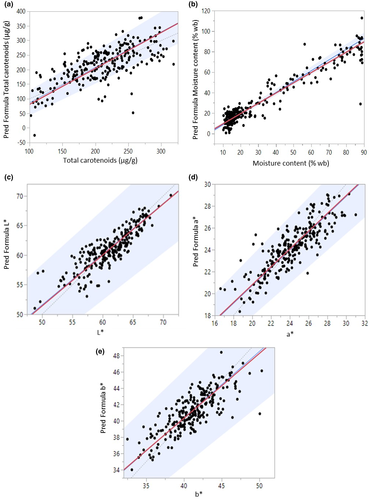
The computed results from both regression methods in this study show the slopes and intercepts of PBR and DR regressions as in Table 3 are not confidently different from 1 and 0 for all quality parameters with orthogonal fit ratios of 1.52, 0.99, 0.81, 0.54, and 0.52 for total carotenoids, moisture content (% wb), L*, a*, and b*, respectively. The observed orthogonal fit ratios which differ from an ideal value of 1 imply that both measuring techniques possess different measurement uncertainties due to analytical errors, seasonal variations, or environmental conditions that could possibly contribute to quality variations for each root and finally influence the measured values (Shrestha et al., 2020; Ludbrook, 2010). A proportional and systematic difference (or BIAS) between the laboratory analysis and the HSI method was not observed in this study since both intercepts and slopes are confidently different from 0 and 1. The above results from both regression techniques indicate an acceptable agreement between the pairs of measurement methods which suggest that in each case both techniques can be potentially applied interchangeably for rapid prediction of total carotenoids, moisture content (% wb), and color parameters of L*, a*, and b* in carrots during drying.
| Variable | Variance fit ratio | r | Slope | Intercept | ||
|---|---|---|---|---|---|---|
| DR | PBR | DR | PBR | |||
| Total carotenoids | 1.52 | 0.69 | 1.23 | 1.22 | -42.33 | -35.06 |
| Moisture content (%wb) | 0.99 | 0.89 | 0.99 | 1.04 | 1.24 | -0.57 |
| L* | 0.81 | 0.91 | 0.90 | 0.85 | 5.95 | 9.35 |
| a* | 0.54 | 0.78 | 0.73 | 0.73 | 6.63 | 6.63 |
| b* | 0.52 | 0.83 | 0.72 | 0.74 | 11.89 | 11.35 |
- Abbreviations: DR, Deming regression; PBR, Passing-Bablok regression; r, coefficient of correlation.
3.4 Bland–Altman plot analysis for verifying the limit of agreement between two methods
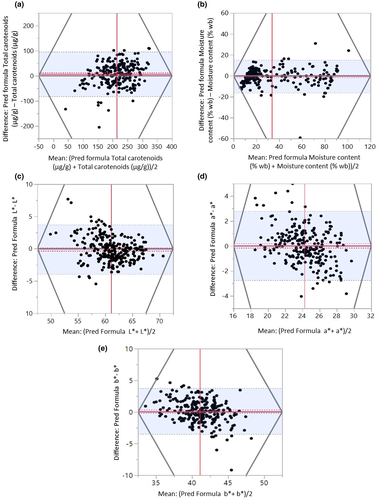
The Bland–Altman plot as in Figure 8 was analyzed based on the differences and agreement between the predicted values (by PLSR) and measured values (laboratory method) for total carotenoids, moisture content (% wb), L*, a*, and b* against the mean of both methods. The outcomes from the plot show an acceptable agreement between the compared methods with a relatively small mean of difference of 6.67 and a standard error of 2.94 with a satisfactory correlation of “r” equal to 0.69 for total carotenoids (Figure 8 and Table 4). A few outliers were detected in the plot which indicates samples heterogeneities due to biological, seasonal, and environmental variations that could influence the initial concentration of total carotenoids since it was observed that the amount of total carotenoids in this experiment varied for each individual root. The measurement errors and physical distortion of each individual slices could also contribute to spectral variation and finally lead to extreme measurement values and predictions. The BA plot for total carotenoids displays equally distributed points between the limits of agreements at 95% CI which is expanding from 95.68 μg/g to 82.34 μg/g demonstrating a satisfactory agreement within an acceptable level between non-destructive technique and laboratory analysis (Sedgwick, 2013). In other words, we can say that 95% of the plotted data points would have a measurement difference within the limits of agreement in the range between 95.68 and 82.34 interval. The wide interval in this study implies that large differences in measurements due to a wide range of total carotenoids retention were observed throughout the drying period. The mean differences for moisture content, color parameters of L*, a*, and b* are 1.12, −0.21, 0.36, and 0.71, respectively, indicate that both applied methods are evidently comparable and acceptable as the mean difference is approaching toward zero, and the standard deviation of the variations between measurements does not exhibit any systematic variance with the mean of the measurement pairs. Low values of standard deviations at 1.96, 1.41, and 1.85 were observed for the color parameters of L*, a*, and b* which demonstrate an appropriate agreement between both measurement methods. However, a higher standard deviation for total carotenoids at 45.41 µg/g was obtained in this study due to a broad range of total carotenoids concentration across the data sets implying varying degrees of total carotenoids decomposition when subjected to heat treatment. Previous research which was reported by Rungpichayapichet et al. (2015) also showed similar patterns with higher standard deviation at 36.71 of predicted β-carotene by PLSR model in mango during ripening by employing a non-invasive technique of near-infrared spectroscopy at 700–1100 nm. Nevertheless, an acceptable agreement was achieved for total carotenoids in this study with just 10 outliers from 239 data sets between non-invasive technique and Gold Standard method, implying that only 4.14% of the total carotenoid values surpassed 95% of the acceptability limits. The result obtained complies with the statistical agreement since it is recommended that 95% of the data points should lie within the limits of agreement at ±1.96 SD of the mean difference (Earthman, 2015; Sedgwick, 2013). The findings demonstrate the possibility of using non-destructive technique for total carotenoids measurement during drying. For moisture content, a good level of agreement was also observed at a minimal value of standard deviation at 7.96 with only seven outlier points, indicating only 2.93% of the differences in measured values fell outside the 95% acceptability limits. Both findings are within an agreeable statistical limit as described by Bland and Altman (1999). The results also show minor values of standard error at 1.92, 0.25, 0.36, and 0.30 for moisture content, L*, a*, and b* (Table 4). Therefore, the new HSI technique can be performed interchangeably for non-destructive quality inspection in carrots with an acceptable accuracy as compared with a conventional laboratory method. In view of this, we can suggest that there is a great potential for adopting the application of HSI for non-invasive assessment of moisture content and color in carrots, despite the fact that both methods could possibly possess their own errors in various ways and the errors could be linked to sampling, sample preparation, and instrumental noise. The errors within laboratory methods can possibly occur at various stages of sample preparation prior to physical and chemical analysis. All these errors will contribute to a significant variation in the measurements (Amodio et al., 2017).
| Variable | Upper limit | Lower limit | Mean difference | Standard deviation | Standard error | r |
|---|---|---|---|---|---|---|
| Total carotenoids | 95.68 | -82.34 | 6.67 | 45.41 | 2.94 | 0.69 |
| Moisture content (% wb) | 25.18 | 22.93 | 1.12 | 7.96 | 1.92 | 0.89 |
| L* | 2.88 | -3.30 | -0.21 | 1.96 | 0.25 | 0.91 |
| a* | 4.15 | -3.43 | 0.36 | 1.41 | 0.36 | 0.78 |
| b* | 4.53 | -3.11 | 0.71 | 1.85 | 0.30 | 0.83 |
- Abbreviation: r, coefficient of correlation.
3.5 Visualization of moisture content at different drying periods
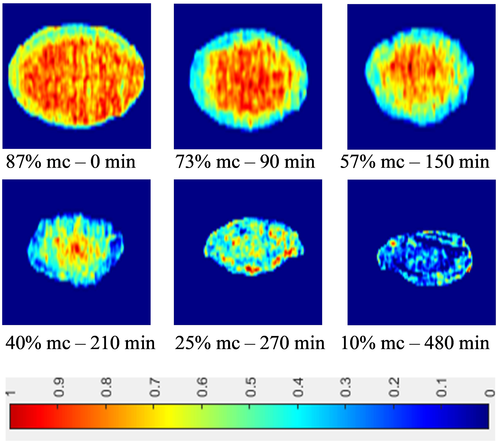
Figure 9 shows a mapping of moisture content in carrots at different stages of the drying process at 60°C. The images for samples drying at 60°C were selected due to the best quality retention which is based on our previous study (Md Saleh et al., 2019). The displayed images from Figure 9 demonstrate higher moisture distribution was observed at the center of the carrot slice at the early stage of drying between 90 and 150 min and lower moisture content at the edge of the slices at all stages of drying indicating a higher moisture removal rate at the edge of the surface area. The images also show a significant size reduction as the drying proceed due to water removal during drying and finally leading to physical deformation such as volume shrinkage (Pu & Sun, 2015). Therefore, a bias during measurements occurred due to physical disfiguration of the carrot slice leading to inaccurate mapping predictions. This error was unavoidable and for that reason, higher moisture regions were observed at some spots on the edge of the slice toward the final stage of the drying process. Additionally, Zhang et al. (2018) reported that, the curved surface, shape, size, and color of fruits and vegetables influenced the reflectance components. Furthermore, the authors also mentioned that the curved surface will cause nonuniform reflectance leading to uneven light distribution; especially the zone near to the border resulting in misinterpretation or it can be incorrectly identified as defects. Consequently, the irregular surfaces would promote spectral variability and enhance the complexity of the calibration model and finally reduce the prediction accuracy and practicability of the model. In general, despite of inevitable challenges of variability in physical distortion of each individual slice of carrots, visualization of moisture distribution using HSI during drying is useful for evaluating the performance of the drying process when subjected to different drying conditions. This advanced technique enables a good prediction of the moisture evolution throughout the whole process, which can be a reliable indicator for determining the optimum drying time on when to stop the drying process and it can be helpful for dynamic optimization of the drying process with regards to product quality and safety.
4 CONCLUSIONS
Hyperspectral imaging combined with chemometrics demonstrates to be a promising technological tool for non-destructive quality measurements during the drying of carrots. An excellent prediction of moisture content in this study indicates the potential usage of this technique for online and real-time quality assessment. This technique also provides the satisfactory prediction of total carotenoids and the color parameters of L* and a*. Satisfactory results for intercepts and slopes in Passing–Bablok and Deming regressions were obtained with both values approaching 0 and 1 indicating a good statistical agreement between the compared method pairs. The results were confirmed by the Blant–Altman analysis with more than 95% of the measured values were within the 95% CI of the statistical limits for all quality attributes. The findings demonstrate a possibility to apply non-destructive quality measurement using hyperspectral imaging of carrots during drying. This new and innovative method has a great potential to substitute a standard laboratory method in the future. However, it is still a challenging task to accurately quantify total carotenoids in carrots by means of hyperspectral imaging due to the inherent chemical and physical complexities of carrots as well as constant physical changes throughout the drying process that could influence the spectral reflectance and consequently lead to inconsistent predictive values of the actual retention of total carotenoids in carrots. The application of hyperspectral imaging for noncontact and quantification of total carotenoids could provide us with meaningful information on nutrient degradation at any drying point and rough estimation of nutrient retention based on the changes in spectral reflectance throughout the drying process. Based on this information, adequate drying strategies based on product quality aspects, for example, the inflection point of nutrients degradation, can be performed for effective process control. This study also provides preliminary information toward designing and integrating a non-invasive measurements technique into the drying systems for the development of smart dryers so that, a continuous and online monitoring of quality attributes can be realized and implemented in the future.
5 FUTURE RECOMMENDATIONS
The above study demonstrates the importance of acquiring an in-depth knowledge of optical properties of food crops and their interaction with light as well as the propagation mechanisms of light in the food tissue must be well understood because it can provide relevant information and significant inputs in designing an effective optical system for online and non-invasive quality measurement to control the drying process. Comprehensive studies on the influence of food microstructure on dynamic changes of quality attributes throughout the drying process must be carried out since all these factors contribute to the spectral pattern and prediction accuracy of the resulting outputs from the hyperspectral imaging systems. Multidisciplinary research areas must be scientifically integrated to overcome existing challenges in the understanding of physical, chemical, and biological variability of fruits and vegetables that could cause significant spectral fluctuations and consequently affect the prediction accuracy especially when dealing with samples at different exposure times throughout the processing period such as drying operations. More robust, simple, and reliable algorithms with a universal and practicable calibration models need to be developed which are independent of origins, cultivars, cultivation practices, seasons, and maturity to improve the predictability of future samples.
ACKNOWLEDGMENTS
The authors gratefully acknowledge the Universität Kassel and Malaysian Agricultural Research & Development Institute (MARDI) for the scientific supervision, PhD scholarship, and financial support. The study is also a part of a research program under the SusOrgPlus project within the framework of the Coordination of European Transnational Research in Organic Food and Farming Systems Cofund Programme and is supported by funds of the Federal Ministry of Food and Agriculture (BMEL) based on a decision of the Parliament of the Federal Republic of Germany via the Federal Office for Agriculture and Food (BLE) under the innovation support program (Project number: BLE – 2817OE005). The work was furthermore supported by the German Research Foundation (DFG-Deutsche Forschungsgemeinschaft) by providing the research funding through the RealTimeFood project (Project number: 420778578). The authors acknowledge the Department of Organic Food Quality and Food Culture, particularly Ms. Gaby Mergardt for the technical support and provision to access the laboratory and equipment prior to chemical analysis.
AUTHOR CONTRIBUTIONS
Rosalizan Md Saleh: Conceptualization; data curation; formal analysis; investigation; methodology; writing – original draft; writing – review and editing. Boris Kulig: Formal analysis; methodology; software; validation. Arman Arefi: Data curation; software; validation; writing – review and editing. Oliver Hensel: Funding acquisition; project administration; resources; supervision. Barbara Sturm: Conceptualization; methodology; resources; supervision; writing – review and editing.
Open Research
DATA AVAILABILITY STATEMENT
Research data are not shared.


