Farnesylthiosalicylic Acid Through Inhibition of Galectin-3 Improves Neuroinflammation in Alzheimer Disease via Multiple Pathways
Funding: This study was supported by the National Natural Science Foundation of China (81901098) and Science and Technology Project of Longyan City (2022LYF17085).
Qing Qiu and Cui li contributed equally to this work as the first authors.
ABSTRACT
Aims
Many factors affect the neuroinflammatory response in patients with Alzheimer disease (AD). Galectin-3 (Gal-3) is closely related to microglial activation in the nervous system and can promote the aggregation of cancer cells in tumors. This study aimed to investigate the mechanism by which farnesylthiosalicylic acid (FTS) affects neuroinflammation in Aβ1–42 mice through Gal-3.
Methods
We used the Morris water maze, reverse transcription–polymerase chain reaction (RT–PCR), Western blotting, enzyme-linked immunosorbent assay (ELISA), and immunofluorescence to conduct our study.
Results
FTS reduced the levels of proinflammatory factors and microglial activation in Aβ1–42 mice. FTS inhibited total and membrane expression levels of Gal-3 in Aβ1–42 mice, and the anti-inflammatory effect of FTS was reversed by Gal-3–adeno-associated viral (AAV). FTS reduced the expression levels of toll-like receptors (TLRs), effects that were reversed by Gal-3-AAV. Moreover, FTS ameliorated Aβ oligomerization and accumulation in Aβ1–42 mice, effects that were also reversed by Gal-3-AAV. FTS, through the inhibition of the Gal-3–c-Jun N-terminal kinase (JNK) pathway, reduced PS1 expression; in addition, inhibition of Gal-3 increased the Aβ-degrading enzymes in Aβ1–42 mice. FTS-induced improvements in cognition in Aβ1–42 mice were reversed by Gal-3-AAV.
Conclusion
FTS may through inhibiting Gal-3 reduce the expression of TLR4 and CD14 and alleviate Aβ pathology, downregulating Aβ-stimulated TLR2, TLR4, and CD14 expression, and thus alleviate neuroinflammation in Aβ1–42 mice.
1 Introduction
Alzheimer disease (AD) is a common neurodegenerative disease characterized by memory loss and progressive neurocognitive dysfunction. The immune inflammatory response also plays an important role in the development and progression of AD [1, 2].
Neuroinflammation is a complex innate immune response [2, 3] produced in the central nervous system (CNS) in the face of various harmful stimuli (such as trauma or infection). Microglia are the main source of proinflammatory molecules in the brain [4]. Sustained release of proinflammatory molecules from microglia such as cytokines, chemokines, reactive nitrogen species, or reactive oxygen species can create a neurotoxic environment, driving the progression of AD [5, 6], and inflammatory molecules may further facilitate the production and aggregation of Αβ in the brain [7]. β-Amyloid (Aβ), one of the typical pathological features of AD, is widely recognized as a key inducer of microglial activation and neuroinflammation in AD. Aβ aggregation (such as oligomeric, profibrotic, and filamentous fibril formation) and accumulation can activate microglia and promote the production of inflammatory molecules in the brain, eventually leading to AD-associated neuroinflammation [8].
The galectin-3 (Gal-3) content is increased in the brain, cerebrospinal fluid, and plasma of patients with AD [9]. Gal-3 is a member of the galectin protein family and is characterized by a single C-terminal carbohydrate recognition domain for carbohydrate binding and an N-terminal aggregating domain that interacts with a noncarbohydrate ligand and allows the formation of oligomers [10]. In tumors, Gal-3 reportedly enhances cancer cell aggregation [11, 12]. Gal-3 is expressed mainly in the cytoplasm due to the lack of a leader sequence [13] and can also be found in the nucleus and cell membrane [14]. Moreover, Gal-3 can be released into the extracellular space upon certain stimuli, such as lipopolysaccharide (LPS) [15] and interferon γ (IFN-γ) [16]. Gal-3 is involved in the inflammatory response, and its expression increases in microglia upon exposure to various neuroinflammatory stimuli (e.g., in the case of ischemic injury) [17-19]. Toll-like receptors (TLRs) are important components of the innate immune response and have been reported to participate in the Αβ-associated inflammatory response [20, 21]. As an endogenous paracrine TLR4 ligand, Gal-3 can bind to microglial TLR4, triggering the proinflammatory response under acute neuroinflammatory conditions.
S-trans, trans-farnesylthiosalicylic acid (FTS; salirasib) is a synthetic small molecule that acts as a potent Ras inhibitor. FTS dislodges all types of oncogenic Ras proteins from their membrane anchorage sites and inhibits Ras transformation both in vitro and in vivo [22, 23]. In cells, Gal-3 serves as a scaffold for the K-Ras protein [24]. In anaplastic thyroid carcinoma (ARO) cancer cells, FTS decreases K-Ras, K-Ras-GTP, and Gal-3 expression levels [25], and FTS disrupts the colonization of the cell membrane by Gal-3 and Ras. After FTS treatment, Ras is mislocalized in the cytoplasm from the cell membrane. As an inhibitor of Ras activation, in the CNS, FTS has been reported to upregulate NMDA-dependent long-term potentiation induction and cognitive function [26], as well as neurogenesis [27], in AD mice.
This study aimed to investigate whether FTS can improve the neuroinflammatory response in AD model mice by inhibiting Gal-3 and the possible molecular mechanisms involved to further clarify the neuroprotective effect of FTS in AD treatment.
2 Methods
2.1 Experimental Animals
This study was approved by the Experimental Animal Care and Ethical Committee of Nantong University (Approval Number: P20230221-003). The procedures involving animals and their care were conducted in accordance with the ARRIVE Guidelines of Laboratory Animal Care. Male C57BL/6J mice aged 2 months (SLAC Laboratory Animal Co. Ltd. Shanghai, China) were housed in a constant environment (23°C ± 2°C; 55% ± 5% humidity; 12:12 h light/dark cycle) at the Animal Centre of Nantong University. The animals were given ad libitum access to food and water.
2.2 Drug Administration
FTS (Cayman Chemical, Ann Arbor, MI, USA) as administered by intraperitoneal (i.p.) injection at 3 mg/kg [27] starting at 4 h after Aβ1–42 injection for 14 days because FTS at this dose is effective and can enter the brain within 20–30 min [28]. The control mice were intraperitoneally injected with an equal volume of vehicle.
The synthetic lipoproteins FSL-1 (100 ng/mL) and LPS (1 μg/mL) (both from InvivoGen, USA) were used as TLR2 agonists and CD14/TLR4 agonists, respectively [29].
Anisomycin (a c-Jun N-terminal kinase [JNK] activator) was purchased from MCE and dissolved in HCl (1 M), and the anisomycin solution was diluted with normal saline to 22 μg/μL; the pH was then adjusted to 7.4 with NaOH (5 M). For repeated intracerebroventricular (i.c.v.) injection of anisomycin (110 μg/5 μL/mouse) [30-32], a 28-G stainless-steel guide cannula (Plastic One, Roanoke, VA, USA) was implanted into the right cerebral ventricle and fixed on the skull [33]. Anisomycin was administered once daily for 14 consecutive days 30 min before FTS administration. The mice in the control group were injected with the same volume of vehicle (0.5% DMSO).
2.3 Establishment of the AD Model
The aggregation of Aβ1–42 in the hippocampus has been confirmed by immunostaining with an Aβ-specific antibody [34]. Aβ1–42 i.c.v. injection has been shown to trigger memory impairment, synaptic disorders, tau protein hyperphosphorylation, and neurodegeneration in the mouse hippocampus [2, 35-37]. Aβ1–42 was dissolved in 1,1,1,3,3,3-hexafluoro-2-propanol (HFIP; Sigma Aldrich), flash-frozen in liquid nitrogen, and then lyophilized to completely remove the solvent. The lyophilized Aβ1–42 peptides were then dissolved in 100 mM NaOH at 6 mg/mL, aliquoted, flash-frozen in liquid nitrogen, and stored at −80°C until use.
For i.c.v. injection of soluble Aβ1–42, the mice were intraperitoneally anesthetized with isoflurane and then placed in a stereotactic apparatus (Motorized Stereotaxic Stereo Drive; Neurostar). Freshly prepared Aβ1–42 (0.3 nmol/2 μL in 0.1 M phosphate-buffered saline [PBS]) was injected into bilateral cerebral ventricles (0.3 mm posterior, 1.0 mm lateral, and 2.5 mm ventral to the bregma) using a stepper-motorized microsyringe at 0.2 μL/min. In the control group, the same volume of vehicle was injected into the cerebral ventricles.
2.4 Morris Water Maze (MWM) Test
The MWM test was conducted for 8 consecutive days as previously reported by our group [38, 39], and the spatial cognition of the mice was assessed. The specific experimental procedures are described in Data S1.
2.5 Western Blotting
The animals were anesthetized and the brains were harvested, followed by separation of the hippocampus. Generation of hippocampal tissue or brain slice homogenates and protein extraction and protein imprinting experiments are described in Data S1. In this study, the primary antibodies used included mouse anti-Aβ (6E10) (1:1000; BioLegend, Cat# 803014), anti-Flag (Sigma, Cat# F1804), Gal-3 (1:1000; Cat# AF1197, Bio-techne), PS1 (1:1000; Cat# ab76083, Abcam), IDE (1:1000; Cat# ab133561, Abcam), NEP (1:1000; Cat# sc-46,656, Santa Cruz), TTR (1:1000; Cat# sc-377,517, Santa Cruz), anti-phospho-JNK (1:1000; Cat# SAB4504450, Sigma–Aldrich), and anti-JNK (1:1000; Cat# 559304, Sigma–Aldrich). GAPDH (1:2000; Cell Signaling Technology, Cat# 5174) or β-actin (1:2000; Cell Signaling Technology, Cat# 3700) antibodies served as internal controls. An appropriate horseradish peroxidase (HRP)-conjugated secondary antibody was used for detection by enhanced chemiluminescence (Pierce).
2.6 Tissue Fixation and Immunofluorescence Staining
The methods used for tissue fixation and immunofluorescence staining of Iba-1 and Aβ plaques are described in Data S1. The primary antibodies used included the following: anti-Aβ (D-11) (1:500, Cat# sc-374,527, Santa Cruz), anti-NeuN (1:500, Cat# ab177487, Abcam), and Iba-1 (1:500, Cat# 019–19,741, FUJIFILM Wako). After rinsing with PBS, the sections were incubated with subtype-specific fluorescent secondary Cy3 anti-rabbit (Cat# 711–165-152, Jackson ImmunoResearch) or AlexaFluor-647 anti-mouse (1:250, Cat# ab150107, Abcam) antibodies for 2 h at room temperature. Signal was undetectable in the control sections, which were incubated with solutions without primary antibodies.
2.7 Enzyme-Linked Immunosorbent Assay (ELISA)
The levels of released interleukin-1β (IL-1β), IL-6, tumor necrosis factor-α (TNF-α), nitric oxide (NO), and Gal-3 were detected by ELISA, and the specific experimental procedures are described in the Data S1.
2.8 Virus Injections
To produce the adeno-associated viral (AAV) vectors, the coding region of Gal-3 was amplified from cDNA of C57BL/6J mice by PCR, and standard cloning procedures were used to subclone the enhanced green fluorescent protein (EGFP) cassettes into the backbone of AAV under a cytomegalovirus (CMV) promoter (AAV-CMV-MCS-3FLAG) expression plasmid. Following DNA sequencing screening, the AAV plasmids were packaged into the AAV serotype 9 virus from GeneChem CO. Ltd. (Shanghai, China), with the titer at 1 × 10¹³ virus particles per mL.
The mice were anesthetized with isoflurane and then placed in a stereotactic apparatus. The AAV-CMV-Gal-3-EGFP (Gal-3-AAV) or AAV-CMV-EGFP control (Con-AAV) virus were bilaterally injected into the hippocampus 2.0 mm behind the bregma and ± 1.5 mm lateral from the sagittal midline at 2 mm below the skull surface. The virus was delivered with a 10-μL Hamilton syringe (1 μL per site) at 0.05 μL/min. The needle remained in the brain for an additional 10 min to prevent backflow of the virus suspension. The wound was closed, and the mice were allowed to recover for 3 days.
Green GFP fluorescence was detected to confirm the infection position, and the overexpression of target protein was confirmed by Western blotting of FLAG expression.
2.9 Reverse Transcription–Polymerase Chain Reaction (RT–PCR)
The specific experimental procedures are described in Data S1.
2.10 Statistical Analyses
All the statistical analyses were performed with GraphPad Prism 8. Data are presented as the mean ± standard error (S.E.M.) unless otherwise indicated. Different analyses of variance (ANOVAs) were used for comparisons of data among groups, followed by post hoc tests. A value of p < 0.05 was considered statistically significant.
3 Results
3.1 FTS Reduces Proinflammatory Factor Expression and Microglial Activation in Aβ1–42 Mice
To test the dose-dependent effects of FTS on inflammation in Aβ1–42 mice, FTS (1, 3, and 10 mg/kg) was administered once daily beginning at 4 h after Aβ1–42 injection for 14 consecutive days (Figure S1). Based on the results of this pilot experiment, we used 3 mg/kg FTS for subsequent experiments.
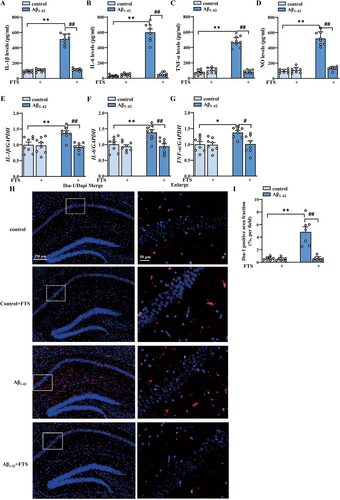
As shown in Figure 1A–D, the contents of proinflammatory factors in the hippocampus were highly increased in Aβ1–42 mice, as detected by ELISA (IL-1β: F (1, 28) = 275.3, p < 0.0001; IL-6: F (1, 28) = 167.6, p < 0.0001; TNF-α: F (1, 28) = 175.3, p < 0.0001; NO: F (1, 28) = 156.2, p < 0.0001; Aβ1–42 vs. control: all p < 0.0001, n = 8 mice per group, two-way ANOVA, followed by Sidak's test), effects that were significantly reversed by FTS treatment (IL-1β: F (1, 28) = 214.8, p < 0.0001; IL-6: F (1, 28) = 140.2, p < 0.0001; TNF-α: F (1, 28) = 158.8, p < 0.0001; NO: F (1, 28) = 111.0, p < 0.0001; Aβ1–42 vs. Aβ1–42 + FTS: all p < 0.0001). FTS had no effect on the contents of proinflammatory factors in the control mice (IL-1β: p = 0.9703, IL-6: p = 0.9933, TNF-α: p = 0.7928, NO: p = 0.997; Figure 1A–D). The mRNA expression levels of IL-1β, IL-6, and TNF-α also increased in Aβ1–42 mice (IL-1β: F (1, 28) = 5.095, p = 0.032; Aβ1–42 vs. control: p = 0.007; IL-6: F (1, 28) = 6.372, p = 0.0175; Aβ1–42 vs. control: p = 0.0089; TNF-α: F (1, 28) = 6.062, p = 0.0202; Aβ1–42 vs. control: p = 0.0167, n = 8 mice per group; two-way ANOVA, followed by Sidak's test), effects that were reduced by FTS treatment (IL-1β: F (1, 28) = 9.830, p = 0.004, Aβ1–42 vs. Aβ1–42+ FTS: p = 0.0013; IL-6: F (1, 28) = 11.11, p = 0.0024, Aβ1–42 vs. Aβ1–42 + FTS: p = 0.0020; TNF-α: F (1, 28) = 5.594, p = 0.0252, Aβ1–42 vs. Aβ1–42 + FTS: p = 0.0198; Figure 1E–G). Gliosis is one of the characteristic pathological events in AD [40]. In this study, the activation of microglia by Iba-1 (a biomarker of microglia, Figure 1H) was examined. Compared with those in control mice, the Iba-1-positive areas in Aβ1–42 mice were significantly greater (F (1, 28) = 16.67, p = 0.0003; Aβ1–42 vs. control: p < 0.0001; n = 8 mice per group; two-way ANOVA followed by Sidak's test), effects that were reduced by FTS treatment (F (1, 28) = 17.24, p = 0.0003, Aβ1–42 vs. Aβ1–42 + FTS: p < 0.0001; Figure 1I). These results indicate that FTS inhibits the overactivation of microglia in Aβ1–42 mice.
3.2 Gal-3 Expression Increases in Aβ1–42 Mice but is Inhibited by FTS
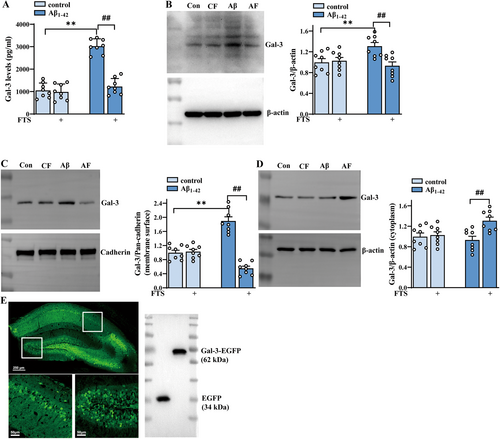
To explore whether the increases in inflammatory factor levels and microglial activation in Aβ1–42 mice were related to the increased release of Gal-3, the content of endogenous Gal-3 was detected by ELISA. The results revealed that the hippocampal Gal-3 content significantly increased in Aβ1–42 mice (F (1, 28) = 83.55, p < 0.0001; Aβ1–42 vs. control: p < 0.0001; n = 8 mice per group; two-way ANOVA, followed by Sidak's test), which was reversed by FTS treatment (F (1, 28) = 59.23, p < 0.0001, Aβ1–42 vs. Aβ1–42 + FTS: p < 0.0001; Figure 2A). The results also revealed that both total and membrane levels of Gal-3 increased in Aβ1–42 mice (total: F (1, 28) = 5.290, p = 0.0291, Aβ1–42 vs. control: p = 0.0013, Figure 2B; membrane: F (1, 28) = 5.545, p = 0.0258, Aβ1–42 vs. control: p < 0.0001, Figure 2C; n = 8 mice per group, two-way ANOVA, followed by Sidak's test), effects that were reduced by FTS treatment (total: F (1, 28) = 10.62, p = 0.0029, Aβ1–42 vs. Aβ1–42 + FTS: p = 0.0002, Figure 2B; membrane: F (1, 28) = 70.14, p < 0.0001, Aβ1–42 vs. Aβ1–42 + FTS: p < 0.0001; Figure 2C). Notably, the membrane level of Gal-3 in the FTS-treated Aβ1–42 mice was markedly lower than that in the control mice (p = 0.0011). However, the cytoplasmic level of Gal-3 remained unchanged in Aβ1–42 mice (F (1, 28) =2.370, p = 0.1349, Aβ1–42 vs. control: p = 0.9103, n = 8 mice per group; two-way ANOVA followed by Sidak's test), but it increased significantly after FTS treatment (F (1, 28) = 8.450, p = 0.0071, Aβ1–42 vs. Aβ1–42 + FTS: p = 0.0037; Figure 2D). To investigate whether the effect of FTS on inflammatory molecules in Aβ1–42 mice was related to Gal-3, Gal-3-AAV was constructed to induce Gal-3 overexpression in mice. As shown in Figure 2E, Gal-3-AAV effectively infected the hippocampus and produced considerable FLAG expression (Figure 2E, right). Overall, we speculated that for Aβ1–42 mice, FTS might reduce membrane expression but enhance the cytoplasmic expression of Gal-3, leading to its degradation and subsequent downregulation of total expression.
3.3 The Anti-Inflammatory Effect of FTS is Dependent on Gal-3 and is Related to TLRs
As shown by the ELISA results in Figure 3, the reduced contents of IL-1β, IL-6, TNF-α, and NO induced by FTS treatment in Aβ1–42 mice were reversed in the presence of Gal-3 overexpression (IL-1β: F (1, 28) = 72.50, p < 0.0001; IL-6: F (1, 28) = 18.02, p = 0.0002; TNF-α: F (1, 28) = 21.87, p < 0.0001; NO: F (1, 28) = 24.95, p < 0.0001; Aβ1–42 + FTS vs. Aβ1–42 + FTS + Gal-3-AAV: all p < 0.0001; n = 8 mice per group, two-way ANOVA, followed by Sidak's test; Figure 3A–D), which indicates the key role of Gal-3 in the FTS-induced inhibition of inflammation in Aβ1–42 mice.
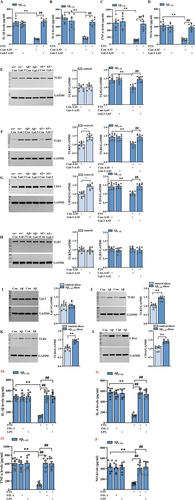
In mammals, there are at least 10 TLRs, and some employ additional coreceptors that assist in pathogen recognition, such as CD14 for TLR4 [41]. In human AD brains, both TLR2- and CD14-positive microglia are associated with Aβ plaques [42]. Higher TLR4 mRNA expression was reported in the TgCRND8 mouse model of AD [43]. TLR3 is expressed mainly in the brain and can participate in the regulation of the immune response, nerve regeneration, and neuronal plasticity [44]. We found that FTS treatment could significantly reduce the expression levels of TLR2, TLR4, and CD14 in Aβ1–42 mice (TLR2: F (1, 28) = 10.75, p = 0.0028, Aβ1–42 vs. Aβ1–42 + FTS: p = 0.0002, Figure 3E; TLR4: F (1, 28) = 11.34, p = 0.0022, Aβ1–42 vs. Aβ1–42 + FTS: p < 0.0001, Figure 3F; CD14: F (1, 28) = 13.37, p = 0.0010, Aβ1–42 vs. control: p = 0.0001, n = 8 mice per group, two-way ANOVA, followed by Sidak's test; Figure 3G), and these effects of FTS were reversed by Gal-3 overexpression (TLR2: F (1, 28) = 17.25, p = 0.0003, Aβ1–42 + FTS vs. Aβ1–42 + FTS + Gal-3-AAV: p < 0.0001; TLR4: F (1, 28) = 9.636 p = 0.0043, Aβ1–42 + FTS vs. Aβ1–42 + FTS + Gal-3-AAV: p = 0.0002; CD14: F (1, 28) = 16.12, p = 0.0004, Aβ1–42 + FTS vs. Aβ1–42 + FTS + Gal-3-AAV: p < 0.0001). In contrast, the expression levels of TLR4 and CD14 (TLR4: t = 5.164, df = 14, p = 0.0001; Figure 3F; CD14: t = 5.657, df = 14, p < 0.0001; unpaired Student's t test; Figure 3G), but not that of TLR2 (TLR2: t = 0.5264, df = 14, p = 0.6068; unpaired Student's t test; Figure 3E), were upregulated in Gal-3-AAV-infected control mice. TLR3 expression was not influenced by FTS in Aβ1–42 mice (F (1, 28) = 0.00058, p = 0.9808, n = 8 mice per group; two-way ANOVA followed by Sidak's test; Figure 3H) or by Gal-3 overexpression in control mice (TLR2: t = 0.5731, df = 14, p = 0.5757; unpaired Student's t test; Figure 3H). These results indicate that FTS could reduce the increased levels of TLR2, TLR4, and CD14 through the inhibition of Gal-3 in Aβ1–42 mice. On the one hand, Gal-3 could regulate TLR4 and CD14 expression; on the other hand, considering the effect of Aβ on TLRs, we speculated that Gal-3 could regulate TLRs by affecting Aβ pathologies. Therefore, we examined the levels of TLRs in Aβ-incubated hippocampal slices. We found that after Aβ incubation for 4 h, the expression of Gal-3 did not change (t = 0.3003, df = 14, p = 0.7684, unpaired Student's t test; Figure 3I); in contrast, the levels of TLR2, TLR4, and CD14 did increase (TLR2: t = 6.372, df = 14, p < 0.0001; TLR4: t = 6.747, df = 14, p < 0.0001; CD14: t = 6.205, df = 14, p < 0.0001, unpaired Student's t test; Figure 3J–L). Therefore, in Aβ1–42 mice, FTS could reduce the expression levels of TLR4 and CD14 through the inhibition of Gal-3; meanwhile, FTS could downregulate TLR2, TLR4, and CD14 through affecting Aβ pathologies, effects that were also dependent on Gal-3.
Moreover, the reduced contents of IL-1β, IL-6, TNF-α, and NO in Aβ1–42 mice were reversed by the application of the TLR2 agonist FSL-1 and the CD14/TLR4 agonist LPS (IL-1β: F (2, 42) = 34.60, p < 0.0001, Aβ1–42 + FTS vs. Aβ1–42 + FTS + FSL-1: p < 0.0001; Aβ1–42 + FTS vs. Aβ1–42 + FTS + LPS: p < 0.0001; IL-6: F (2, 42) = 46.29, p < 0.0001, Aβ1–42 + FTS vs. Aβ1–42 + FTS + FSL-1: p < 0.0001; Aβ1–42 + FTS vs. Aβ1–42 + FTS + LPS: p < 0.0001; TNF-α: F (2, 42) = 23.03, p < 0.0001, Aβ1–42 + FTS vs. Aβ1–42 + FTS + FSL-1: p < 0.0001; Aβ1–42 + FTS vs. Aβ1–42 + FTS + LPS: p < 0.0001; NO: F (2, 42) = 14.46, p < 0.0001, Aβ1–42 + FTS vs. Aβ1–42 + FTS + FSL-1: p < 0.0001; Aβ1–42 + FTS vs. Aβ1–42 + FTS + LPS: p < 0.0001; n = 8 mice per group, two-way ANOVA, followed by Tukey's test; Figure 3M–P), which indicated that FTS regulated inflammatory markers in Aβ1–42 mice by affecting TLR2 and CD14/TLR4.
3.4 Aβ Injection-Induced Aβ Oligomerization and Accumulation are Ameliorated by FTS, Which is Reversed by Gal-3 Overexpression
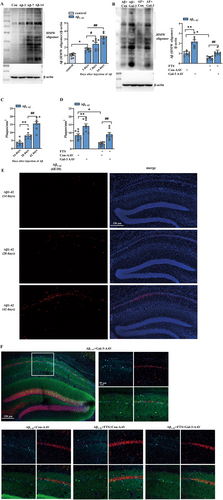
The inhibition of Aβ aggregation has been proposed as a therapeutic strategy to alleviate the progression of AD pathology [45]. Aβ monomers form soluble oligomers with different molecular weights, and Aβ oligomers (AβOs) further aggregate to generate insoluble Aβ fibrils and amyloid plaques [46, 47]. The results revealed that the amount of high-molecular-weight (HMW) AβOs (> 23 kDa) increased in Aβ1–42 mice in a time-dependent manner at 3, 7, and 14 days postinjection (F (3, 28) = 37.78, p < 0.0001; n = 8 mice per group; one-way ANOVA followed by Tukey's test; Figure 4A). Aβ oligomerization was greater at 3 days in Aβ1–42 mice than in control mice treated with NS (p = 0.0174), and the number of oligomers further increased at 7 (p = 0.0150) and 14 days (p < 0.0001) compared with that at 3 days. Compared with Aβ1–42 mice, Aβ1–42 mice treated with Gal-3-AAV presented significantly more oligomers, and FTS treatment reduced the number of oligomers in Aβ1–42 mice (F (1, 28) = 47.17, p < 0.0001, Aβ1–42 vs. Aβ1–42 + FTS: p = 0.0342, n = 8 mice per group, two-way ANOVA, followed by Sidak's test). Interestingly, Gal-3-AAV overexpression increased the number of oligomers in both Aβ1–42 mice and Aβ1–42 + FTS mice (F (1, 28) = 53.42, p < 0.0001; Aβ1–42 vs. Aβ1–42 + Gal-3-AAV: p < 0.0001; Aβ1–42 + FTS vs. Aβ1–42 + FTS + Gal-3-AAV: p < 0.0001; Figure 4B). Aβ1–42 accumulation was subsequently assessed by immunofluorescence staining. As shown in Figure 4C,E, Aβ plaques began to appear at 28 days and further increased at 42 days (F (2, 21) = 39.85, p < 0.0001; 14 days vs. 28 days: p = 0.0104; 28 days vs. 42 days: p < 0.0001; n = 8 mice per group; one-way ANOVA, followed by Tukey's test; Figure 4C). Additionally, FTS treatment decreased the number of Aβ plaques in Aβ1–42 mice (F (1, 28) = 47.17, p < 0.0001, p = 0.0342; Figure 4F), and the injection of Gal-3-AAV increased the number of plaques in both Aβ1–42 mice and Aβ1–42 + FTS mice (F (1, 28) = 53.42, p < 0.0001; Aβ1–42 vs. Aβ1–42 + Gal-3-AAV: p < 0.0001; Aβ1–42 + FTS vs. Aβ1–42 + FTS + Gal-3-AAV: p < 0.0001; n = 8 mice per group; two-way ANOVA, followed by Sidak's test; Figure 4D). These results indicate that Gal-3 overexpression increases Aβ oligomerization and accumulation in Aβ1–42 mice and Aβ1–42 + FTS mice.
3.5 FTS Alleviates Aβ Pathology Through Reducing Aβ Production and Promoting Aβ Degradation
It has been reported that hyperactivated Ras can increase the level of phosphorylated JNK in imaginal discs [48]. PS1- or PS2-containing γ-secretase has been implicated in the development of AD because of its role in the cleavage of APP and the production of Aβ [49, 50]. A JNK-specific inhibitor can repress PS1 expression and γ-secretase activity in SK-N-SH cells in vitro and in the mouse brain in vivo [51]. Thus, we further explored whether FTS reduces PS1 through downregulating JNK phosphorylation, ultimately reducing Aβ production. The results revealed that the phosphorylation of JNK was markedly increased in Aβ1–42 mice (t = 5.388, df = 14, p < 0.0001; unpaired Student's t test; Figure 5A), an effect that was significantly reduced by FTS treatment (F (1, 28) = 38.02, p < 0.0001; Aβ1–42 vs. Aβ1–42 + FTS: p = 0.0009; n = 8 mice per group; two-way ANOVA followed by Sidak's test), and Gal-3 overexpression increased the phosphorylation of JNK in both Aβ1–42 mice and Aβ1–42 + FTS mice (F (1, 28) = 32.41, p < 0.0001; Aβ1–42 vs. Aβ1–42 + Gal-3-AAV: p < 0.0001; Aβ1–42 + FTS vs. Aβ1–42 + FTS + Gal-3-AAV: p = 0.0021; Figure 5B). The expression of PS1 was significantly upregulated in Aβ1–42 mice (t = 5.522, df = 14, p < 0.0001, unpaired Student's t test; Figure 5C), which decreased after FTS treatment (F (1, 42) = 50.62, p < 0.0001, Aβ1–42 vs. Aβ1–42 + FTS: p = 0.0027, n = 8 mice per group, two-way ANOVA, followed by Sidak's or Tukey's test; Figure 5D). Gal-3 overexpression and anisomycin enhanced PS1 expression levels in both Aβ1–42 mice and Aβ1–42 + FTS mice (F (2, 42) = 21.42, p < 0.0001, Aβ1–42 vs. Aβ1–42+ Gal-3-AAV: p = 0.0001, Aβ1–42 vs. Aβ1–42 + anisomycin: p = 0.0004, Aβ1–42 + FTS vs. Aβ1–42 + FTS + Gal-3-AAV: p = 0.0021, Aβ1–42 + FTS vs. Aβ1–42 + FTS + anisomycin: p = 0.0026). These results indicate that FTS may reduce the expression of PS1 through inhibiting the Gal-3–JNK pathway, which is related to Aβ production. In fact, the administration of anisomycin increased Aβ expression in Aβ1–42 mice and Aβ1–42 + FTS mice (F (1, 28) = 41.49, p < 0.0001; Aβ1–42 vs. Aβ1–42 + anisomycin: p = 0.0149; Aβ1–42 + FTS vs. Aβ1–42 + FTS + anisomycin: p = 0.0004; n = 8 mice per group; two-way ANOVA, followed by Sidak's test; Figure 5E), which was consistent with the change in PS1.

In addition to increasing Aβ production, decreasing Aβ degradation can also increase Aβ oligomerization and accumulation. Neprilysin (NEP) has recently been shown to degrade Aβ in vivo [52], and insulin-degrading enzyme (IDE) can degrade both Aβ40 and Aβ42 peptides and cleave Aβ at multiple sites [53]. Transthyretin (TTR) is known to prevent the aggregation of LMW Aβ to generate HMW Aβ [54]. As shown in Figure 5F,H,J, the expression levels of NEP (t = 3.830, df = 14, p = 0.0018, unpaired Student's t test; Figure 5F), IDE (t = 3.742, df = 14, p = 0.0022, unpaired Student's t test; Figure 5H), and TTR (t = 4.930, df = 14, p = 0.0002, unpaired Student's t test; Figure 5J) were reduced in Aβ1–42 mice. Interestingly, FTS treatment upregulated the expression levels of NEP (F (1, 28) = 6.257, p = 0.0185, Aβ1–42 vs. Aβ1–42 + FTS: p = 0.0025; n = 8 mice per group, two-way ANOVA, followed by Sidak's test; Figure 5G), IDE (F (1, 28) = 6.154, p = 0.0194, Aβ1–42 vs. Aβ1–42 + FTS: p = 0.0007; n = 8 mice per group, two-way ANOVA, followed by Sidak's test; Figure 5I) and TTR (F (1, 28) = 13.73, p = 0.0009, Aβ1–42 vs. Aβ1–42 + FTS: p = 0.0004; n = 8 mice per group, two-way ANOVA, followed by Sidak's test; Figure 5K), effects that were reversed by Gal-3 overexpression (NEP: F (1, 28) = 13.07, p = 0.0012, Aβ1–42 + FTS vs. Aβ1–42 + FTS + Gal-3-AAV: p = 0.0003; IDE: F (1, 28) = 8.084, p = 0.0082, Aβ1–42 + FTS vs. Aβ1–42 + FTS + Gal-3-AAV: p = 0.0003; TTR: F (1, 28) = 10.96, p = 0.0026, Aβ1–42 + FTS vs. Aβ1–42 + FTS + Gal-3-AAV: p = 0.0009). However, Gal-3 overexpression had no effect on the expression levels of these enzymes in Aβ1–42 mice (p = 0.9092). These results indicate that FTS can increase the expression levels of enzymes that degrade Aβ through the inhibition of Gal-3 in Aβ1–42 mice.
3.6 FTS Improves the Cognition of Aβ1–42 Mice, Which is Reversed by Gal-3 Overexpression
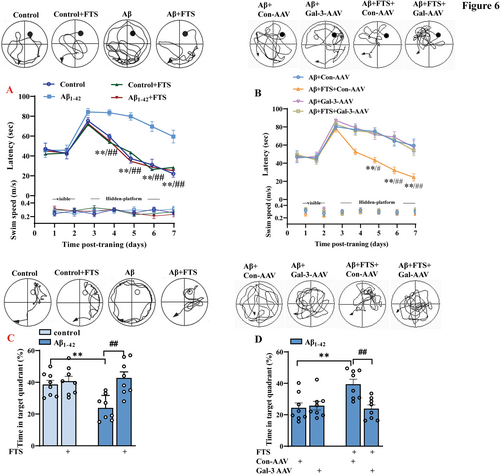
Then, we carried out a MWM test to evaluate the influence of FTS on the condition of Aβ1–42 mice. As shown in Figure 6A, the latency to find the visible platform was comparable between control mice and Aβ1–42 mice (F (3, 28) = 0.07299, p = 0.9740, control vs. Aβ1–42: p > 0.9999; upper), and there was no significant difference in swimming speed during training days between control mice and Aβ1–42 mice (F (3, 28) = 0.08749, p = 0.9663; Figure 6A, bottom). Compared with control mice, Aβ1–42 mice presented impaired spatial cognitive function, which manifested as a longer time to find the hidden platform (F (3, 28) = 17.11, p < 0.0001; Day 4: p = 0.0036, Day 5: p < 0.0001, Day 6: p < 0.0001, Day 7: p < 0.0001; n = 8, repeated-measures ANOVA; Figure 6A, upper) and a shorter swimming time in the target quadrant (F (1, 28) = 4.205, p = 0.0498, control vs. Aβ1–42: p = 0.0044; n = 8 mice per group, two-way ANOVA, followed by Sidak's test; Figure 6C). Furthermore, FTS treatment improved the spatial memory of Aβ1–42 mice, as shown by the latency to reach the platform (F (1, 28) = 11.76, p = 0.0019; Aβ1–42 vs. Aβ1–42 + FTS: Day 4: p = 0.0002, Day 5: p < 0.0001, Day 6: p < 0.0001, Day 7: p < 0.0001; n = 8; repeated-measures ANOVA; Figure 6A), as well as the time spent in the target quadrant (F (1, 28) = 11.44, p = 0.0021; Aβ1–42 vs. Aβ1–42 + FTS: p = 0.0004; n = 8 mice per group, two-way ANOVA, followed by Sidak's test; Figure 6C). Gal-3-AAV significantly compromised this improvement (latency: F (1, 28) = 9.153, p = 0.0053, Aβ1–42 + FTS vs. Aβ1–42 + FTS + Gal-3-AAV: Day 5: p = 0.0101, Day 6: p < 0.0001, Day 7: p = 0.0006, Figure 6B; time in the target quadrant: F (1, 28) = 6.084, p = 0.0065, Aβ1–42 + FTS vs. Aβ1–42 + FTS + Gal-3-AAV: p = 0.0036, Figure 6D).
4 Conclusion and Discussion
To our knowledge, the present study is the first to report the significant protective effects of the Ras inhibitor FTS on neuroinflammation in AD through the targeting of Gal-3 via multiple pathways, which provides a promising target and an effective way to treat AD.
4.1 FTS Regulates Neuroinflammation via Gal-3 by Directly Inhibiting Microglial Activation and Indirectly Reducing Aβ Pathology to Inhibit Microglial Activation
Gal-3 has been reported to play a crucial role in the neuroinflammatory response by mediating microglial activation via the IFN-γ and Janus kinase (JAK)/signal transducer and activator of transcription (STAT) pathways [55]. Our results showed that FTS treatment relieved the inflammatory response in Aβ1–42 mice (reducing the release of inflammatory molecules and inhibiting microglial activation, Figure 1A–I) through the inhibition of Gal-3.
TLR-stimulated signaling cascades act to upregulate the expression of proinflammatory cytokines and chemokines, NO synthase, and other antimicrobial peptides that directly destroy microbial pathogens, as reviewed by [56]. As an endogenous paracrine TLR4 ligand, Gal-3 can bind to microglial TLR4, triggering the proinflammatory response under acute neuroinflammatory conditions. The expression and release of Gal-3 are significantly increased by the proinflammatory cytokine IFN-γ in microglia [55]. Given the direct relationship between Gal-3 and inflammation, we speculate that FTS can downregulate Gal-3 expression to inhibit microglial activation, which inhibits inflammation in the brains of Aβ1–42 mice. This study focused mainly on the inflammatory response induced by Aβ pathology, which was related to Gal-3 overexpression in Aβ1–42 mice. Remarkably, in patients with AD, Aβ senile plaques are often found close to reactive microglia [57, 58]. In vitro, Aβ1–42 has been shown to activate microglia via CD36 and the TLR2–TLR6 heterodimer, and elevated levels of TNF-α and iNOS have also been reported in Aβ-treated primary rat microglia [59]. Disaggregation of AβOs can decrease Aβ-induced inflammation and rescue cognitive deficits in APP/PS1 mice [60]. In our study, AβOs and their accumulation significantly increased (Figure 3A–F), effects that were reduced by FTS treatment and reversed by Gal-3 overexpression. In addition, FTS promoted the production of Aβ via the Gal-3–JNK pathway (Figure 4A–E) and reduced the degradation of Aβ by increasing the number of degrading enzymes in a Gal-3-dependent manner (Figure 5A–F). As a result, we speculated that FTS regulated the inflammatory response in Aβ1–42 mice by directly inhibiting microglial activation and indirectly reducing Aβ pathology, both by targeting Gal-3.
4.2 FTS Regulates the Intracellular Distribution of Gal-3 to Inhibit Inflammation in AD
Endogenous Gal-3 is found mainly in the cytoplasm, and its expression is also observed on the cell membrane and in the nucleus; Gal-3 can also be released into the extracellular space upon stimulation (such as with LPS and IFN-γ) [61]. The different subcellular localizations of Gal-3 together with its possible posttranslational modifications are likely to affect the function of Gal-3 and explain the conflicting findings about Gal-3, for example, its pro- versus antiapoptotic effects [62] and pro- versus anti-inflammatory effects [16]. Recent studies have focused on the role of secreted Gal-3 in inflammation-associated diseases [63]. There is evidence that extracellular Gal-3 is able to activate immune and inflammatory signaling pathways through the phosphorylation of STAT1, STAT3, STAT5, and JAK2 [16]. The extracellular biological activities of Gal-3 are dependent mainly on binding cell surface and extracellular matrix glycan-related ligands [64]. Increased Gal-3 expression in the extracellular space has already been confirmed in some human diseases, including tumors, neurodegenerative diseases, and cardiovascular diseases [65]. A clear FTS-induced redistribution of Gal-3 from the cell membrane was observed in our study. We found that FTS treatment reduced the membrane expression (Figure 2C) of Gal-3 but increased its cytoplasmic expression (Figure 2D), interestingly decreasing the total expression (Figure 2B) and its release (Figure 2A), consistent with the findings of another study [25]: Gal-3 in ARO cancer cells was found to be localized in the cytoplasm and on the cell membrane before FTS treatment, but FTS treatment significantly increased the cytoplasmic Gal-3 content. We speculate that in our study, in the hippocampus of AD model mice, FTS dislodges Gal-3 from the plasma membrane and cytosolic Gal-3 is then degraded, which induces a decreased level of total Gal-3 and inhibits its release. However, the specific molecular mechanisms involved should be further elucidated.
Taken together, our study revealed that FTS may directly reduce the expression levels of TLR4 and CD14 by targeting Gal-3, alleviate the neuroinflammatory response, or reduce the production of Aβ via the inhibition of the Gal-3–JNK–PS1 pathway and increase the levels of enzymes that degrade Aβ through the inhibition of Gal-3 content; in this way, FTS indirectly downregulates TLR2, TLR4, and CD14, which are stimulated by Aβ; the direct and indirect decrease in TLRs induces improved neuroinflammation in Aβ1–42 mice.
Author Contributions
Qing Qiu, Cuicui Li, Xiaoli Zhao, and Menting Yang performed the research and analyzed the data. Haiying Liang and Shushu Ding edited the manuscript. Tingting Chen designed the research and wrote the manuscript.
Disclosure
The authors have nothing to report.
Conflicts of Interest
The authors declare no conflicts of interest.
Open Research
Data Availability Statement
The data that support the findings of this study are available from the corresponding author upon reasonable request.


