Early gut dysbiosis could be an indicator of unsuccessful diet control in gestational diabetes mellitus
Funding information: Chiang Mai University, Grant/Award Number: 114-2563 (C.T.); CMU Excellent Center Award (NC); National Research Council of Thailand, Grant/Award Number: Senior Research Scholar Grant (SCC); National Science and Technology Development Agency, Grant/Award Number: NSTDA Research Chair Grant (NC); Thailand Research Fund, Grant/Award Numbers: Distinguished Professor Grant, MRG6280014 (C.T.), DPG6280003 (T.T.)
Graphical Abstract
Highlights
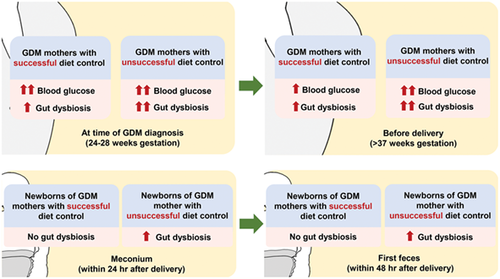
- At the time of gestational diabetes mellitus (GDM) diagnosis, gut dysbiosis was severer in mothers who ended up with diet control failure than those who ended up with successful diet control.
- This finding was noticed even when the glycemic profile at the time of GDM diagnosis was similar between these two groups.
- Interestingly, gut dysbiosis in GDM mothers with diet control failure was shown associated with gut dysbiosis in their newborns.
1 INTRODUCTION
Gut microbiota play a role in the development of gestational diabetes mellitus (GDM).1-9 Diet is a crucial factor in determining the gut microbiota composition in GDM.10, 11 However, studies investigating the gut microbiota in GDM women with diet control failure have not been established. GDM enhances the risk of complications in the offspring.12-14 Nonetheless, the effect of diet control failure in GDM mothers on their neonatal gut microbiota remains unknown. Therefore, we compared the gut microbiota between GDM women with and without successful diet control at the time of GDM diagnosis and before delivery. We also compared the gut microbiota in the newborns of GDM mothers with and without successful diet control. The relationships between maternal glycemic profile and the gut microbiota were also determined.
2 METHODS
After signing a written informed consent form, 79 pregnant women at 24 to 28 weeks of gestation were recruited from Maharaj Nakorn Chiang Mai Hospital, Chiang Mai University, Chiang Mai, Thailand. All research procedures were conducted in accordance with the relevant guidelines and regulations. GDM was diagnosed in accordance with the National Diabetes Data Group criteria, in which a 100-g oral glucose tolerance test was performed after a glucose challenge test ≥140 mg/dL.15 Women who exhibited two or more glucose levels higher than the cutoff values (fasting 105, 1 hour 190, 2 hours 165, and 3 hours 145 mg/dL) were classified as GDM.15 All GDM patients received dietary recommendations according to the International Federation of Gynecology and Obstetrics guidelines16 without receiving any antidiabetic drugs. The GDM women were instructed regarding self-monitoring of their capillary blood glucose. Participants whose fasting glucose level was >95 mg/dL or 2-hour postprandial glucose level >120 mg/dL before delivery were categorized as GDM with unsuccessful diet control (GDM-U; n = 13).17 Meanwhile, those in whom glucose levels could be controlled were classified as GDM with successful diet control (GDM-S; n = 28).17 Non-GDM cases (n = 38) were also included. The full-term newborns of all 79 participating pregnant women were also enrolled onto the study. At the time of GDM diagnosis and before delivery, maternal blood and feces were obtained for the analysis of metabolic parameters and gut microbiota, respectively. Meconium and the first feces of their newborns were also collected after delivery for the gut microbiota analysis.
3 RESULTS
The maternal age, prepregnant body mass index (BMI), gestational age at the time of diagnosis, gestational age at delivery, lipid profile, and glycosylated hemoglobin (HbA1c) level were not different among groups. At the time of diagnosis, fasting and 2-hour postprandial glucose levels did not differ between GDM-S and GDM-U groups, but these levels were higher than those of the non-GDM group. Before delivery, fasting and 2-hour postprandial glucose levels became higher in the GDM-U group. All of the newborns were totally breast-fed by their own mothers. The percentage of cesarean deliveries did not differ among groups. The birth weight and the percentage of large-for-gestational-age babies were no different among groups either (Table 1).
| Non-GDM (n = 38) | GDM-S (n = 28) | GDM-U (n = 13) | |
|---|---|---|---|
| Maternal parameters | |||
| Age (y) | 31.16 ± 0.86 | 32.50 ± 0.83 | 33.54 ± 1.25 |
| Prepregnant BMI (kg/m2) | 22.99 ± 0.73 | 23.79 ± 0.93 | 24.30 ± 1.08 |
| At the time of GDM diagnosis (second trimester) | |||
| Gestational age (wk) | 24.71 ± 0.15 | 24.75 ± 0.22 | 25.23 ± 0.34 |
| Fasting blood glucose (mg/dL) | 78.68 ± 1.45 | 93.82 ± 2.14a | 98.23 ± 3.42a |
| 2-h postprandial glucose (mg/dL) | 110.20 ± 3.01 | 136.20 ± 3.90a | 132.00 ± 2.62a |
| HbA1c (%) | 4.76 ± 0.07 | 4.93 ± 0.07 | 4.94 ± 0.07 |
| Total cholesterol (mg/dL) | 236.70 ± 5.82 | 244.50 ± 7.61 | 242.20 ± 10.14 |
| Triglycerides (mg/dL) | 208.80 ± 13.23 | 200.40 ± 12.46 | 211.30 ± 22.75 |
| LDL (mg/dL) | 152.00 ± 4.91 | 159.50 ± 7.23 | 160.50 ± 11.69 |
| Before delivery (third trimester) | |||
| Gestational age (wk) | 39.03 ± 0.14 | 38.43 ± 0.21 | 38.23 ± 0.26 |
| Fasting blood glucose (mg/dL) | 76.08 ± 1.22 | 82.29 ± 1.61a,b | 104.20 ± 1.98a,c |
| 2-h postprandial glucose (mg/dL) | 109.40 ± 2.38 | 119.00 ± 2.68a,b | 134.30 ± 2.09a,c |
| HbA1c (%) | 4.94 ± 0.06 | 5.14 ± 0.07 | 5.08 ± 0.11 |
| Total cholesterol (mg/dL) | 233.20 ± 5.57 | 244.40 ± 8.62 | 227.90 ± 6.35 |
| Triglycerides (mg/dL) | 234.60 ± 15.04 | 241.20 ± 13.86 | 247.30 ± 26.20 |
| LDL (mg/dL) | 157.30 ± 5.74 | 166.00 ± 6.592 | 152.70 ± 10.69 |
| Newborn parameters | |||
| Delivery pattern | |||
| Vaginal delivery (n) | 29 (76%) | 16 (57%) | 9 (69%) |
| Cesarean delivery (n) | 9 (24%) | 12 (43%) | 4 (31%) |
| Birth weight (g) | 3087 ± 52.81 | 3120 ± 73.67 | 3141 ± 73.52 |
| Body weight for gestational age | |||
| LGA (n) | 2 (5%) | 4 (14%) | 1 (7%) |
| AGA (n) | 34 (90%) | 24 (86%) | 12 (93%) |
| SGA (n) | 2 (5%) | 0 | 0 |
- Note: Data are reported as mean ± SEM. A one-way ANOVA followed by Fisher's least significant difference analysis or a chi-square test was used to determine the difference among groups.
- Abbreviations: AGA, appropriate for gestational age; ANOVA, analysis of variance; BMI, body mass index; GDM, gestational diabetes mellitus; GDM-S, GDM with successful diet control; GDM-U, GDM with unsuccessful diet control; HbA1c, glycosylated hemoglobin; LDL, low-density lipoprotein; LGA, large for gestational age; SEM, standard error of the mean; SGA, small for gestational age.
- a P < .05 vs non-GDM group.
- b P < .05 vs the same group at the time of GDM diagnosis.
- c P < .05 vs GDM-S group.
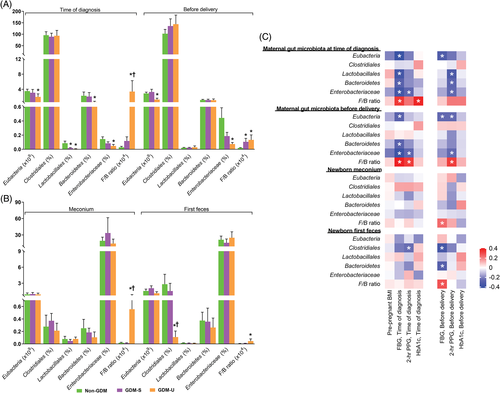
At the time of diagnosis, maternal Eubacteria, Lactobacillales, Bacteroidetes, and Enterobacteriaceae were significantly lower, whereas Firmicutes to Bacteroidetes (F:B) ratio was significantly higher in the GDM-U group. In contrast, the GDM-S group only exhibited significantly lower Lactobacillales. Before delivery, maternal Eubacteria and Enterobacteriaceae were significantly lower, whereas F:B ratio was significantly greater in the GDM-U group. On the other hand, the GDM-S group displayed only a significantly higher F:B ratio (Figure 1A). Neonatal Clostridiales was lower in the first feces of the GDM-U group. Additionally, a significantly higher F:B ratio was observed in both meconium and the first feces of the GDM-U group (Figure 1B). Interestingly, the gut microbiota composition of mothers and newborns were correlated with the maternal glycemic profile (Figure 1C).

4 COMMENTS
Our study demonstrates that early gut dysbiosis is an indicator of diet control failure in GDM mothers. This gut dysbiosis is associated with gut dysbiosis in their newborns, which may increase a risk of type 2 diabetes in the offspring later in life. Hence, the analysis of gut microbiota in GDM women at the time of diagnosis is beneficial to evaluate their risk of unsuccessful diet modification.
This study has some limitations. First, our sample size was too small, and therefore the data of gut microbiota could not be appropriately adjusted with any anthropometric and metabolic parameters. For this reason, our results may not be fully representative of the world population suffering from GDM. Hence, a large-sample study adjusting the data of gut microbiota with confounding factors such as prepregnant BMI, blood glucose level, HbA1c level, and lipid profile should be established. Furthermore, we did not record the specific pattern of dietary intake in each participant, and therefore we could not identify the association between the alterations of gut microbiota and dietary intake. Thus, a future study monitoring caloric intake and diet composition in each subject is needed.
ACKNOWLEDGEMENTS
We thank Distinguished Professor Dr Nipon Chattipakorn, MD, PhD, and Professor Theera Tongsong, MD for their useful suggestions. This study was supported by a Senior Research Scholar grant from the National Research Council of Thailand (S.C.C.), an NSTDA Research Chair Grant from the National Science and Technology Development Agency Thailand (N.C.), a Chiang Mai University Center of Excellence Award (N.C.), the Chiang Mai University Research Fund CMU-2564 (T.T.), and the Thailand Research Fund DPG-6280003 (T.T.). The funder had no role in the design of the study and the collection, analysis, and interpretation of data and in writing the manuscript.
CONFLICT OF INTEREST
The authors declared that there is no conflict of interest.
ETHICS STATEMENT
The study was conducted in accordance with the guidelines of the Declaration of Helsinki (as revised in Brazil 2013) and was approved by the research ethics committee of the Faculty of Medicine, Chiang Mai University (study code: OBG-2562-06451; date of approval: 8 August 2019).


