An approach for live imaging of first cleavage in mouse embryos using fluorescent chemical probes for DNA, microtubules, and microfilaments
Abstract
Purpose
Dynamic morphological changes in the chromosome and cytoskeleton occur in mammals and humans during early embryonic development, and abnormalities such as embryonic chromosomal aneuploidy occur when development does not proceed normally. Visualization of the intracellular organelles and cytoskeleton allows elucidation of the development of early mammalian embryos. The behavior of the DNA and cytoskeleton in early mammalian embryos has conventionally been observed by injecting target molecule mRNAs, incorporating a fluorescent substance-expressing gene, into embryos. In this study, we visualized the chronological behavior of male and female chromosome condensation in mouse embryos, beginning in the two-pronuclear zygote, through the first division to the two-cell stage, using fluorescent chemical probes to visualize the behavior of DNA, microtubules, and microfilaments.
Method
Mouse two-pronuclear stage embryo were immersed in medium containing fluorescent chemical probes to visualize DNA, microtubules, and microfilaments. Observation was performed with a confocal microscope.
Results
This method allowed us to observe how chromosome segregation errors in first somatic cell divisions in mouse embryos and enabled dynamic analysis of a phenomenon called lagging chromosomes.
Conclusions
By applying this method, we can observe any stage of embryonic development, which may provide new insights into embryonic development in other mammals.
Video Short
An approach for live imaging of first cleavage in mouse embryos using fluorescent chemical probes for DNA, microtubules, and microfilaments
by Okabe et al.1 INTRODUCTION
It is common in assisted reproductive technology to use a time-lapse incubator to observe and evaluate embryo developmental behavior.1 Although the relationship between the morphokinetics during cell division in early embryonic development and normal embryonic development remains unclear, some studies have reported that the developmental behavior analysis is effective for the selection of transplanted embryos.2 If we can visualize the cytoskeleton and intracellular organelles during early embryonic development, we could elucidate how the developmental behavior reflects embryonic development. Consequently, it will further our knowledge of the cell biology involved in embryonic developmental behavior and the selection of embryos.
Live cell imaging has been used to observe chromosomes and the cytoskeleton during early mammalian development. This process involved the use of fluorescent reagents that directly bind to the DNA, such as Hoechst dye,3 and the intracellular injection of fluorescently labeled cytoskeletal proteins.4 Furthermore, in recent years, it has been performed by injecting a target molecule mRNA incorporating a fluorescent substance-expressing gene, into the embryos.5, 6 However, these methods have drawbacks. First, the traditional fluorescent reagents are cytotoxic,7 and second, mechanical injection of mRNA is cumbersome and invasive to the embryo.8 Furthermore, injecting genetic material into a human embryo to induce it to produce target proteins that are not expressed naturally raises ethical concerns. Several low-toxicity and cell-permeable reagents, for live cell imaging, targeting the DNA and cytoskeletal proteins have recently been developed.9, 10 Moreover, the use of these reagents to visualize DNA and microfilaments during the developmental process involving the transition from mouse two-cell stage embryo to blastocyst-stage embryo, and in the development of human blastocyst-stage embryos, was reported in 2023.11
The first somatic cell division in mammals, that is, the process from the two-pronuclear stage embryos to the two-cell stage, is a special initial division of life, including male–female pronuclear fusion. It is a dynamic event, and observation via live imaging is necessary to capture the behavior of the DNA and cytoskeleton in the process, as it cannot be captured through conventional staining following fixation. In addition, the behavior of microtubules is considerably important for normal cell division. In a previous report, live imaging of microtubules during mammalian first somatic cell division was performed via mRNA injection.12 In this study, we aimed to monitor the changes in chromosomes, microtubules, and microfilaments during the first cleavage of mouse embryos without genetic manipulation or mechanical invasion, by using live imaging.
2 MATERIALS AND METHODS
2.1 Ethical approval
This study was approved by the Ethical Committee of Akita University (approval number: 1090–2). In addition, approval for the animal studies was obtained from the Institutional Animal Care and Use Committee of Akita University (approval number: a-1-0409). This study was conducted according to Akita University Animal Experimentation Regulations and complied with ARRIVE guidelines.
2.2 Mouse two-pronuclear stage embryos
Mouse embryos were acquired from ARK Resource Co., Ltd. (Kumamoto, Japan). The embryos were derived from in vitro fertilization, using 9–12-week-old Crl:CD1(ICR) male and B6D2F1/Crl female mice (Jackson Laboratory, Kanagawa, Japan). In vitro fertilization, embryo vitrification, and thawing were performed as described previously.13, 14 Embryos were frozen after the two pronuclei were visible in the bright field and used for experiments after thawing. Potassium simplex optimized medium (KSOM; ARK Resource Co., Kumamoto, Japan) was used for embryo culture and observation. We did not remove the attached sperms to avoid affecting the growth behavior of the embryos.
2.3 Reagents for the detection of the DNA and cytoskeleton
All experimental reagents were prepared using KSOM at concentrations within the ranges stated in the instruction manual. Dilutions were performed as follows: NucleoSeeing (Funakoshi Co., Tokyo, Japan) was diluted to 1 μM; the SiR700-tubulin kit (Cytoskeleton, Inc., Denver, USA) was diluted to 100 nM; and the SPY-555 actin (Cytoskeleton Inc.) stock solution was diluted 1000-fold. All reagents were combined and used as the observation medium for triple staining. After thawing, a 5-μL drop of observation culture medium per embryo was placed in a 35-mm glass-bottom dish (Matsunami Glass Industry, Osaka, Japan). For observation, the drops were covered with Light Mineral Oil (FUJIFILM Irvine Scientific Inc., Saitama, Japan). Regarding DNA, while a previous study used SPY650-DNA,11 we used a NucleoSeeing (excitation wavelength 488–520 nm) to avoid interference with the excitation wavelength of 700 nm for the microtubule SiR-700-tubulin.
2.4 Confocal microscopy and time-lapse imaging
The reagents, culture medium, and microscope settings used in the experiment are shown in Figure 1. For laser scanning confocal imaging (Figures 2 and 3; Movies S1–S4), a customized Zeiss (Tokyo, Japan) LSM980 microscope equipped with a 40x/NA 1.20 W Korr C-Apochromat objective was used, controlled by the ZEN Blue software (Zeiss). Images were acquired at a resolution of 0.414 × 0.414 μm per pixel, an optical thickness of 1.250 μm per slice, and a depth of 16 bits, using four channels.
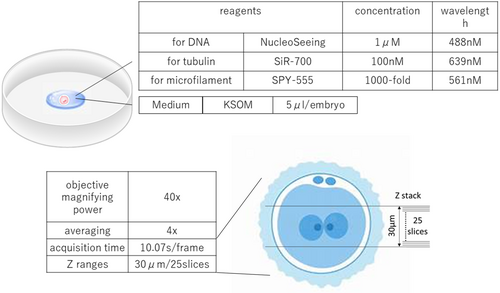

For NucleoSeeing live imaging, a 488-nm laser excitation was used. Emissions were detected on a gallium arsenide phosphide-photomultiplier tube (GaAsP-PMT) detector array at wavelengths between 490 and 544 nm (indicated by green color in images). For SiR-700 imaging, 639-nm laser excitation was used, and the emission was detected on a Multialkali-PMT detector array at wavelengths ranging between 642 and 758 nm (indicated by the red color in images). For SPY-555 live imaging, a 561-nm laser excitation was used, and the emission was detected on a GaAsP-PMT detector array at wavelengths ranging between 552 and 623 nm (indicated by the blue color in images). The transmission image was detected on a T-PMT detector array. Z ranges were taken from 25 slices of 30-μm width, with the center of the embryo positioned in the middle of the image frame. Images were acquired through bidirectional scanning with 4× line averaging, pixel dual time of 8.19 μs per pixel, and acquisition time of 10.07 s per frame. The best conditions obtained for simultaneous observation of DNA; microtubules and microfilaments in mouse first mitosis cell were examined on the advice of an application engineer from an optical instrument manufacturer. The best conditions for detailed observation of the first mitosis were obtained by adjusting the laser intensity, pinhole diameter, average adjustment, and scan speed for each of the three wavelengths. Imaging was performed in an incubation chamber (Tokai Hit, Shizuoka, Japan) with the following parameters: temperature, 37°C; humidity, 100%; and CO2 concentration, 5%. We reconstructed the maximum intensity projections from z-stack images using the ZEN Blue imaging software (Zeiss). After thawing, images were captured using the confocal microscope every 5 min, from the two-pronuclear to the two-cell stage.
2.5 Examination of the effect of live imaging on embryonic development
We observed 25 embryos from the imaging observation group (Obs group). For comparison, we observed the growth of 22 unmanipulated freeze-thawed embryos (Ctr group) using the confocal microscope. In addition, after immersion and washing in a culture solution containing the staining substance, the growth of 22 embryos in the drug-treated group (DT group) was observed for the same period without imaging. The proportion of embryos that reached the two-cell, four-cell, eight-cell, and blastocyst stages in the three groups was calculated and compared. All statistical analyses were performed using The R Project for Statistical Computing (Version 4.0.2; R, Vienna, Austria). Fisher's exact test, adjusted by the Benjamini–Hochberg method, was used for statistical analysis. We compared the cytotoxicity between the Obs, Ctr, and DT groups. In addition, we used bright-field microscopy to extract 16 embryos, considered to display normal cleavage, each from the Obs/Ctr/DT groups, and compared the elapsed time from nuclear envelope breakdown (NEBD) to the two-cell stage in each group. One-way analysis of variance was used for statistical analysis. p-values <0.05 were considered to be statistically significant.
3 RESULTS
3.1 Dynamic observation of chromatin and cytoskeleton in mouse embryos from the two-pronuclear to the two-cell stage
Twenty-five embryos were observed. And DNA, microtubules, and microfilaments could be visualized in all embryos. In 24(96.0%) embryos, nuclear envelope breakdown (NEBD) and chromosome aggregation were observed. In one embryo, NEBD did not observed due to the discrepancy between the timing of cleavage and observation. Perinuclear microtubules were observed in 23 of the 24(95.8%) embryos in which NEBD and chromosome aggregation were observed. Structure, like a contractile ring was observed in all 23 embryos. Chromosome segregation was observed in 22 of the 23(95.7%) embryos, excluding the embryos shown in Figure 3 A. Nuclei of two-cell stage embryos were observed in 19 of the 22(86.4%) embryos. In the other three embryos, nuclei of two-cell stage embryos were outside of the observation range and could not be confirmed.
3.1.1 Analysis of chromatin behavior using NucleoSeeing
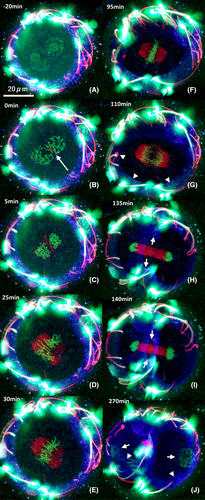
We visualized the chronological behavior of male and female chromosome condensation in mouse embryos, beginning in the two-pronuclear zygote, through the first division, into the two-cell stage. The process of chromosome condensation began in both male and female pronuclei simultaneously, with both sets of chromosomes maximally condensed before pronuclear breakdown. Following pronuclear envelope breakdown, the condensed male and female pronuclei mixed at the zygote center, with chromosome congression. We observed anaphase chromosome separation and migration to the opposite poles. Cell division commenced, and daughter nuclei reconstitution was observed. (Figure 2; green).
3.1.2 Microtubule behavior analysis using SiR-700 tubulin
We visualized the temporal behavior of microtubules in mouse embryos from the two-pronuclear to the two-cell stage. Microtubules were formed from multiple microtubule-organizing centers (MTOCs), and the formation of the first mitotic spindle was observed. In addition, during anaphase, midbody formation was observed between the blastomeres (Figure 2; red).
3.1.3 Dynamic analysis of microfilaments using SPY-555 actin
We visualized the behavior of microfilaments (MFs) in mouse embryos from the two-pronuclear to the two-cell stage. In the pronuclear and early mitotic zygotes, MFs were restricted to the cortical region (Figures 2A–E, blue). As chromosome segregation ensued, an MF contraction ring assembled rapidly and constructed as the chromosomes reached the zenith of their separation to opposing poles (Figures 2H–J; blue, arrows). After cell division, the MFs were again restricted to the cortical region of the daughter cells (Figure 2J; blue, arrowheads).
3.1.4 Spatiotemporal correlation of chromatin, microtubules, and microfilaments using multiple staining techniques
Aggregation of chromatin was initiated in the male and female pronuclei separately, and microtubules assembled randomly in the cytoplasm from multiple MTOCs (Figures 2B; red, arrow). While microtubules became polarized, chromosome pairing began (Figures 2D,E), and chromosome alignment to the metaphase plate was observed along with the formation of the mitotic spindle (Figure 2F). Briefly, the chromosomes migrated to the spindle poles (Figure 2G), and the formation of midbodies between the separated chromosomes was observed (Figures 2H,I). When the chromosome moved to the poles of the mitotic spindle, a contractile ring was rapidly formed by MFs and constricted the midbody structure by the end of chromosome separation (Figures 2H,I; blue, arrows).
3.2 Chromatin and cytoskeleton formation in embryos with abnormal division dynamics
Several embryo abnormal division dynamics were noted in this study. We observed a mitotic zygote that formed contraction rings without the alignment of chromosomes (Figure 3 A, Movie S2). We also observed a zygote that exhibited appropriate alignment of chromosomes but incomplete chromosomal segregation occurs at the center of the contractile ring (Figure 3B; Movie S3). Another one shows the lagging chromosome left in a midbody during metaphase after segregation (Figure 3C; Movie S4).
3.3 Examination of the effect of live imaging on embryonic development
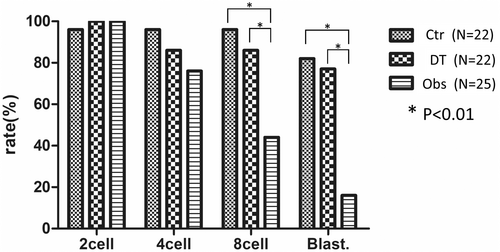
The proportion of embryos that reached the two-cell stage in the Ctr, DT, and Obs groups was 95.5%, 100%, and 100%, respectively. The proportion of embryos that reached the four-cell stage in the Ctr, DT, and Obs groups was 95.5%, 86.4%, and 76%, respectively. The proportion of embryos that reached the eight-cell stage in the Ctr, DT, and Obs groups was 95.5%, 86.4%, and 44%, respectively. The proportion of embryos that reached the blastocyst stage in the Ctr, DT, and Obs groups was 81.8%, 77.3%, and 16%, respectively. No significant difference was observed in the proportion of embryos that reached the four-cell stage among the three groups (p < 0.01). However, regarding the proportion of embryos that reached the eight-cell and blastocyst stages, a significant difference was observed between the Ctr and Obs groups (Figure 4).
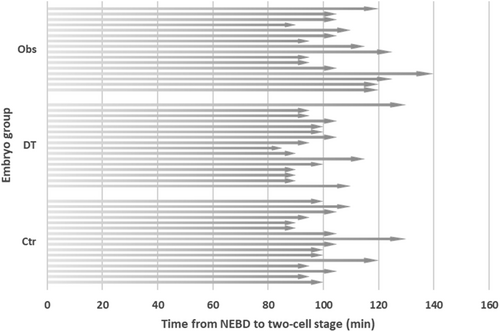
The elapsed time in the Obs group was 90–140 min (mean: 110.6 min). The elapsed time for the Ctr and DT groups were 90–130 min (mean: 102.8 min) and 85–130 min (mean: 99.7 min), respectively (Figure 5). The results of one-way analysis of variance on the elapsed time until the two-cell stage did not show a significant difference among the groups (F(4, 43) = 2.589; p = 0.1701).
4 DISCUSSION
The behavior of DNA and cytoskeleton in early mammalian embryos has conventionally been visualized and observed by the injection of mRNA encoding a target protein bound to a fluorescent protein.5, 6 While this method provides the advantage of little color deterioration, enabling long-term observation, injecting genetic material into a human embryo to induce the embryo to produce external proteins raises ethical concerns. From this perspective, we believe this method might potentially be applicable to monitor human embryogenesis with lesser ethical concerns in the future. Compared with that obtained from conventional approaches, the information obtained from live cell imaging includes spatiotemporal elements during embryonic development that have the potential to advance our understanding of chromosomes, microtubules, and microfilament interactions during the first cell cycle in mammalian zygotes.
Live cell imaging methods for studies on early mammalian development have previously involved DNA-binding and cell-permeable dyes, such as Hoechst stains.3 However, the dyes and their excitation wavelengths are cytotoxic,7 causing difficulties in conducting reliable cell development over time. NucleoSeeing is a novel probe composed of diacetyl-fluorescein and Hoechst33342 as a DNA-binding tag linked by the optimal PEG linker, making it cell-permeable. Without double-stranded DNA, NucleoSeeing is strongly quenched, providing ideal signal-to-noise values for visualizing chromosomes. In addition, it shows a low affinity for non-nuclear organelles, with lower phototoxicity than conventional cell-permeable dyes like Hoechst 33342.10 Moreover, the usefulness of NucleoSeeing has already been demonstrated in plant and cell line experiments.15
Additionally, fluorescently labeled reagents for use as cell-permeable cytoskeletal binding substances are already commercially available for the identification of cytoskeletal proteins. The SiR-700 tubulin kit, used to observe microtubules in this study, consists of a microtubule-binding drug, docetaxel, and its usefulness has been demonstrated in live observation of HeLa cells.16 In addition, SPY-555 actin is based on a derivative of the selective F-actin ligand Jasplakinolide, which was used for MF observation in the current study. Domingo et al. examined the localization of microfilaments by using fixed samples, mRNA injection, and SPY-555 actin, and reported that the use of these three methods resulted in comparable findings.11
We combined these reagents to observe mouse embryos to investigate the complex and dynamic interactions between the chromatin, tubulin, and actin cytoskeleton from the late fertilization period to the first cleavage (i.e., from the two-pronuclear to the two-cell stage). To our knowledge, compared with the previous studies utilizing these unique probes, our study reports a clearer and more dynamic observation of early embryogenesis, showing three elements simultaneously. Thus, we believe this method will be useful for the analysis of mammalian embryogenetic mechanisms in the future. For example, the anomalies, displayed in Figure 3A,B, appear to be obvious hindrances to nucleation after cleavage. However, the anomalies, reported in Figure 3C, may appear to be normal segregation, but a chromosome may be missing in one of the daughter cells. Such a phenomenon in which chromosomes are left behind the metaphase plate has also been reported as a chromosome segregation error in a study using mRNA injection for live imaging.17 The abnormal division observed in the present study also showed morphological abnormalities in the mitotic spindle formed by microtubules, along with abnormalities in the processes of chromosome alignment and segregation. The close association of the behavior of microtubules with the abnormal division of early embryos was dynamically visualized.
In this study, we focused on clearly depicting the three cell components in the first division, and after repeatedly setting conditions, we proposed settings that would yield the best images. Under this condition, we could visualize DNA, microtubules, and microfilaments in all 25 embryos which were observed. That is to say, this method is efficient to observe cytoskeletons, which we consider an advantage of this method, including its simplicity. Embryonic development occurred at least up to the four-cell stage after live imaging, and there were no embryos which significant difference from the development in cells without treatment for imaging, but a decline in the rate of development was observed thereafter. It may depend on the timing of immersion in reagents and observation as well as the observation period. Domingo et al. reported that offsprings were obtained from mouse embryos transplanted after live imaging.11 However, they did not state whether the result was obtained from embryos observed from the two-pronuclear stage, and toxicity to cells might be stronger in early stages, such as the two-pronuclear stage. In this study, the three groups showed no significant difference in the time from nuclear envelope breakdown (NEBD) to the two-cell stage, and there was no significant difference in the proportion of embryos that reached the four-cell stage after live imaging. Although further investigation on the application of this method in other mammals and the setting of better observation conditions for mice should be explored in the future, focusing only the observation period and time (in this report, from the two-pronuclear stage to the two-cell stage), the method used in this study could minimize the damage caused to embryos by live imaging.
In conclusion, in this study, we visualized the spatiotemporal relationships of the three cellular components in the first cleavage of mouse zygotes. The quality of the acquired images was sufficient for studying the behavior of DNA, microtubules, and microfilaments. This technique is expected to help gain knowledge on intracellular dynamics in the development of early human embryos, in which a variety of events occur compared with mice. Moreover, given this method is simple and does not require genetic manipulation of the embryos, it is likely to be used widely.
ACKNOWLEDGMENTS
This research was conducted using the Ministry of Education, Culture, Sports, Science, and Technology Grants-in-Aid for Scientific Research (project number: a-1-0409) to Y.T. This work was supported by the JSPS KAKENHI (grant number 21H03073).
We are grateful to Prof. Gerald Schatten (Pittsburgh Development Center), Dr. Soichi Koyota (Molecular Medicine Laboratory, Bioscience Education and Research Support Center, Akita University), Yasuhiko Sato (Zeiss), and Toshiaki Kawabe (ARK Resource Co., Ltd.) for their continuous support and encouragement. We would also like to thank Editage (www.editage.com) for their English language editing services.
CONFLICT OF INTEREST STATEMENT
Yukihiro Terada is an Editorial Board member of Reproductive Medicine and Biology and a co-author of this article. To minimize bias, they were excluded from all editorial decision-making related to the acceptance of this article for publication.


