Oncogenic SLC2A11–MIF fusion protein interacts with polypyrimidine tract binding protein 1 to facilitate bladder cancer proliferation and metastasis by regulating mRNA stability
Abstract
Chimeric RNAs, distinct from DNA gene fusions, have emerged as promising therapeutic targets with diverse functions in cancer treatment. However, the functional significance and therapeutic potential of most chimeric RNAs remain unclear. Here we identify a novel fusion transcript of solute carrier family 2-member 11 (SLC2A11) and macrophage migration inhibitory factor (MIF). In this study, we investigated the upregulation of SLC2A11–MIF in The Cancer Genome Atlas cohort and a cohort of patients from Sun Yat-Sen Memorial Hospital. Subsequently, functional investigations demonstrated that SLC2A11–MIF enhanced the proliferation, antiapoptotic effects, and metastasis of bladder cancer cells in vitro and in vivo. Mechanistically, the fusion protein encoded by SLC2A11–MIF interacted with polypyrimidine tract binding protein 1 (PTBP1) and regulated the mRNA half-lives of Polo Like Kinase 1, Roundabout guidance receptor 1, and phosphoinositide-3-kinase regulatory subunit 3 in BCa cells. Moreover, PTBP1 knockdown abolished the enhanced impact of SLC2A11–MIF on biological function and mRNA stability. Furthermore, the expression of SLC2A11–MIF mRNA is regulated by CCCTC-binding factor and stabilized through RNA N4-acetylcytidine modification facilitated by N-acetyltransferase 10. Overall, our findings revealed a significant fusion protein orchestrated by the SLC2A11–MIF–PTBP1 axis that governs mRNA stability during the multistep progression of bladder cancer.
1 INTRODUCTION
Chimeric RNAs are composite transcripts comprising exons from distinct genes at the RNA level.1, 2 These alterations are conventionally attributed to fusion genes resulting from chromosomal rearrangements.3, 4 However, advancements in deep sequencing technologies5, 6 have resulted in the identification of noncanonical chimeric RNAs that arise from intergenic splicing events without any alterations at the DNA level.7 Trans-splicing or cis-splicing events between adjacent genes (cis-SAGe) represents a pivotal mechanism underlying the generation of chimeric transcripts.8, 9 Further investigation revealed that chimeric RNAs play a significant role independent of their parental genes.10, 11 However, the complete elucidation of the biological role and molecular mechanism underlying chimeric RNAs remains to be achieved.
Since the discovery of GOLM1–NAA35 in esophageal carcinoma, there has been a substantial demand for potential diagnostic and therapeutic targets pertaining to cancer-specific chimeric RNAs.12 Subsequently, additional noncanonical chimeric RNAs, such as SLC45A3–ELK4 in prostate cancer,13, 14 RRM2–c2orf48 in nasopharyngeal carcinoma and lung cancer,15, 16 and BCL2L2–PABPN1 in glioblastoma and bladder cancer (BCa),2, 11 have been reported in various solid cancers. These chimeric RNAs have demonstrated their importance in tumor growth, metastasis, drug resistance, and signaling pathway activation.17 However, unravelling the expression patterns and biological functions underlying chimeric RNAs in BCa remains a persistent challenge that requires further investigation.
Chimeric RNAs can exert a diverse range of cellular effects through multiple mechanisms, including acting as long noncoding RNAs,13 fusion proteins,18 and perturbing the expression of parental genes.19 In prostate cancer, SLC45A3–ELK4 serves as a long noncoding RNA to regulate tumor proliferation.13 RAD51AP1–DYRK4, on the other hand, encodes a fusion protein that triggers the activation of the MEK/ERK signaling pathway to enhance sensitivity to trametinib.20 A recently discovered chimeric RNA called SLC2A11–MIF has exhibited a high prevalence in cervical,21 colorectal,22 and bladder cancer.2 However, the precise molecular mechanisms underlying the activity of SLC2A11–MIF remain elusive.
In our study, we focused on the highly prevalent chimeric RNA SLC2A11–MIF that facilitates the proliferation and metastasis of bladder cancer cells in vitro and enhances tumor growth and lymphatic metastasis in vivo. Mechanistically, SLC2A11–MIF recruited PTBP1 to stabilize Polo Like Kinase 1 (PLK1), Roundabout guidance receptor 1 (ROBO1), and phosphoinositide-3-kinase regulatory subunit 3 (PIK3R3) mRNA, thereby upregulating their expression levels. Additionally, we discovered that SLC2A11–MIF is generated as a byproduct of readthrough transcription and is regulated by CCCTC-binding factor (CTCF) and N-acetyltransferase 10 (NAT10). Consequently, targeting SLC2A11–MIF could serve as a therapeutic strategy for reducing the proliferation and metastasis of bladder cancer.
2 RESULTS
2.1 Characterization of the chimeric RNA SLC2A11–MIF and its parental genes in bladder cancer
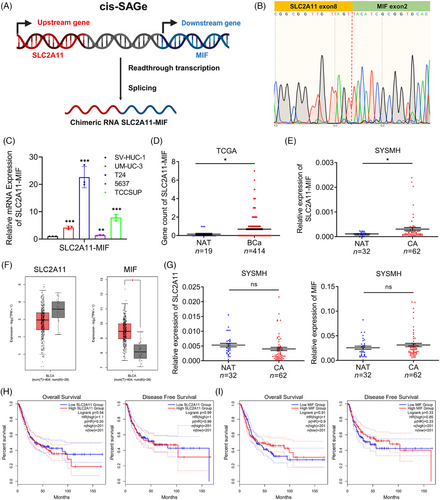
Chimeric RNA SLC2A11–MIF is classified as a read-through event occurring between adjacent genes transcribed on the same DNA strand, was confirmed through Sanger sequencing (Figure 1A,B). Our findings demonstrated the significant upregulation of SLC2A11–MIF in BCa cell lines (Figure 1C), and this observation was further supported by The Cancer Genome Atlas (TCGA) data and an independent 94-case cohort from Sun Yat-Sen Memorial Hospital (SYSMH) (Figure 1D,E). We also investigated the expression of the parental genes SLC2A11 and MIF in the TCGA and SYSMH cohorts (Figure 1F,G). Furthermore, there was no significant difference in overall survival (OS) or disease-free survival (DFS) among patients displaying elevated levels of SLC2A11 and MIF expression (Figure 1H,I). In conclusion, these results suggest that the upregulation of the SLC2A11–MIF transcript is a prevalent characteristic of bladder cancer.
2.2 Knockdown of SLC2A11–MIF inhibited proliferation in vitro and tumor growth in vivo
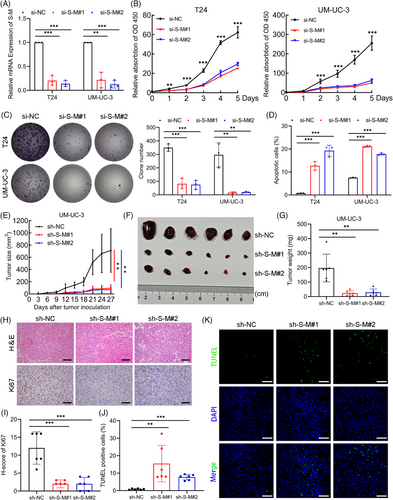
To explore the impact of SLC2A11–MIF on bladder cancer progression, we utilized specific small interfering RNAs (siRNAs) to effectively suppress SLC2A11–MIF expression. Quantitative reverse transcription PCR (qRT-PCR) analysis revealed significant downregulation of SLC2A11–MIF, while the expression of the parental genes SLC2A11 and MIF was unaltered (Figures 2A and S1A). Subsequently, using a Cell Counting Kit-8 (CCK-8) and colony formation assays, we demonstrated that SLC2A11–MIF knockdown significantly decreased cell viability (Figure 2B,C). Additionally, flow cytometric analysis revealed that knockdown of SLC2A11–MIF resulted in a significant increase in apoptosis, accompanied by cell cycle arrest at the G0/G1 phase and a corresponding decrease in the population within the S phase (Figures 2D and S1B–D). Subsequently, we established stable SLC2A11–MIF-silenced or nontargeting control UM-UC-3 cells and administered them via subcutaneous injection into BALB/c nude mice (Figure S2A). Furthermore, knockdown of SLC2A11–MIF led to a significant decrease in tumor growth (Figure 2E) and reduced tumor size and weight (Figure 2F,G). Moreover, the tumors derived from cells with suppressed SLC2A11–MIF exhibited reduced levels of Ki67, a marker associated with cellular proliferation (Figure 2H,I), and an increased proportion of TUNEL-positive cells (Figure 2J,K). Collectively, these findings strongly indicate that SLC2A11–MIF promotes cell proliferation by modulating both apoptotic pathways and the G1/S phase transition in vitro and in vivo.
2.3 Knockdown of SLC2A11–MIF suppressed metastasis independent of its parental genes in vitro and lymphatic metastasis in vivo
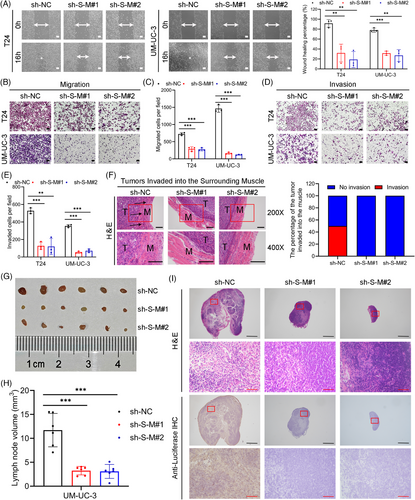
To evaluate the impact of SLC2A11–MIF on metastatic behavior, we conducted wound healing, migration, and invasion assays. Furthermore, knockdown of SLC2A11–MIF effectively suppressed the migration and invasion of BCa cells (Figure 3A–E). Importantly, our findings revealed that control BCa cells formed tumors characterized by invasive spike-like structures penetrating the surrounding muscle tissues, whereas SLC2A11–MIF-knockdown cells exhibited distinct smooth edges (Figure 3F). Subsequently, we established a nude mouse model by injecting UM-UC-3/luciferase into the footpads in vivo (Figure S2B). Remarkably, mice bearing SLC2A11–MIF-knockdown tumors exhibited prolonged survival (Figure S2C). Importantly, the incidence of lymphatic metastasis significantly decreased from 66.67% in the control group to 16.67 and 0% in the SLC2A11–MIF knockdown group (Figure S2D). Furthermore, the popliteal lymph nodes of the SLC2A11–MIF shRNA-treated mice exhibited significantly reduced volumes (Figure 3G,H). The presence of metastatic LNs was confirmed through H&E staining as well as immunostaining for luciferase (Figure 3I). The collective findings of this investigation demonstrate that SLC2A11–MIF plays a pivotal role in facilitating the migration and invasion of BCa cells in vitro and lymphatic metastasis in vivo.
To investigate the distinct functions of SLC2A11–MIF independent of their parental genes, we used specific siRNAs to knockdown the expression of parental genes while keeping the chimeric expression levels of SLC2A11–MIF unaltered (Figure S3A–D). Subsequently, we demonstrated that knockdown of both SLC2A11 and MIF significantly impaired the viability and colony-forming ability (Figure S3E,F). However, knockdown of the parental genes did not significantly affect the migration or invasion of the BCa cells (Figure S3G–K). Therefore, these findings provide evidence for the distinct metastatic function of SLC2A11–MIF independent of its parental genes in vitro.
2.4 Characterization of the SLC2A11–MIF encoded fusion protein in BCa
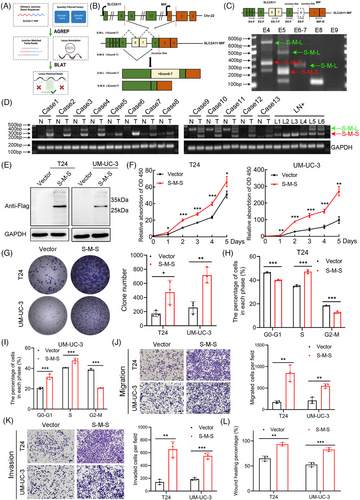
Expanding upon our previous investigation, we identified two predominant isoforms of SLC2A11–MIF using the AGREP methodology (Figure 4A). One variant involves the fusion of exon 8 from SLC2A11 with exon 2 from MIF (referred to as S-M-L), while the other isoform, denoted as e5-e8-e2 (S-M-S), arises from the exclusion of exons 6 and 7 followed by the joining of exon 5 with exon 8 from SLC2A11 before merging with exon 2 of MIF (Figure 4B). Subsequently, we designed exon-specific primers flanking the chimeric junction site and confirmed the expression of both isoforms of SLC2A11–MIF by RT-PCR and Sanger sequencing and observed increased expression of the S-M-S isoform (Figures 4C and S4A‒C). Notably, S-M-S exhibited the most significant upregulation in both BCa tissues and metastatic lymph node tissues (LN+) compared with NATs (Figure 4D). To evaluate the translatability of SLC2A11–MIF transcripts, we generated predominant variant S-M-S open reading frame (ORF) in T24 and UM-UC-3. qRT-PCR and western blot analysis revealed specific protein bands corresponding to S-M-S in transduced T24 and UM-UC-3 cells (Figures 4E and S4D). The subcellular localization of the fusion protein is strongly associated with its underlying biological mechanism, as evidenced by western blot and immunofluorescence analyses revealing a predominantly cytoplasmic distribution of the SLC2A11–MIF fusion protein (Figure S4E,F). In conclusion, these results demonstrated that the S-M-S fusion transcript is the predominant isoform and encodes a fusion protein in BCa cells.
2.5 SLC2A11–MIF enhanced the growth and metastasis of BCa in vitro and in vivo
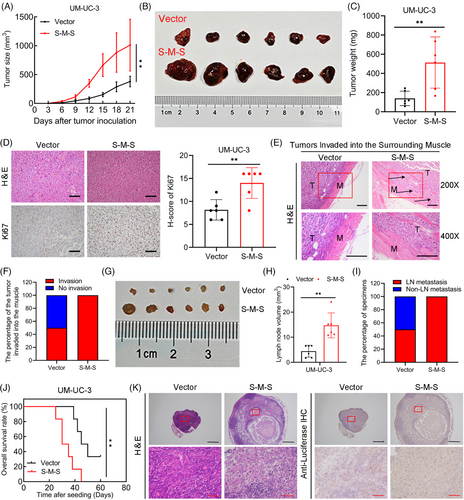
To conduct a more in-depth examination of the function of the S-M-S variant of SLC2A11–MIF in BCa, we conducted functional assays in BCa cells. CCK8, colony formation, and flow cytometry analyses revealed that SLC2A11–MIF overexpression considerably improved the proliferative capacity of BCa cells (Figures 4F–I and S4G). Additionally, we found that SLC2A11–MIF significantly increased the migration and invasion of BCa cells (Figures 4J–L and S4H). Subsequently, we administered stable SLC2A11–MIF-overexpressing cells into the subcutaneous regions and footpads of nude mice. Intriguingly, the growth, tumor size, and weight of the SLC2A11–MIF-overexpressing tumors were significantly increased (Figure 5A–C). Moreover, tumors derived from SLC2A11–MIF-overexpressing cells exhibited upregulated Ki67 expression (Figure 5D) and invasive spike-like structures that infiltrated the surrounding muscle tissues (Figure 5E,F). Furthermore, SLC2A11–MIF-overexpressing mice exhibited a significant increase in popliteal lymph node volume, a decrease in survival rate, and a marked increase in the rate of lymphatic metastasis from 50 to 100% (Figure 5G–J). Additionally, the detection of metastatic lymph nodes was confirmed through H&E staining and luciferase immunohistochemistry (IHC) analysis (Figure 5K). Collectively, these findings provide compelling evidence supporting the role of SLC2A11–MIF in promoting tumor progression and metastasis in BCa cells in vitro and in vivo.
2.6 The fusion protein SLC2A11–MIF interacts with PTBP1 to play an oncogenic role in BCa
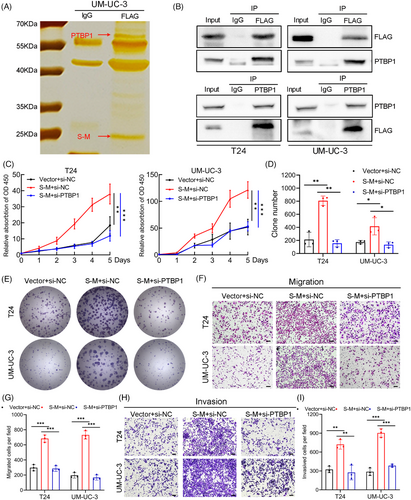
To elucidate the functional mechanism and identify protein interactors of the fusion protein SLC2A11–MIF, we conducted co-immunoprecipitation (Co-IP) followed by immunoprecipitation-mass spectrometry. A distinct band ranging from 55 to 70 kDa was observed by silver staining and subsequently identified as PTBP1 through mass spectrometry (Figures 6A and S5A). We further confirmed the specific interaction between SLC2A11–MIF and PTBP1 using western blotting and immunofluorescence (Figures 6B and S5B). We previously demonstrated that PTBP1 induces proliferation and lymphatic metastasis.23 To elucidate the functional significance of the SLC2A11–MIF–PTBP1 complex, we overexpressed SLC2A11–MIF and subsequently knocked down PTBP1 in the T24 and UM-UC-3 cell lines (Figure S5C). Importantly, depletion of PTBP1 eliminated the SLC2A11–MIF-induced increase in cell proliferation and metastasis in vitro (Figure 6C–I). Thus, these findings indicate that SLC2A11–MIF modulates proliferation and metastasis through a PTBP1-dependent mechanism in bladder cancer cells.
2.7 SLC2A11–MIF modulates the stability of PLK1, ROBO1, and PIK3R3 mRNA in a PTBP1-mediated manner
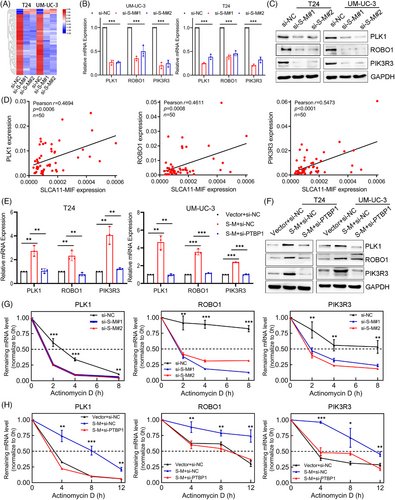
To clarify the molecular mechanism that underlies SLC2A11–MIF-mediated proliferation and metastasis in BCa, we performed transcriptome sequencing to compare the gene expression profiles between SLC2A11–MIF-silenced T24 and UM-UC-3 cells. Among the 61 genes subjected to regulatory control by SLC2A11–MIF (p value < 0.05, |log2FoldChange| > 1), we observed significant downregulation of several critical genes involved in cell proliferation and metastasis, including PLK1, ROBO1, and PIK3R3, upon silencing SLC2A11–MIF (Figures 7A and S6A–D). Furthermore, qRT-PCR and western blotting revealed decreases in PLK1, ROBO1, and PIK3R3 mRNA and protein expression in SLC2A11–MIF-silenced cells (Figure 7B,C). Additionally, we detected a notable and favorable correlation between the expression of SLC2A11–MIF and the levels of PLK1, ROBO1, and PIK3R3 in a cohort of BCa patients (Figure 7D). Considering the reported involvement of PTBP1 in regulating mRNA stability,24 we investigated whether the fusion protein SLC2A11–MIF facilitates PTBP1-mediated stabilization of target gene mRNAs. Interestingly, significant positive correlations were observed between PTBP1 expression and PLK1, ROBO1, and PIK3R3 expression in the TCGA cohort (Figure S6E). Additionally, we demonstrated that knockdown of PTBP1 abrogated the SLC2A11–MIF-mediated upregulation of target gene mRNA and protein expression (Figure 7E,F). Additionally, treatment with actinomycin D facilitated the quantification of preexisting mRNA decay. Our findings demonstrated that knockdown of SLC2A11–MIF decreased the half-lives of the PLK1, ROBO1, and PIK3R3 mRNAs (Figures 7G and S7A). Furthermore, PTBP1 knockdown completely abrogated the SLC2A11–MIF-induced increase in mRNA stability (Figures 7H and S7B). Collectively, these findings suggest that the interaction between SLC2A11–MIF and PTBP1 plays a crucial role in stabilizing the mRNAs of PLK1, ROBO1, and PIK3R3 and significantly contributes to their upregulation.
2.8 SLC2A11–MIF is a product of cis-SAGe and its stability is mediated by NAT10
The SLC2A11–MIF fusion transcript is classified as a readthrough chimeric RNA due to the proximity of adjacent parental genes on the same chromosome.2, 21 Reverse transcription (RT) was performed using a downstream exon primer adjacent to the junction site, followed by RT-PCR with primers covering a fragment of the 5′ gene. We detected signals only in the presence of the avian myeloblastosis virus RT (AMV-RT) enzyme when primer pairs were used to amplify a cDNA fragment spanning exons 8 and intron 8 of SLC2A11, confirming that the precursor RNA was transcribed from exon 8 of SLC2A11 to exon 2 of MIF (Figure 8A,B). CTCF plays a critical role in the binding process to insulator regions situated at or close to gene boundaries. Consequently, it inhibits cis-splicing between two neighboring genes.25, 26 Interestingly, we observed significant upregulation of SLC2A11–MIF expression upon CTCF knockdown (Figure 8C), while the expression of the parental genes SLC2A11 and MIF remained unaltered (Figure S8A). Hence, we can infer that the SLC2A11–MIF chimeric RNA is a product of cis-SAGe.
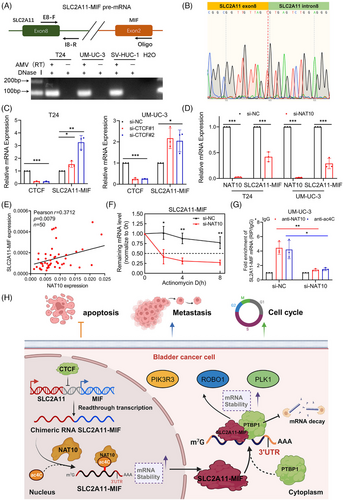
Epi-transcriptomic RNA modifications constitute a critical component of gene regulation that can impact cancer progression and metastasis. We investigated the relationship between SLC2A11–MIF and key RNA modifications derived from various RNA modification datasets. Notably, an online bioinformatics PACES database (http://www.rnanut.net/paces/) was used to predict the presence of a motif for N4-acetylcytidine (ac4C) modification in SLC2A11–MIF (Figure S8B). A previous study demonstrated that NAT10-mediated ac4C modification highly enriches mRNAs, enhances their stability, and promotes translational efficiency.27, 28 Intriguingly, knockdown of NAT10 resulted in a significant decrease in the expression of SLC2A11–MIF mRNA (Figures 8D and S8C), while the expression levels of the parental genes SLC2A11 and MIF remained unchanged (Figure S8D). Moreover, overexpression of NAT10 led to upregulation of SLC2A11–MIF mRNA expression. (Figure S8E,F). Furthermore, a strong positive correlation was observed between NAT10 and SLC2A11–MIF expression in a cohort of BCa patients (Figure 8E). Additionally, our findings suggest that NAT10 plays a role in regulating the stability of SLC2A11–MIF mRNA following actinomycin D treatment (Figures 8F and S8G). Additionally, RNA immunoprecipitation (RIP) demonstrated substantial enrichment of SLC2A11–MIF mRNA through NAT10, which was abrogated upon silencing this protein. Furthermore, acRIP-qPCR assays confirmed the reduced abundance of the ac4C modification on SLC2A11–MIF mRNA upon deletion of NAT10 (Figure 8G). Therefore, we propose that SLC2A11–MIF represents a cis-spliced product derived from adjacent genes and that its stability is regulated by NAT10.
3 DISCUSSION
Chimeric RNAs have been extensively detected in both normal human tissues and tumors.29, 30 Accumulating evidence suggests that chimeric RNAs play crucial roles in the initiation and progression of cancers.20, 31, 32 In previous investigations, ten highly prevalent chimeric RNAs were identified, among which SLC2A11–MIF exhibited a greater frequency of detection in bladder cancer tissues than previously reported gene fusions.2 In this study, we demonstrated that the overexpression of SLC2A11–MIF significantly augments the proliferation and metastasis of BCa cells. Mechanistically, the interaction between SLC2A11–MIF and PTBP1 facilitates mRNA stabilization, thereby enhancing the expression of PLK1, ROBO1, and PIK3R3.
Chimeric RNAs have emerged as valuable biomarkers and promising therapeutic targets across various cancer types.33 Comprehensive analyses were also conducted to identify recurrent chimeric RNAs and explore their clinical implications in colon, cervical, and bladder cancers.2, 21, 22 The fusion of SLC2A11–MIF results in a truncated SLC2A11 protein, which may have implications for the biology of both parental proteins. While SLC2A11 plays a crucial role in glucose absorption and is commonly observed in cancer cells due to its high energy demand,34-36 and MIF is involved in cell proliferation, tumorigenesis, and metastasis across multiple cancers.37-40 In this study, we demonstrated that SLC2A11–MIF promotes proliferation, metastasis, cell cycle progression and resistance to apoptosis in vitro and in vivo. Taken together, these findings contribute to a comprehensive understanding of the multifunctional role of SLC2A11–MIF in tumors for the first time and provide valuable insights for developing novel strategies for the early diagnosis and targeted treatment of BCa.
Chimeric RNAs can exert diverse effects on tumor progression through multifarious mechanisms, including their roles as long noncoding RNAs, fusion proteins and disruption of parental gene expression.1 Dysregulation of parental genes may play a role in tumorigenesis when a parental gene with pro-oncogenic properties is combined with an enhanced promoter or when a fusion occurs between a parental gene that suppresses tumor growth and a sequence targeted by microRNA, as exemplified by TMPRSS2–ERG.7, 19 The fusion protein EWSR1–ATF1 interacts with protein arginine methyltransferase 5 (PRMT5), thereby augmenting gene transcription for the maintenance of cell proliferation in clear cell sarcoma of soft tissue cells.41 In this study, we discovered a direct interaction between the fusion protein SLC2A11–MIF and PTBP1. The subcellular localization of PTBP1 is crucial for its function, as cytoplasmic PTBP1 interacts with target mRNAs to regulate splicing, polyadenylation, mRNA stability, and translation initiation.42-45 A recent study reported that the long noncoding RNA FIRRE acts as a tumor promoter by interacting with PTBP1 to stabilize BECN1 mRNA and facilitate autophagy.24 We observed predominant colocalization of SLC2A11–MIF with PTBP1 in the cytoplasm of BCa cells. SLC2A11–MIF modulates bladder cancer cell proliferation and metastasis through a PTBP1-dependent mechanism. The interaction between SLC2A11–MIF and PTBP1 plays a critical role in stabilizing the mRNAs of target genes.
In our previous study, silencing SLC2A11–MIF resulted in significant upregulation of CDKN1A in both HeLa and CaSki cells.21 Our findings unveil a novel mechanism through which SLC2A11–MIF facilitates PTBP1-mediated stabilization of the PLK1, PIK3R3, and ROBO1 mRNAs, thereby enhancing their expression levels. Importantly, all genes directly targeted by SLC2A11–MIF are implicated in multiple oncogenic events. Among these genes, PLK1 is well known for its role in promoting cell cycle phase transitions.46-49 Additionally, circular RNA_0001495 has been shown to enhance ROBO1 expression and facilitate bladder cancer cell proliferation, migration, and invasion by sponging microRNA-527.50 Furthermore, the overexpression of PIK3R3 has been reported to be an oncogenic mechanism that promotes proliferation, metastasis, and resistance to apoptosis and chemotherapy in specific types of cancer.51-54 Therefore, SLC2A11–MIF serves as an upstream regulator of these oncogenes involved in cell cycle progression, metastasis, and resistance to apoptosis. Targeting SLC2A11–MIF is a promising multipotent therapeutic strategy for impeding the proliferation and metastasis of patients with bladder cancer.
Cis-SAGe is emerging as a promising strategy for generating chimeric fusion RNAs.55 A recent study revealed the induction of downstream gene transcription (DoGs) and their cis-SAGe fusions under osmotic stress.56 A fast, easy, and versatile cell-based reporter system was developed to identify regulators of cis-SAGe.57 CTCF is a specific factor that binds to insulators between neighboring genes and has been demonstrated to impact certain cis-SAGe chimeric RNAs.25, 26 In this study, the expression of SLC2A11–MIF significantly increased upon CTCF knockdown, indicating that cis-SAGe is responsible for generating the SLC2A11–MIF chimeric RNA. However, the regulatory role of posttranscriptional RNA modifications in the expression of chimeric RNAs has not been determined. ac4C modification, catalyzed by NAT10, is widely observed in human mRNAs and helps stabilize mRNAs and enhance translation.27, 58 NAT10 plays a pivotal role in bladder cancer cell lines by influencing proliferation, metastasis, and cisplatin chemoresistance.28, 59 Our study demonstrated that the downregulation of NAT10 results in a decrease in the ac4C modification of SLC2A11–MIF mRNA, thereby compromising its stability and suggesting potential regulatory mechanisms for other chimeric RNAs.
In summary, we present a novel finding that SLC2A11–MIF plays a crucial role in the proliferation and metastasis of BCa through its ability to maintain mRNA stability (Figure 8H). Elucidating the precise involvement of SLC2A11–MIF in BCa progression will not only enhance our understanding of chimeric RNA-mediated metastasis and proliferation but also facilitate the development of innovative therapeutic strategies for treating BCa metastasis.
4 MATERIALS AND METHODS
4.1 Patient tissue samples
This study utilized detection of the chimeric RNA SLC2A11–MIF in bladder cancer, along with normal tissue samples obtained from SYSMH. Sample collection was conducted in accordance with the guidelines outlined in the Declaration of Helsinki, and ethical approval was obtained from the Sun Yat-Sen Memorial Hospital Ethics Committee. A total of 62 postoperative bladder cancer patients diagnosed pathologically and 32 normal tissue samples were selected from the SYSMH cohort for RNA extraction. These samples were collected between January 2010 and February 2023 from patients who underwent radical bladder cancer surgery at our hospital.
4.2 TCGA platform data mining
The TCGA database (https://cancergenome.nih.gov/) was utilized to investigate the clinical characteristics and prognosis of patients with bladder cancer and to evaluate the expression levels of SLC2A11, MIF, PTBP1, PLK1, ROBO1, and PIK3R3. The expression levels and correlation analyses of PTBP1, PLK1, ROBO1, and PIK3R3 were obtained from GEPIA2 (http://gepia2.cancer-pku.cn/#index) for bladder cancer, and Kaplan‒Meier survival analysis of SLC2A11 and MIF in relation to patient prognosis was performed.
4.3 Cell culture
In this study, the human renal embryo cell line HEK-293T and the human bladder cancer cell lines UM-UC-3 and TCCSUP were cultured in complete DMEM. The human bladder cancer cell lines T24 and 5637 were completely cultured with RPMI-1640, and the human urothelial cell line SV-HUC-1 was completely cultured with Ham's F-12K. The cell lines used in this study were obtained from the American Type Culture Collection (ATCC, Manassas, Virginia, USA). All cells were cultured according to established protocols.60 The cell lines were subjected to short tandem repeat analysis (IGE Biotechnology, Guangzhou, Guangdong, China) to ensure their authenticity and were confirmed to be free of mycoplasma contamination as well as cross-contamination with other cell lines.
4.4 RNA interference
The siRNA oligonucleotide sequences used in this study were designed and synthesized by Gene Pharma (Shanghai, China). The knockdown efficiency of each siRNA on the target gene was verified through qPCR and Western blotting. The sequences of the siRNAs used in this study are shown in Table S1. Briefly, 200 µL of Opti-MEM was added to a 1.5 mL EP tube, followed by the addition of 3 µL of Lipofectamine® RNAiMAX Reagent (Invitrogen, Carlsbad, California, USA), and 5 µL of siRNA was thoroughly mixed before incubation at 37°C overnight. Subsequently, the mixture was cultivated for an additional 24–48 h prior to subsequent experiments.61
4.5 IHC analysis
In this study, immunohistochemical staining was performed on the subcutaneous tumor tissue of mice and the foot pad tumor tissue of a mouse model with popliteal lymph node metastasis. IHC analysis was performed in accordance with a previously established protocol.62 The tissue scores were independently determined by two professional pathologists who were blinded to patient information. In cases where there was a significant disparity in the score results for the same tissue, rescoring was conducted until a consensus was reached. The specific scoring method employed was as follows: First, all sections were examined for staining intensity and categorized into four levels. The percentage of positively stained tumor cells was scored as follows: 0 (no positive staining), 1 (≤10% positive), 2 (>10% to ≤30% positive), 3 (>30% to ≤70% positive), or 4 (>70% positive). The staining intensity was graded as follows: 1 (no staining), 2 (weak staining, light yellow), 3 (moderate staining, brown), or 4 (strong staining, brown red). The staining index (SI) was calculated by multiplying the proportion of positively stained tumor cells by the corresponding intensity score for a range of possible scores, which included 0, 1, 2, 3, 4, 6, 8, 9, 12, and 16.
4.6 RNA isolation and qPCR
RNA isolation and qRT-PCR were conducted according to previously established protocols.63 In this study, TRIzol (Vazyme, Nanjing, Jiangsu, China) was used for the extraction of cellular RNA. The RT procedure was conducted following the instructions provided in the HiScript III RT SuperMix for qPCR manual (Vazyme). Quantitative PCR analysis was performed using ChamQ Universal SYBR qPCR Master Mix (Vazyme) on a LightCycler 384 System (Roche). Relative mRNA expression levels of different genes were calculated by the 2−ΔΔCt method with GAPDH as an internal reference. The sequences of primers used for analysis are presented in Table S2.
4.7 Western blotting
The Western blotting experiments were performed in accordance with previously established protocols.60 The cell samples were lysed using RIPA lysis buffer (Beyotime, Shanghai, China) containing protease inhibitors and phosphatase inhibitors (CWBIO, Beijing, China) for 30 min. The protein concentration was determined using the Pierce BCA Protein Assay Kit (Invitrogen, Carlsbad, California, USA). Following SDS‒PAGE, the proteins were transferred to PVDF membranes (Merck, Burlington, Massachusetts, USA) by electrophoretic transfer. The membranes were incubated with primary antibodies overnight at 4°C. Subsequently, the membranes were incubated with an HRP-conjugated secondary antibody for 1 h, and the signals were detected using a Sage high-sensitivity chemiluminescence detector with a supersensitive luminescent solution. Primary antibodies are listed in Table S3.
4.8 Cell proliferation assays
Cell proliferation assays included CCK-8 and colony formation assays in accordance with previously established protocols.64 The incubation with CCK-8 (APExBIO, USA) for 2 h was assessed by quantifying the optical density (OD) at a wavelength of 450 nm.
4.9 Flow cytometry analysis
An Annexin V-FITC/PI Apoptosis Detection Kit (A211-01; Vazyme) was used to detect cell apoptosis. Additionally, the Cell Cycle Detection Kit (KGA512; KeyGEN, Jiangsu, China) was utilized to assess the distribution of different cell cycle stages during cellular growth according to the respective protocols. The cell cycle distribution was assessed using flow cytometry (BD Biosciences, San Jose, California, USA) with propidium iodide (PI) labeling. Additionally, FITC-annexin V and PI staining were employed for the apoptosis assay.
4.10 Wound healing, migration, and invasion assays
Wound healing, migration, and invasion assays were conducted in accordance with our previous study.65
For wound healing assays, once the bladder cancer cells had completely covered the single hole of the six-well plate, a sterile pipette tip was used to create a uniform horizontal mark at the center of the hole. Subsequently, the floating cells were washed away using PBS and maintained in serum-free medium. The wound healing widths were measured at 0 and 16 h for T24 cells and UM-UC-3 cells, depending on their motility. The relative migratory ability of the treated cells was assessed based on the recorded wound healing width.
For migration assays, 8 × 10⁴ BCa cells were seeded onto the upper layer of a Transwell plate with a pore size of 8 µm, while the lower chamber was filled with 700 µL of complete medium. The incubation period for the T24 cells was 7.5 h, whereas the UM-UC-3 cells were incubated for 20 h. Following fixation with 4% paraformaldehyde, crystal violet staining was performed, and subsequent quantification was conducted.
For invasion assays, the upper chamber of a Transwell plate with an 8 µm pore size was coated with Matrigel (Corning, Bedford, Massachusetts, USA) and allowed to solidify. Subsequently, 8 × 10⁴ BCa cells were seeded onto the upper layer of the Transwell plate, while the lower chamber was filled with complete medium. T24 cells were incubated for 10 h, whereas UM-UC-3 cells were incubated for 24 h. After fixation with 4% paraformaldehyde, crystal violet staining was performed, followed by quantification.
4.11 Tumor xenograft model
All animal studies were ethically approved by the Institutional Animal Care and Use Committee of Sun Yat-Sen University. Male BALB/c nude mice (4–5 weeks old) were procured from the Experimental Animal Center of Sun Yat-Sen University and housed in specific pathogen-free barrier facilities. A total of 3 × 10⁶ UM-UC-3 cells were subcutaneously injected beneath the right scapula of nude mice. The injection site was monitored daily postinjection, and the size of the subcutaneous tumor was measured and recorded every 3 days. The experimental endpoint criteria were met by employing humane euthanasia followed by cervical dislocation to sacrifice the mice. Subsequently, the dissected subcutaneous tumors were photographed, measured, weighed, and fixed with 4% paraformaldehyde. After fixation, paraffin embedding was performed, and the largest section was selected for further processing. Histological analysis, including H&E staining, Ki67 immunostaining, and TUNEL assays, was conducted on these sections.
4.12 In vivo popliteal LN metastasis assays
UM-UC-3 cells transfected with firefly luciferase (3 × 10⁶ cells) were injected into the left foot pads of the mice. Once tumor formation was observed in situ, in vivo imaging analysis of the nude mice was performed every 7 days using a PerkinElmer IVIS Spectrum Imaging System. The experimental endpoints were determined based on the in vivo imaging results and ethical considerations. Euthanasia was conducted by cervical dislocation. The foot pad tumor and popliteal fossa lymph nodes were dissected for analysis, measurement, fixation with paraformaldehyde, embedding in paraffin wax, and sectioning to obtain the largest slice, followed by H&E staining and IHC. Survival curves and transfer rates in the mice were calculated.
4.13 TUNEL assay
The TUNEL assay was performed using a TUNEL FITC Apoptosis Detection Kit (A111-01; Vazyme) following a previously established protocol.66
4.14 Lentivirus transduction
The pLKO.1-Puro vector was utilized to clone and insert two short hairpin RNA (shRNA) sequences specifically targeting SLC2A11–MIF, while the pCDH–CMV–MCS–EF1–Puro vector was used for cloning and insertion of the ORF of SLC2A11–MIF. Both vectors were obtained from IGE (Guangzhou, Guangdong, China). Table S1 provides a comprehensive list of all shRNA sequences used in this study. Lentivirus production and infection were conducted following established protocols.49
4.15 RNA sequencing analysis
The cells were transfected with si-SLC2A11–MIF or control siRNA for 48 h. Subsequently, total RNA was extracted from the cells using TRIzol (Vazyme) and subjected to RNA-Seq analysis. The sequencing library was constructed and sequenced by IGE Biotechnology (Guangzhou, China). All primary data in the RNA-seq analysis were uploaded to Gene Expression Omnibus (GEO: GSE271133, https://www.ncbi.nlm.nih.gov/geo/query/acc.cgi?acc=GSE271133).
4.16 Coimmunoprecipitation
A Pierce Crosslink Magnetic Co-IP Kit (Thermo Scientific, USA) was used for Co-IP following the manufacturer's instructions and our previous study.60 Briefly, lysed cells were incubated in IP lysis buffer containing a protease inhibitor mixture. Subsequently, they were incubated with anti-FLAG, anti-PTBP1, or IgG antibodies. Antibodies for Co-IP (as listed in Table S3) and cell lysates were rotated at 4°C overnight. A&G magnetic beads were then added and rotated for 2 h. The resulting bead-protein complexes were washed three times and boiled for 10 min at 95°C before Western blot analysis. MS analysis was conducted by the Bioinformatics and Omics Center of Sun Yat-Sen Memorial Hospital.
4.17 Immunofluorescence staining
Immunofluorescence staining was performed according to established protocols.28 The cells were fixed using a 4% paraformaldehyde solution, followed by permeabilization with 0.2% Triton X-100. Subsequently, the membranes were incubated with the primary antibody overnight at 4°C and then blocked with a BSA solution. Finally, the cells were incubated with the secondary antibody and DAPI before the images were captured.
4.18 Detection of precursor readthrough mRNA
DNase-I was applied to eliminate potential DNA contamination in RNA isolated from the bladder cancer cell lines T24 and UM-UC-3 and the normal uroepithelial cell line SV-HUC1. RT was performed using reverse primer annealing to the downstream exon neighboring the junction site, followed by RT-PCR with primers covering a fragment of the 5′ gene. Complete digestion by DNase-I was confirmed through the absence of a signal without AMV-RT reverse transcriptase.
4.19 Detection of full-length SLC2A11–MIF
Initially, we trimmed the junction to 14 base pairs on both sides and included the reverse complements. Subsequently, using AGREP, we conducted a comprehensive search for matches of each sequence (allowing 0 or 2 errors) in all the ENCODE samples. The matched reads were subsequently subjected to BLAT and a blat filter called reps for optimal alignment identification with the genome. Finally, we compared the alignment coordinates to a significantly large (∼300 kb) region surrounding the predicted locus of the chimeric RNA.
4.20 Statistics
The quantitative data are presented as the mean ± standard deviation (SD) of three independent experiments. Statistical analysis was performed using SPSS 19.0 software, and differences between two groups were assessed using unpaired/paired Student's t-tests (two-tailed tests). For comparisons involving more than two groups, one-way ANOVA followed by Dunnett's multiple comparisons test was used. Clinical variables were analyzed using Pearson's chi-square test, while Spearman's correlation analysis was used to determine the relationship between two variables. A p value less than 0.05 was considered to indicate statistical significance.
AUTHOR CONTRIBUTIONS
X. C., H. L., and J. H. designed the study. L. C., C. W. Y., and J. L. L. conducted the main experiments and performed the data analysis. M. H. and R. H. X. analyzed the clinical characteristics. Sarah L. and J. E. performed the bioinformatic analysis. Sen L., Y. H. H., and S. T. C. conducted the in vitro and in vivo functional experiments. B. Q. H. and T. X. L. conducted the statistical analyses. X. C., H. L., and J. H. wrote and reviewed the manuscript. All the authors read and approved the final manuscript. The order of authorship among co-first authors was determined based on their relative contributions.
ACKNOWLEDGMENTS
We sincerely thank Prof. Xiaojuan Wang from the Bioinformatics and Omics Center in Sun Yat-Sen Memorial Hospital for assisting with the mass spectrometry analysis. This study was supported by the National Natural Science Foundation of China (grant number 81961128027, 82322056, 82173230, 82072827), NCI (R01CA245905), the Guangdong Basic and Applied Basic Research Foundation (grant number 2021B1515020009), the Science and Technology Program of Guangzhou (grant number 2023A03J0718, 2024B03J1234, 2024A04J6558), and the Guangdong Provincial Clinical Research Center for Urological Diseases (2020B1111170006).
CONFLICT OF INTEREST STATEMENT
The authors declare no conflict of interest.
ETHICS STATEMENT
The ethical consent of this study was obtained from Sun Yat-Sen Memorial Hospital Committees for Ethical Review of Research involving Human Subjects (SYSKY-2022-392-0). All human tissue samples were obtained from patients who provided written informed consent. Ethical approval for this study was granted by the Sun Yat-Sen University Committees for Ethical Review of Research Involving Animal Experiments (SYSU-IACUC-2021-000399).
Open Research
DATA AVAILABILITY STATEMENT
The descriptions of data mining in the TCGA study are provided in Materials and Methods section. The raw RNA-seq data can be obtained from the GEO database (GSE271133, https://www.ncbi.nlm.nih.gov/geo/query/acc.cgi?acc=GSE271133).


