3D Printing of Customized Carbon Microneedle Arrays
Ya Ren and Li Zhang contributed equally to this article.
ABSTRACT
Microneedles have gained considerable attention as an emerging technology in tissue regeneration, drug delivery, and biosensing due to their minimally invasive nature and efficient therapeutic potential. Carbon, with its superior properties compared to polymers, ceramics, and metals, is an excellent candidate for microneedle fabrication. However, conventional carbon material fabrication methods often lead to defects such as structural deformation, cracking, and foaming, which hinder the development of high-performance carbon microneedle arrays. To address these challenges, this study presents a precise, efficient, and cost-effective manufacturing strategy that integrates 3D printing with pyrolysis. By designing a polymer precursor with a uniform mesh structure, we successfully developed structurally intact microneedles with significantly improved overall performance. The fabricated carbon microneedles demonstrated reliable mechanical strength, high electrical conductivity, favorable photothermal properties, and excellent biocompatibility. These characteristics suggest broad potential applications in various fields. Furthermore, this study provides valuable insights into the development of carbon microneedle fabrication, offering a viable pathway for large-scale production and clinical translation. This work lays the foundation for advancing the technology and product development of carbon microneedle arrays while expanding their practical applications across the biomedical and healthcare sectors.
1 Introduction
Microneedle technology has emerged as a versatile tool in biomedical applications, including tissue regeneration, drug delivery, and biosensing, attracting significant research interest in recent years [1-3]. As microneedles come into direct contact with tissues, the selected materials need to possess excellent biocompatibility and safety to avoid allergic reactions, inflammation, or other adverse effects, which requires the materials to remain stable in vivo without causing tissue damage [4].
Beyond biocompatibility, the mechanical properties of microneedles play a critical role in their functionality. Microneedles should possess good mechanical properties, including sufficient strength, hardness, and toughness, to ensure they do not break or bend easily during penetration [5]. They also need adequate durability to accommodate different application scenarios, such as long-term monitoring and drug delivery. Moreover, depending on their intended application—whether for long-term biosensing or drug delivery—microneedles require adequate durability to maintain consistent performance over time. While selecting high-performance materials can enhance mechanical and functional properties, it often leads to increased production costs, limiting large-scale commercialization. Thus, in the development of microneedle technology, it is crucial to improve material performances and reduce costs to ensure the usability of microneedle products and drive the widespread application of microneedle technology.
Carbon materials have gained considerable attention as promising candidates for microneedle fabrication due to their unique combination of properties, including high conductivity, superior mechanical properties, exceptional chemical stability, and excellent biocompatibility. Unlike traditional polymer- or metal-based microneedles, carbon microneedles offer enhanced durability and are environmentally friendly, making them ideal for biomedical and energy-related applications [6, 7]. Furthermore, carbon materials undergo significant volume shrinkage during pyrolysis, often exceeding 80%, which enables the fabrication of highly precise structures with nanoscale features [8]. These properties suggest that carbon microneedles could outperform conventional microneedles in various applications [9, 10].
Nevertheless, the preparation of carbon has significant technical challenges, acting as a key bottleneck limiting its development and application. Currently, the pyrolysis stage, which converts polymer precursors into carbon, often results in structural deformation, uneven microstructures, and microscopic defects, limiting reproducibility and scalability. These issues pose significant obstacles to achieving uniform, high-performance carbon microneedle arrays for biomedical applications [11, 12]. Moreover, batch production with high consistency remains difficult due to variations in thermal processing and material shrinkage. Addressing these challenges requires innovations in both structural design and pyrolysis control to ensure high precision and reproducibility.
In this study, we developed an advanced fabrication strategy to fabricate carbon microneedle arrays based on static optical projection lithography (SOPL) technology from our previous study. SOPL technology enables high-speed manufacturing, allowing for batch production in just seconds while offering precise structural control and eliminating the stair-like stripe associated with layered fabrication methods [13]. To enhance structural stability and minimize deformation during pyrolysis, we designed polymer precursors with uniform mesh structures. Additionally, we created a tailored pyrolysis program based on the polymer's properties and continuously refined the process. Taken together, we successfully fabricated high-performance carbon microneedle arrays with superior mechanical properties, high conductivity, excellent biocompatibility, and enhanced photothermal properties. This study provides a scalable and efficient approach for producing carbon microneedle arrays, laying the groundwork for their broader applications in biomedicine, diagnostics, and therapeutic interventions.
2 Results
2.1 Design and Preparation of Carbon Microneedle Arrays
The pyrolytic carbonization of polymer precursors was a gradual process involving gas release and bulk shrinkage. During this process, smooth gas release ensured internal densification of the material, thereby preventing defects such as foaming and significantly enhancing performance. Proportional shrinkage of the precursor was the prerequisite for achieving customized product fabrication [14]. Therefore, we focused on customizing the polymer precursor structures and the pyrolysis temperature profile to address common defects, such as foaming and abnormal deformation, that occurred during the fabrication of carbon microneedle arrays. This approach aimed to improve the quality and performance of carbon microneedle arrays, providing valuable insights for their further applications across various fields.
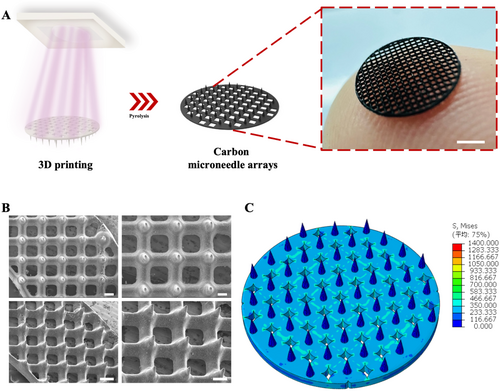
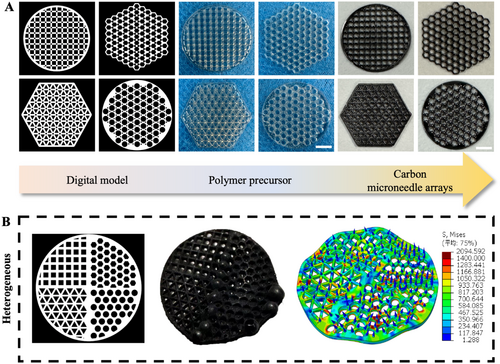
In terms of structural design, a higher degree of hollowing, which increased surface area, facilitated gas release and avoided foaming during pyrolysis [15]. Therefore, a mesh structure was designed to effectively promote gas release. Addressing the issue of stress concentration was also crucial. Stress concentration referred to the heterogeneously localized intensification of stress in areas where there were abrupt geometric changes, such as sharp angles, holes, or notches. The severity of stress concentration was influenced by factors such as the distribution, magnitude, and direction of applied loads. Once stress concentration occurred, it could lead to defects like foaming, cracking, and deformation in the affected regions. Based on the principles above, high-performance carbon microneedle arrays were successfully fabricated, as shown in Figure 1A,B. At the same time, we conducted finite element analysis (FEA) on the microneedle mesh structure. As shown in Figure 1C, when a 5% strain was applied around the base, the von Mises stress contour was normalized to a uniform solid under load, indicating that the stress was evenly distributed through the mesh structure, which resulted in a uniform stress distribution in all directions across the entire mesh with reduced stress concentration. The results suggested that designing smooth, uniform, and isotropic hollowed substrate structures was an effective solution. We tested different precursor shapes, and the hollowing units could be selected from tessellating geometric shapes such as equilateral triangles, squares, or regular hexagons. On the contrary, the heterogeneous structures led to obvious deformation due to stress concentration (Figure 2A,B). Notably, microneedles fabricated using SOPL technology did not exhibit the layer striations that are commonly found in conventionally 3D-printed microneedles [16, 17]. Instead, they possessed smooth and homogeneous internal and surface structures, which effectively reduced defect formation.
In designing the pyrolysis process, based on the thermogravimetric analysis (TGA) and derivative thermogravimetry (DTG) of various polymer materials, the process was divided into three main stages: relieving internal stresses, pyrolytic weight loss and shrinkage, and high-level carbonization. By controlling the temperature and duration of these key stages under an inert atmosphere, we minimized the occurrence of defects in the carbon microneedle arrays and enhanced their overall performance. Through repeated adjustments, we established reliable pyrolysis procedures.
2.2 Characterization of Carbon Materials
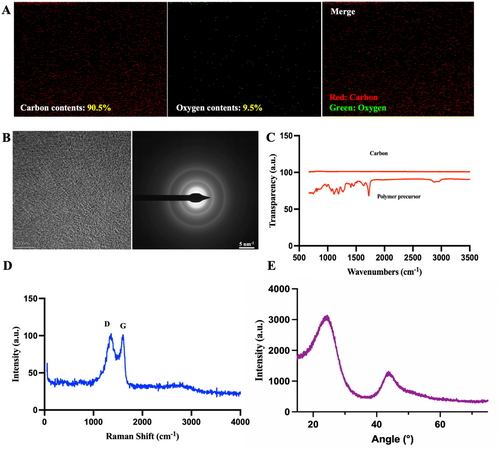
Through energy dispersive spectrometer (EDS) analysis, the carbon content of samples was found to exceed 90%, indicating that the surface pyrolysis process resulted in thorough carbonization (Figure 3A). The carbon material was analyzed using transmission electron microscopy (TEM) in selected area electron diffraction (SAED) mode. The TEM images revealed a homogeneous structure and disordered atomic arrangements with no visible crystalline features. The SAED pattern exhibited diffuse ring-like structures, indicating the amorphous nature of the sample, these results align with previously reported data on carbon, affirming that the tested sample is indeed carbon [18] (Figure 3B). Fourier-transform infrared spectroscopy (FTIR) revealed the absence of any peaks, indicating that the polymer precursor was fully carbonized (Figure 3C). We further investigated the microstructure of the carbon microneedle arrays using Raman spectroscopy and X-ray diffraction (XRD). Raman spectroscopy provided information about the microstructure of carbon, such as the degree of ordering and crystallinity. Internal defects in amorphous carbon and graphitic crystalline structures appeared at the G band, centered at 1580 cm⁻¹ and the D band, centered at 1360 cm⁻¹, respectively. As shown in Figure 3D, the Raman spectroscopy of the carbon microneedle displayed characteristic G and D bands, confirming the successful conversion of the polymer to carbon. The width and intensity of the D band were attributed to the formation of disordered carbon structures within the carbon. Additionally, the broad 2D band at approximately 2700 cm⁻¹ indicated the presence of highly disordered and randomly arranged graphene layers. The XRD results, shown in Figure 3E, exhibited broad peaks at approximately 23.5° and 43.5°, corresponding to the (002) and (110) reflections of carbon materials. The interlayer spacing of ordered graphite was 3.354 Å, while the value for the carbon microneedle, estimated from the (002) peak, was approximately 3.8 Å. These results were consistent with other studies on carbon.
2.3 Evaluation of Mechanical Properties and Conductivity
The carbon microneedle arrays needed to have sufficient mechanical strength to maintain their integrity during use. During the compression test, the microneedles initially remained intact but eventually experienced gradual breakage. The force–displacement curve showed an almost linear relationship between displacement and force at the beginning. Subsequently, as the microneedles fractured, the curve fluctuated abruptly, with a fracture force of approximately 5.8 N (as shown in Figure 4A), which significantly exceeded that of conventional microneedles [19].
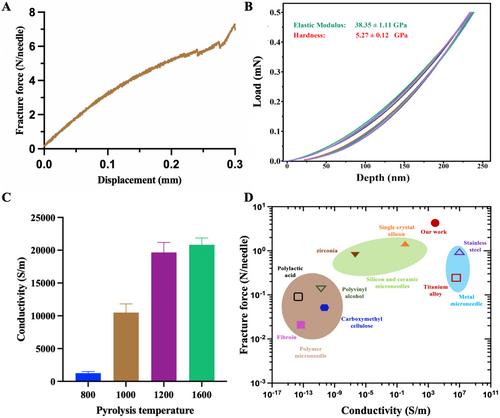
At the same time, we conducted nanoindentation testing to evaluate the hardness of the carbon microneedle arrays. The hardness was measured to be 5.27 GPa, and the Young's modulus was found to be 38.35 GPa (Figure 4B), indicating that the carbon microneedle arrays possessed high resistance to deformation. In the context of microneedles, higher hardness was significant for applications involving skin penetration, especially in drug delivery or biosensing, where the microneedles needed to pierce biological tissues without breaking or bending. Comparatively, with a hardness of 5.27 GPa, the carbon microneedle arrays significantly surpass that of polymer and metal microneedles and is comparable to that of ceramic microneedles [20]. In addition, Young's modulus reflected the stiffness of a material; it needed to balance between being rigid enough to penetrate skin or tissue and flexible enough to withstand bending forces during use. For reference, biocompatible polymers like polylactic acid and polyglycolic acid had much lower Young's modulus values [21], while common silicon-based microneedles showed values around 10–30 GPa [22]. The 38.35 GPa stiffness of the carbon microneedle arrays made them more suitable for high-load applications, particularly where bending and breaking were required to be minimized. The mechanical properties of carbon microneedle arrays gave them a strong position in the microneedle field, especially for applications requiring both mechanical durability and biocompatibility. Their utility in drug delivery, tissue regeneration, and biosensing made them a promising material for future advancements.
Subsequently, the conductivity of the carbon microneedle arrays was measured using the four-point probe method and calculated to be 20,000 S/m (Figure 4C). This conductivity value made carbon a highly promising material for applications requiring moderate electrical performance, along with biocompatibility and mechanical durability. Its potential use in biosensing, electrostimulation, drug delivery, and wearable health devices made it an attractive option in the growing field of microneedle technologies [23].
The Ashby plot shows the material property space of fracture force in relation to conductivity for all reported microneedle materials composed of silicon, ceramics, metals, and polymers, compared to the carbon microneedle in this work. As shown in Figure 4D, compared to existing metal microneedles, carbon microneedle arrays exhibit significantly higher fracture strength while maintaining good conductivity [24, 25]. For polymer microneedles, carbon microneedle arrays surpass them by more than an order of magnitude in both aspects [26-28]. Although ceramic and silicon microneedles possess better fracture force, their conductivity lags far behind that of carbon microneedle arrays [29]. In summary, our work has developed a microneedle that combines excellent mechanical properties and electrical conductivity, offering significant potential for applications in biosensing, drug delivery, and tissue regeneration.
2.4 Investigation of Photothermal Properties
The photothermal performance of the carbon microneedle arrays was evaluated using an infrared thermometer and an infrared light source (Figure 5A,B). The carbon microneedle arrays were irradiated under near-infrared light at various intensities, and their surface temperature was monitored in real time. The results demonstrated that the microneedles exhibited significant photothermal effects, with a rapid increase in temperature upon exposure to infrared light. The temperature stabilized at elevated levels, depending on the intensity of the light source.
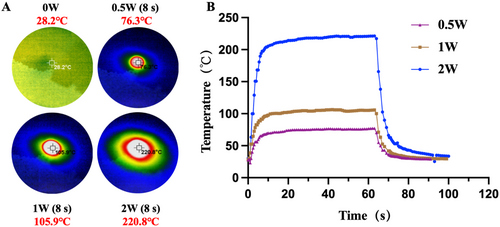
At a 1 W intensity, the surface temperature of the carbon microneedle arrays increased by approximately 100°C within the first few seconds of exposure, eventually stabilizing at 105.9°C. When the light intensity was increased, a corresponding rise in temperature was observed, indicating a direct relationship between light intensity and the photothermal response of the material. The results confirmed that the carbon microneedle arrays possessed excellent photothermal properties, with efficient light-to-heat conversion, making them suitable for potential applications in photothermal therapy and light-responsive drug delivery systems [30].
2.5 In Vitro Cytotoxicity Assessment
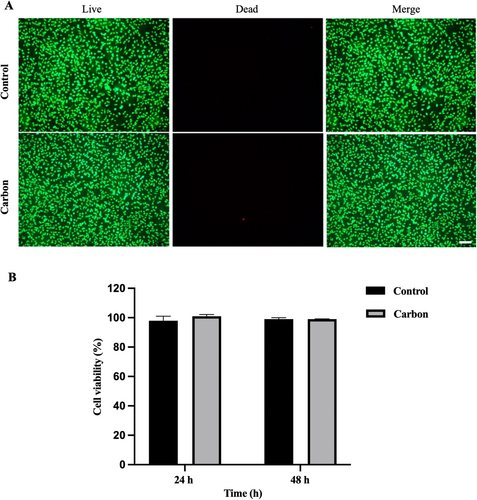
Carbon materials are well known for their excellent biocompatibility and are widely used in the medical field. The RGF of L929 cells in contact with the carbon microneedle extraction solution was over 90% at both 24 and 48 h, indicating excellent cytocompatibility (Figure 6A,B). There was no significant difference in cell viability between the sample group and the control group treated with standard DMEM culture medium. These findings confirmed that the carbon microneedle arrays did not exhibit cytotoxic effects on L929 cells, with consistent cell proliferation throughout the experiment. Additionally, live/dead staining was performed to further assess the cell morphology and viability in contact with the microneedle extraction solution. Fluorescence microscopy images revealed a predominance of live cells, as indicated by strong green fluorescence from calcein-AM staining, with only few red-stained dead cells observed. The results confirmed that the majority of cells remained viable after 24 h of exposure to the microneedle extraction solution. The combination of high cell viability in the Cell Counting Kit-8 (CCK-8) assay and minimal cell death in live/dead staining indicated that the carbon microneedle arrays possessed excellent cytocompatibility. Our findings suggested that the carbon microneedle arrays were safe for potential biomedical applications involving direct contact with cells, such as transdermal drug delivery, tissue engineering, and wound healing, which showed that carbon microneedle arrays had minimal cytotoxicity and held great potential for biocompatible applications.
3 Discussion
The production of carbon microneedle arrays is often hindered by challenges such as structural deformation, cracking, and foaming during the fabrication process. These defects limit the reliability and consistency of the microneedles, hindering their broader applications.
This study successfully addresses these challenges by employing a customized uniform mesh structure and pyrolysis program for the polymer precursor, which mitigates issues related to stress concentration and gas-induced foaming. The design of these hollow mesh structures was further validated by FEA, which demonstrated a uniform stress distribution that contributed to minimizing deformation and defect formation. This approach yielded microneedles with high performance, demonstrating significant advancements over conventional methods prone to layer striation and surface irregularities.
The mechanical properties of the fabricated carbon microneedle arrays were notably superior. With a fracture force of 5.8 N, hardness of 5.27 GPa, and Young's modulus of 38.35 GPa, these microneedles exhibited robust performance under high-load applications such as drug delivery and biosensing. The conductivity of 20,000 S/m outperformed many polymeric and ceramic microneedles, and Ashby plot analysis confirmed the balance between strength and conductivity, making them suitable for multifunctional biomedical devices. Additionally, photothermal experiments demonstrated stable and rapid heating under near-infrared irradiation, indicating their potential for photothermal therapy and light-triggered drug release. Cytotoxicity tests showed excellent biocompatibility, with high cell viability and minimal cytotoxic effects, affirming their safety for applications in medicine.
Despite these promising advancements, there are several limitations to the current study that should be acknowledged. While cytotoxicity tests confirmed the biocompatibility of these carbon microneedles, in vivo studies are necessary to fully assess their long-term stability, potential for tissue interaction, and overall therapeutic efficacy in clinical settings. The translation from in vitro to in vivo models may present additional challenges. As such, future studies should prioritize comprehensive animal model testing to validate these properties in more complex biological environments. Additionally, research should focus on designing application-specific structures and parameters, ensuring these evolve into mature components, and enabling large-scale production.
This study successfully establishes a robust and scalable methodology for fabricating carbon microneedle arrays with exceptional mechanical, electrical, photothermal, and biocompatible properties. These advancements address critical limitations in existing microneedle technologies and significantly enhance their potential for applications in tissue engineering, drug delivery, and biosensing. This study provides a solid foundation for the integration of carbon microneedle arrays into next-generation biomedical devices, with promising implications for translational research and commercialization.
4 Conclusion
In this study, we demonstrated the fabrication of high-performance carbon microneedle arrays by customizing uniform mesh structures of the polymer precursors, effectively minimizing shape deformation and defect formation. The obtained carbon microneedle arrays exhibited excellent mechanical, electrical, photothermal, and biocompatible properties, making them well-suited for a wide range of applications, such as transdermal drug delivery, tissue regeneration, and biosensing.
5 Methods
5.1 Design and Preparation of Carbon Microneedle Arrays
The carbon microneedle arrays were fabricated using DLP-based SOPL technology that was developed by our group previously [13]. According to the requirements, we created a digital model of the microneedle precursor and a geometric design based on a uniform mesh-like substrate, with microneedle structures arranged on the mesh. The density of the microneedles could be adjusted as needed. Additionally, the precursor dimensions were reverse-calculated based on the shrinkage ratio (e.g., polyurethane acrylate, with approximately 43% shrinkage in one dimension). Then, it was imported into the printer, where the digital micromirror device (DMD) modulated a 405 nm light beam into a patterned light according to digital model. The precursor was formed in 5 s, following by exposure to UV light for 30 s for post-curing.
A tailored pyrolysis process was established based on the TGA and DTG curve of the material (Figure S1A), with specific heat-preservation treatments during the stages of significant weight loss. In the final heating stage, the temperature was raised to 1000°C to complete the pyrolytic carbonization of the polymer precursor (e.g., polyurethane acrylate). The morphology of the carbon microneedle arrays was observed using digital camera, microscope, and scanning electron microscope (SEM, JSM-7500F).
Then, FEA was performed using ABAQUS (Dassault Systèmes SE) software. The total number of the elements was 100,567, and the number of the nodes was 117,725. The material was set as an elastic-plastic material with a density of 1.3 g/cm³, a Young's modulus of 8 GPa, and a Poisson's ratio of 0.45. The open-source EasyPBC tool (40) was used to apply uniform strain to the mesh structure and to further maintain computational uniform periodicity by applying the required constraint equations and displacement boundary conditions.
Carbon microneedle arrays with customized designs (circular, triangular, rectangular, and hexagonal) were fabricated based on uniform mesh structures. Subsequently, a heterogeneous structure was designed (Figure S1B), and the stress distribution was analyzed through FEA.
5.2 Characterization of Carbon Materials
EDS of the carbon microneedle arrays was conducted using field emission scanning electron microscopy (FESEM; FEI Quanta FEG450). TEM (JEOL JEM 2100) was used to detect the presence of graphene sheets and fullerene-like spheroidal curled graphene structures formed during carbonization. TEM samples were prepared using a focused ion beam (FIB; FEI Scios DualBeam). Then, in SAED mode, an appropriate beam spot size and area were selected, ensuring that the diffraction points covered a representative region of the sample. By observing the shape and spacing of the diffraction rings, the crystalline structure of the sample was determined. FTIR was performed to identify the presence of functional groups in the fabricated carbon microneedle arrays. Additionally, Raman spectroscopy (Renishaw RM-2000) and XRD were conducted to further analyze the microstructure of the carbon atoms in the samples.
5.3 Evaluation of Mechanical Properties and Conductivity
The mechanical properties of the carbon microneedle arrays were assessed using a Texture Analyzer (TA.XTC-18, Bosin Tech). Each microneedle was positioned vertically on the test platform, and a metal probe was carefully aligned to touch the tip. The probe was programmed to move downward at a constant speed of 0.02 mm/s. TA software recorded the relationship between compression displacement and force. The data were analyzed using Prism 10.0 (GraphPad Software), identifying the fracture force as the point where the force–displacement curve showed a significant deviation from linearity, indicating failure.
Nanoindentation test was employed to evaluate the hardness and Young's modulus of the carbon microneedle arrays. Before testing, the samples were securely mounted on the sample stage of the nanoindenter to ensure stability. The nanoindenter, equipped with a high-precision diamond indenter, applied a gradually increasing load in force-controlled mode, recording the load–depth curves. Multiple indentation tests were conducted at different locations on the microneedle tips and sidewalls, ensuring accurate measurement of mechanical properties at the micro- to nanoscale. The hardness and elastic modulus of the carbon microneedle arrays were subsequently calculated. Throughout the testing process, the environmental temperature and humidity were controlled to minimize the influence of external factors on the results.
The conductivity of carbon pyrolyzed with maximum temperatures of 800°C, 1000°C, 1200°C, and 1600°C was measured using a four-point probe instrument. First, regular-sized carbon blocks were prepared, ensuring that the surface was flat and cleaned to remove impurities. The sample was then placed on the sample stage of the four-point probe system, with four equally spaced probes making perpendicular contact with the sample surface. The outer two probes supplied the current, while the inner two probes measured the voltage. During testing, the current applied by the outer probes was gradually adjusted, and the corresponding voltage changes were recorded. The resistivity of the sample was calculated using the linear relationship between the measured current and voltage, following the four-point probe method formula. The experiment was conducted at a constant temperature, with multiple measurements taken at different locations on the sample, and the average value was used as the final conductivity data.
To construct an Ashby plot of fracture force and conductivity for microneedle made from various materials, we collected data from the previous research on materials commonly used in microneedle fabrication, including metals, polymers, ceramics, and silicon. Fracture force and conductivity values were extracted from experimental studies to ensure comparability. The data were then plotted using analysis software, with fracture force on the vertical axis and conductivity on the horizontal axis. This Ashby plot visualizes the trade-offs between mechanical strength and electrical properties to guide microneedle material selection and design optimization.
5.4 Investigation of Photothermal Properties
To investigate the photothermal effect of the carbon microneedle arrays, an experiment was employed with an infrared thermometer and an infrared light source. The carbon microneedle samples were first secured on a thermally insulated platform to minimize environmental heat interference. The infrared light source with appropriate wavelength (e.g., in the near-infrared range) and intensity was used to irradiate the microneedles to ensure uniform illumination across the sample surface. An infrared thermometer was used to monitor the surface temperature of the microneedles in real time, recording both the temperature rise and stabilization over time. The experiment was performed in a temperature-controlled environment to avoid external temperature fluctuations. The power of the light source was gradually adjusted to generate temperature response curves under different light intensities (0.5, 1, and 2 W). The experiment was repeated multiple times to ensure data reproducibility. Afterward, the temperature changes under varying light intensities were compared to assess carbon microneedle arrays potential for photothermal applications.
5.5 In Vitro Cytotoxicity Assessment
5.6 Statistical Analysis
All the statistical analyses were performed using GraphPad Prism 8, each experiment was performed at least three times.
Author Contributions
Maling Gou, Ya Ren, and Li Zhang contributed to the experimental design. Ya Ren, Li Zhang, Angxi Zhou, Donglin Ma, Haofan Liu, Run Tian, and Chunli Yang performed experiments. Ya Ren and Li Zhang prepared the manuscript. Maling Gou supervised the project. Donglin Ma performed the data curation and methodology. All authors contributed to the discussion and analysis of the data. All authors read and approved the final manuscript.
Acknowledgments
We thank Boya. Li for the writing and language. We thank H. Wang from the Analytical and Testing Center, Sichuan University, P.R. China, for the SEM observation and analysis of the data. This work was supported by the National Key Research and Development Program of China (2021YFF1200800); 1·3·5 project for disciplines of excellence, West China Hospital, Sichuan University (ZYYC23005); the Science and Technology Project of Chengdu (2024-YF05-02494-SN).
Ethics Statement
The authors have nothing to report.
Conflicts of Interest
Author Ya Ren is an employee in Huahang Microcreate Technology Co. Ltd, but has no potential relevant financial or non-financial interests to disclose. The other authors declare no conflicts of interest.
Open Research
Data Availability Statement
The data of this study are available from the corresponding author upon reasonable request.


