The Semicrystalline Morphology of Polybutylene Succinate Supports a General Scheme Based on Intracrystalline Dynamics
Abstract
Based on a limited set of model samples it has been recently shown that semicrystalline polymers exhibit different morphological characteristics depending on the existence and timescale of intracrystalline chain diffusion (ICD) relative to the kinetics of crystal growth. Here, the generality of these reports for the case of so-called crystal-fixed polymers without or very slow ICD is tested by providing a detailed nuclear magnetic resonance (NMR) and small-angle X-ray scattering analysis of polybutylene succinate (PBS), a biodegradable polyester. By using a combination of NMR techniques covering different timescales it is shown that there is no intracrystalline dynamics on a time scale faster than 1 s, that is, PBS is crystal-fixed. An expected crystallinity below 50% and the typical morphology consisting of lamellar crystals with a well-defined crystal thickness and a broad thickness distribution of the amorphous interlayers are confirmed. By combining these results with differential scanning calorimetry measurements, a more precise value could be provided for the enthalpy of melting than previously available. The mechanical properties at room temperature are furthermore influenced by additional insertion crystallization taking place during cooling, which leads to an increase of the mechanical modulus by a factor of ≈2.5 as compared to the state at the end of isothermal crystallization.
1 Introduction
The nanoscopic morphology of semicrystalline polymers consisting of stacks of thin lamellar crystals separated by amorphous interlayers determines to a large extent their mechanical properties,[1] which are generally important for application requirements and which are also an important criterion that nowadays hinders the replacement of commodity polymers by biodegradable or biobased polymers. Given its relevance, the question has been under investigation for a long time, but there is until today no general consensus about the factors that determine the morphology, that is, the thickness of both the crystalline and of the amorphous layers. Several theoretical models have been proposed. The classical kinetic models assume that crystals with the highest growth rate dominate the crystal morphology. It was assumed that growth is limited by an activated process,[2, 3] such as secondary nucleation, removal of pinning defects[4, 5] or by chain dynamics.[6] In multistage models it is assumed that crystal thickness is a result of reorganization processes taking place during or after crystallization. Different processes have been suggested to be responsible for reorganization, namely intracrystalline chain dynamics (ICD) related to an αc-relaxation,[7-9] size-dependent stability of different crystal phases[10] or a mesophase with lower order.[11, 12] All these models do not distinguish between crystal-mobile polymers that have an αc-relaxation and crystal-fixed polymers that display no αc-relaxation.
We recently proposed that this distinction is essential for the formation of the semicrystalline morphology,[13] and showed that the competition between crystal growth and crystal reorganization determines the semicrystalline morphology. Thanks to the quantitative access to the ICD via dedicated solid-state nuclear magnetic resonance (NMR) techniques we were able to quantify this relation and showed that the ratio τlc/τc is the decisive parameter.[14] Here τlc is the layer crystallization time, the time during which the crystal grows on average by one molecular layer, and 〈τc〉 is the so-called jump correlation time determined by NMR, the average time between two helical defect jumps, which corresponds to the αc-relaxation time. Starting from polymers with slow ICD (τlc ≪ τc), over medium ICD (τlc ≈ τc) to fast ICD (τlc ≫ τc), the crystal thickness increases. The different regimes also result in different features in the semicrystalline morphology.[13] Crystal-fixed polymers such as PCL (polycaprolactone) with slow ICD form crystals with a rather uniform crystal thickness, close to the thermodynamic stability limit and a broader distribution for the amorphous-layer thickness. Crystal-mobile polymers on the other hand such as PEO (polyethyleneoxide) with fast ICD show a well-defined thickness of the amorphous regions but broadly distributed crystal thicknesses. These features can be worked out by quantitative modeling of small-angle X-ray scattering (SAXS) data.[13, 15] In addition, the competition also influences the thermal properties of the crystals.[16] During heating the crystals of crystal-mobile polymer thicken to gain stability. The crystals of crystal-fixed polymer, on the other hand, melt and recrystallize during heating to form more stable crystals.
Based on these insights, we here want to crosscheck this scheme on another relevant polymer, namely polybutylenesuccinate (PBS), a biodegradable polyester. PBS is one of the most successful candidates for replacing the commodity plastic polyethylene (PE) because it has similar thermal properties and its mechanical properties are not substantially inferior to those of PE.[17, 18] PE, the most consumed polymer because of its superb thermal and mechanical properties,[17, 19] is crystal-mobile polymer,[20, 21] but it is not well recyclable nor biodegradable.[22] Compared with PE, PBS is still not widely studied and there is no quantitative assessment of intracrystalline dynamics and the semicrystalline morphology. Xu et al.[23] and Schick et al.[24] studied the crystal thickness by SAXS and Differential scanning calorimetry (DSC), respectively. The crystallinity was estimated based on wide angle X-ray scattering (WAXS) by Papageorgiou,[25] but this method has in most cases limited accuracy. Di Lorenzo et al.[26] and Schick et al.[27] showed that crystallinity of PBS is temperature dependent, but the crystallinity at room temperature, which is critical for applications, is not available. Available values for the enthalpy of melting (ΔHm, 100) determined by different methods range from 110, over 200 to 210 J mol−1.[25, 28, 29]
We therefore here present an experimental study to probe the potential ICD of PBS by a combination of solid-state NMR techniques in combination with a SAXS-based analysis of the complete semicrystalline morphology. The combination of these different robust methods was used to determine the crystallinity and its dependence on temperature. In addition, we provide a more reliable value for ΔHm, 100.
2 Result and Discussion
2.1 Is PBS a Crystal-Fixed Polymer?
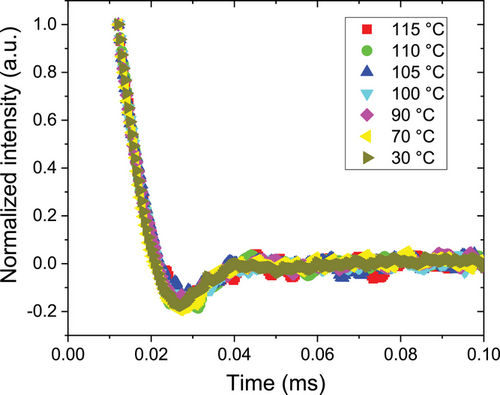
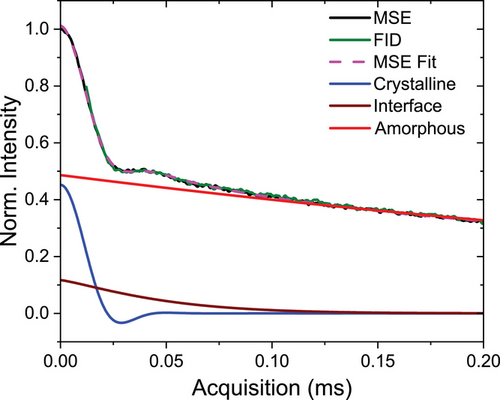
To determine if PBS is a crystal-fixed polymer, we need to compare the timescale of possible intracrystalline chain diffusion (ICD) with the layer crystallization time τlc.[13] To study fast molecular dynamics on the time scale of µs in the crystalline fraction of PBS, we performed 1H-NMR free induction decay (FID) measurements. In addition, these measurements allows us to determine the crystallinity, which we separately discuss further below. After isothermal crystallization at 100 °C, the sample was cooled to 30 °C and heated step-wise to 115 °C. At each temperature, an FID measurement was taken and the normalized crystal fraction was extracted according to Equation (4) in Experimental Section. The resulting FIDs for the crystalline fractions are shown in Figure 1. All curves show the typical shape for an organic solid with strong 1H dipole-dipole couplings, here without any significant changes with temperature.[30] The temperature independence of the curves indicates the absence of ICD on the time scale of the method (≈0.2 ms). If there was relevant ICD, we would observe temperature-dependent changes in the shape of the curves reflecting the increasingly fast molecular dynamics, where typically follows an Arrhenius dependence.[13]
As no fast ICD was detected in PBS, we now need to address potentially slower motions up to the scale of seconds. Exchange-NMR methods relying on the reorientation of the 13C chemical-shift anisotropy (CSA) tensor, as used in our previous work focusing on poly(oxymethylene),[14] are not applicable in the given case of PBS. The reason is the regularity of the crystal structure, specifically the all-trans rather than helical conformation, where the translation by one monomer unit places all atoms in crystallographically equivalent positions.[31] We are thus left with the possible detection of monomer exchange between the crystalline and amorphous regions, that is, probing the diffusive long-range ICD. This can be achieved either by observing an exchange between 13C isotropic chemical shifts related to the two regions, provided they are distinguishable,[32] or by 13C T1 relaxation.[32, 33]
The T1-based approach relies on the usually very long T1 of the crystalline 13C, which show a T1 decay rather by diffusing into the amorphous region where T1 is often orders of magnitude shorter. The experiment is best realized by using Torchia's z-filtering pulse sequence[34] for the measurement of 13C T1 harnessing cross-polarization (CP) for signal enhancement, by which a decay curve with known final value of zero intensity is measured. In this way, deviations from single-exponential decay toward diffusive behavior are readily apparent.[33]
Prior to this, it is critical to determine which 13C peak best represents the crystalline domain we are interested in, that is, avoiding signal contributions from the amorphous phase. To this end, we acquired 13C spectra with 10 kHz magic-angle spinning (MAS), comparing CP and direct polarization (DP), see Figure 2a. As discussed in Experimental Section, the DP spectra with comparably short recycle delay (RD) show mostly amorphous signals and largely exclude the crystalline ones with their long T1, while the latter are rather emphasized in CP spectra with short contact time (CT). A quantitative spectrum showing all resonances is obtained via a DP spectrum with an RD allowing for near-complete T1 relaxation (≈250 s in our case). From their comparison, we can identify the crystalline (subscript c) and amorphous (a) resonances.
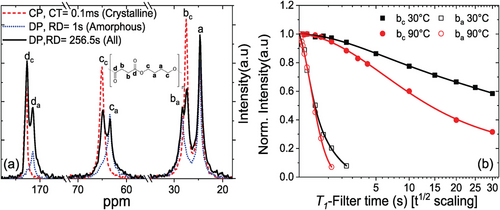
Based on the observed 13C spectrum, the well-separated intense peak bc was chosen to probe its T1 relaxation and thus assess potential ICD. The T1 decay curves of bc for two rather different temperatures of 30 and 90 °C are shown in Figure 2b. These were obtained by using spectral deconvolution to avoid contribution from the neighboring peaks, see Figure S1, Supporting Information. The T1 relaxation curves of peak bc show no indication of a contribution of a more rapid decay (T1< 1 s) at both temperatures, and the initial decay is not linearized by the scaling, as opposed to what would be observed if the decay were governed by diffusion of the monomers into the amorphous phase.[33] This implies the absence of ICD in PBS up to the timescale of about 1 s. PBS is this similar to the previously studied PCL, which was shown to be a crystal-fixed polyester,[35] see also Figure S1c, Supporting Information.
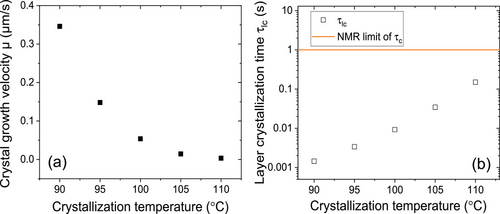
We measured μ of PBS during isothermal crystallization for different crystallization temperatures Tc. μ decreased with increasing Tc, accordingly τlc increased, as shown in Figure 3. The orange straight line in Figure 3b corresponds to the measurement threshold of τc estimated by NMR; τlc is lying well below this line for all Tc. Based on our previous results on PEO and PCL we would therefore expect that the semicrystalline morphology of PBS shows the typical features of a crystal-fixed polymer, that is, a well defined crystal thickness and a broad distribution for the thickness of the amorphous regions.[14]
2.2 Semicrystalline Morphology of PBS
| Tc | SAXS Xc, volume | SAXS Xc, mass | NMR Xc, mass | ΔHm by DSC | ΔHm, 100 |
|---|---|---|---|---|---|
| [°C] | [%] | [%] | [%] | [J g−1] | [J g−1] |
| 95 | 42 | 45 | 41 | 77 | |
| 100 | 42 | 45 | 42 | 79 | 183±8 |
| 105 | 41 | 44 | 42 | 80 |
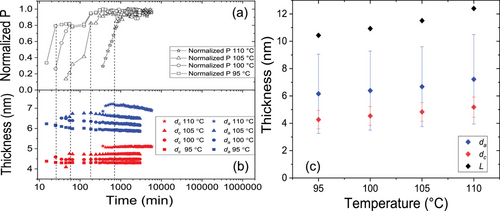
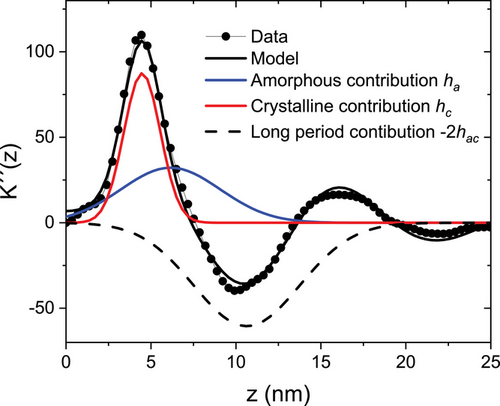
The agreement between the crystallinities determined by SAXS and NMR is reasonable and within expectations, given the fact that the two methods rely on different principles. While SAXS relies on density contrast, the NMR-based FID deconvolution is based on mobility contrast. Additionally, the NMR analysis relies on a three-phase model, where Table 1 shows the value for the crystalline phase only. Based on the combined values an estimate for the enthalpy of melting can be given, as discussed below together with the DSC measurements. Our values for dc are consistent with available literature values. These are SAXS based values from Xu et al. and an indirect estimate based on sophisticated DSC measurements and selected literature values for the enthalpy of melting, the equilibrium melting temperature and the free energy of the fold surface of lamellar crystals.[23, 24] All of our results are consistent with our previous conclusions about the general morphological features of crystal-fixed polymers: A well-defined, relatively small crystal thickness dc, absence of any observable crystal thickening, crystallinity Xc below 50%, greater values for σa than σc, while da and dc show values of the same order of magnitude.[13, 14]
2.3 Melting Behavior and Enthalpy of Melting
With the help of the known values of the crystallinity determined above, measurements of the enthalpy of melting of semicrystalline samples can be used to determine the extrapolated enthalpy of melting of a hypothetical 100% crystalline sample. Figure 5 shows heating scans of PBS after isothermal crystallization at different temperatures Tc. As observed before,[25, 37, 38] PBS shows multiple melting caused by melting and recrystallization, as it is typical for crystal-fixed polymers within a suitable parameter range.[16] The onset of melting, indicated by arrows is related to the stability of the crystals directly after crystallization. Accordingly, this feature shifted to higher temperatures with increasing crystallization temperature, while the final melting peak as a result of reorganization during heating by (repeated) melting and recrystallization appeared more or less at a the same temperature, independent of Tc.
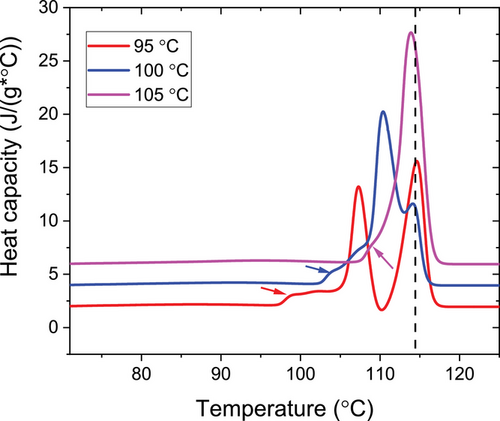
To determine the melting enthalpies ΔH, we extrapolated the heat capacity from the molten state above 120 °C to Tc as base line and then integrated the heat capacity from Tc to 120 °C for each Tc. Division by the mass crystallinity gives an estimate for ΔHm, 100. Note that this value ΔHm, 100, is the enthalpy of melting at the temperature of melting, that is, ≈115 °C, not at the equilibrium melting temperature. The mean value is ΔHm, 100 = 183 J g−1, with a standard deviation of 8 J g−1. This value is comparable but lower than those reported by other researchers of 200[29] and 210 J g−1.[25] The latter value was determined in a similar way as above from the combination of a determination of the enthalpy of melting by DSC and of the crystallinity, in this case by WAXS. Given the limited precision of crystallinity values determined by WAXS, we believe that our value is more reliable. A third value of 110.3 J g−1 is often cited in the literature with reference to Chapter 5 of ref. [39] without giving a detailed derivation. ΔHm, 100 itself is not given in there. Given the experimental results, this value can obviously be discarded.
2.4 Temperature-Dependent Crystallinity and Mechanical Modulus
A major motivation to characterize and understand the morphology of semicrystalline polymers is due to the fact that the mechanical properties, and specifically the modulus depend strongly on the crystallinity.[40, 41] Based on specific DSC experiments, PBS is reported to crystallize further upon cooling below Tc, even if the previous isothermal crystallization at elevated temperatures was complete.[27, 42] It is therefore of interest for practical application, for example, in packaging[43] to determine the crystallinity and the mechanical modulus in the temperature range between Tc and room temperature. While in DSC the changes in crystallinity are difficult to identify and separate from the heat capacity signal (cf., Figure S2, Supporting Information), they show up clearly in the NMR-FIDs.
The resulting temperature dependent crystallinity is shown in Figure 6a. After an isothermal crystallization at Tc = 100°C the sample was cooled to 30 °C and subsequently heated stepwise back to 100 °C with NMR measurements at each holding temperature. In this temperature range, the crystallinity changes more or less reversibly by a factor of ≈1.4. To confirm that the immobile phase formed during cooling is indeed crystalline, we performed WAXS measurements at selected temperatures, which show in fact an increase of the intensity of Bragg reflections at low temperatures, cf., Figure S3a, Supporting Information. Given the specific semicrystalline morphology, that is, da > dc and large σa, one would expect that this additional crystallization follows the scenario of insertion crystallization, that is, the thin crystals formed upon cooling grow into the larger amorphous regions. This picture is qualitatively consistent with observed changes in the SAXS data, shown in Figure S3b, Supporting Information. A similar effect was observed before for PCL, but weaker because of the smaller temperature difference between Troom and Tc.[13]
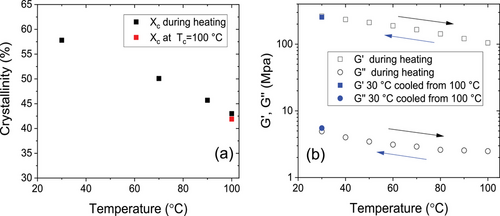
To investigate the effect of the observed changes in crystallinity on the linear mechanical properties we measured the dynamic shear modulus over the same temperature range at a fixed frequency. Samples with a similar thermal history as above (isothermal crystallization, Tc = 100 °C) were heated stepwise from 30 to 100 °C during the measurement, and then cooled again to 30 °C to confirm the reversibility of the measured values. The resulting values for G′ and G″ are shown in Figure 6b. The storage modulus increases by a factor of about 2.5 during cooling over the relevant temperature range and the change in G″ is similar, while the absolute value is more than two orders of magnitude smaller. This behavior confirms that the temperature dependent changes are not caused by any relaxation. The results show that the additional crystallization upon cooling leads to a significant reinforcement of the material, which on the other hand also leads to a softening at elevated temperatures, effects which might be relevant for specific applications. We would expect that these are general effects for crystal-fixed polymers.
3 Conclusion
In conclusion, we could show that PBS has to be classified as a crystal-fixed polymer without or at most very slow intracrystalline chain diffusion, for which reorganization of the semicrystalline morphology plays no role during crystallization. In agreement with our hypothesis, PBS shows the typical morphological features that we previously attributed to this class of polymers, namely: a relatively small crystal thickness dc with a weak dependence on crystallization temperature, absence of any discernible crystal thickening during isothermal crystallization; low crystallinity (), greater values for the distribution width σa of the amorphous regions than that for the crystalline layers σc. Similar to PCL, our previously studied model polymer, melting of the original crystals happens only slightly above Tc and during further heating a complicated melting and recrystallization process occurs leading to a final melting temperature largely independent of the crystallization temperature.
Making use of the large temperature range between crystallization/melting and room temperature, we could furthermore show that the crystallinity increases significantly during cooling by insertion crystallization, leading to rather strong increase in mechanical modulus.[13, 14, 16] Presumably, these are general effect for crystal-fixed polymers.
Based on the relatively precise and consistent values obtained for the crystallinity by two different experimental methods, we could extrapolate the measured value for the enthalpy of melting to the value of a 100% crystalline sample, ΔHm, 100=183 ±8 J g−1. Given the larger range of values for this quantity given previously in the literature, we believe that our value allows a more precise determination of the crystallinity based on simple DSC measurements.
With the decisive role of the intracrystalline chain diffusion for the morphology of semicrystalline polymers becoming more and more established, naturally the question arises which factors favor the existence and the time scale of such a dynamics. Polyesters promise to be interesting objects of study here, given the fact that, for example, PLA is known to exhibit ICD on an intermediate time scale.[44, 45] A deeper understanding of the semicrystalline morphology of this polymer family would also be of practical interest as polyesters are promising candidates as commodity plastics because of their biodegradability and the fact that at least some of them are biobased.
4 Experimental Section
Materials:
A commercial-grade polybutylene succinate (FZ91) from PTT MCC Biochem Co., Ltd. with molecular weight Mn = 40 850 g mol−1, Mw = 143 400 g mol−1 (PD = 3.5) was used as measured by GPC in dichloromethane with polystyrene calibration.
Proton Low-Resolution NMR FID Analyses:
1H time-domain NMR experiments at low field (B0 ≈ 0.5T ) were performed on a Bruker minispec mq20 spectrometer with a proton frequency of about 20 MHz (B0 ≈ 0.47 T ) using a static probe head with wide temperature range realized by heated or cooled air flow. The temperature accuracy of the instrument is ±1 K with a gradient of up to 0.5 K over the sample. The samples were always heated to 140 °C for 10 min to remove the thermal history, and then cooled to different crystallization temperatures for isothermal crystallization. The stepwise heating for the measurement shown in Figure 6a was carried out with a rate of ≈5 K min−1, with an additional 10 min of equilibrium time before each NMR-FID measurement.
The instrument features a 90° pulse length of ≈2.8 µs; the recycle delay (RD), that is, the time between successive scans was set to 2 to 3 s, sufficient for near-complete T1 relaxation. Measurements and analyses were conducted as reported in previous works.[30, 46] To overcome problems with the dead time of about 12 µs, FID signals detected directly after a 90° pulse were compared with signals after a magic-sandwich echo (MSE). The latter avoided the dead time, but features some loss of intensity, meaning that shape parameters were taken from the MSE-FIDs while component amplitudes were taken from the FIDs.
13C MAS Spectroscopy:
All 13C spectra and data were recorded on 400 MHz Bruker Avance III spectrometers with 13C Larmor frequency of 100.6 MHz using double- and triple-resonance MAS probes at a spinning frequency of 10 000 ±3 Hz. The pulse lengths on the 1H and 13C channels were ≈3 µs. CP spectra were recorded with contact times of 0.1 ms for crystalline-signal selection as well as 1.5 ms for maximum signal overall, using an RD of 5-7 s (shorter at higher temperature) for near-complete T1 relaxation of the 1H nuclei (being the source of polarization in CP). In contrast, 13C DP with short RD of ≈1 s emphasizes the mobile/amorphous signals. For measurements of the 13C T1 relaxation decay, the pulse sequence of Torchia[34] featuring a z-filter on the 13C channel after CP was used, utilizing peak deconvolution to faithfully separate the different resonances.
SAXS:
SAXS measurements were performed on a Kratky compact camera (Anton Paar GmbH, Graz, Austria) equipped with an X-ray optics (AXO Dresden GmbH, Germany), a temperature-controlled sample holder, and a 1D detector Mythen2 R 1K (Dectris, Switzerland). As the camera has a slit focus, the data had to be deconvoluted. This was achieved by applying the desmearing algorithm by Strobl.[47]
Figure 8 shows and exemplary set of data obtained after a long isothermal crystallization of 49 h (2945 min) at Tc = 100 °C. Although the different contributions to the IDF overlap, they can be well separated with the quantitative modeling. The corresponding fit function in reciprocal space is shown in Figure S4, Supporting Information.
DSC:
DSC was performed with a DSC 8000 from Perkin Elmer. The sample was heated to 150 °C to remove thermal history and quenched to different crystallization temperatures. After the completion of isothermal crystallization, the sample was cooled to −60 °C and heated to 150 °C at a rate of 10 k min−1.
Rheology:
The shear modulus was measured with a rheometer Ares G2 equipped with heating chamber from TA instruments using a sample in stripe geometry (sample length between clamps 20 mm, width 10 mm, thickness 1.5 mm) at different temperatures but constant frequency of 10 rad s−1 and 0.1% strain. Beforehand the sample was isothermally crystallized at 100 °C in a rectangular mold (MeltPrep device) for 24 h, and then transferred to the rheometer at room temperature. The stepwise heating program for the measurement shown in Figure 6b was similar to that of the NMR-FID measurement.
Optical Microscopy:
Optical microscopy measurements were performed by using an Olympus BX51 microscope equipped with an Olympus XC30 camera allowing observation of the sample and recording of the images. A Linkam hotstage equipped with a Linkam TP 94 temperature controller and a Linkam LNP liquid nitrogen controller was used as the sample stage. 103 mg PBS was dissolved in 4 mL chloroform, and placed one droplet of the solution on a cover glass, which was heated to 140 °C to remove the solvent and melt the PBS. Another cover glass was placed on top of PBS melt. For the measurements, the sample (PBS sandwiched between cover glasses) was placed on the Linkam hot stage. The temperature was raised to 140 °C for 10 min and then cooled with a rate of 30 °C min−1 to different temperatures for isothermal crystallization. The crystallization was directly monitored using polarized light optical microscopy. Olympus Stream Motion software was used to observe the camera view on a computer and to analyze the images.
Acknowledgements
The authors thank the Deutsche Forschungsgemeinschaft (DFG) for financial support in the framework of the SFB-TRR 102 (project-ID 189853844), project A1. Furthermore, the authors acknowledge K. Herfurt for technical help with DSC measurements and M. Schulz and M. Schaller for help in the early stages of the project.
Open access funding enabled and organized by Projekt DEAL.
Conflict of Interest
The authors declare no conflict of interest.
Open Research
Data Availability Statement
The data that support the findings of this study are available from the corresponding author upon reasonable request.


