Raman spectroscopic analysis of human blood serum of glaucoma patients supplemented with macular pigment carotenoids
Abstract
As all major dietary carotenoids are contained in blood, it is a suitable substrate to evaluate their content, in vivo. Following 18-month supplementation of open-angle glaucoma patients with macula-pigment carotenoids (Lutein, Zeaxanthin and Meso-Zeaxanthin) in the European Nutrition in Glaucoma Management trial, Raman spectroscopic analysis of the carotenoid content of pre- and post-supplementation participant blood serum was carried out, to investigate the systemic impact of the supplementation regimen and explore a more direct way of quantifying this impact using routine blood tests. Using a 532 nm laser source for optimal response, a consistent increase in serum carotenoid concentration was observed in the supplemented serum, highest in patients with initial high baseline carotenoid content. A shift in the 1519 cm−1 carotenoid peak also revealed differences in the carotenoid structural profile of the two groups. The findings highlight the potential of Raman spectroscopy toquantify and differentiate carotenoids directly in blood serum.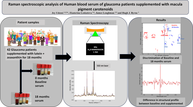
Abbreviations
-
- ENIGMA
-
- European nutrition in Glaucoma Management
-
- HPLC
-
- high performance liquid Chromatography
-
- MP
-
- macular pigment
-
- MPOD
-
- macular pigment optical density
-
- OAG
-
- open angle Glaucoma
1 INTRODUCTION
Carotenoids are very important, fat-soluble, pigmented compounds that occur widely in nature [1]. Among these are dietary carotenoids like lycopene, beta carotene, lutein, and zeaxanthin, found in carotenoid-rich fruits, vegetables, animal fat and other foods [2]. They can be absorbed, circulated in blood and deposited in different tissues [2], from where they become involved in antioxidant and photoprotective roles in the body [3]. As a result, dietary carotenoids play a major role as markers for nutrition and general health status in people [4, 5]. In this context, a major interest in carotenoids comes from their direct implication in ocular health, especially in the elderly [6]. The macular pigment (MP) of the eye has the highest levels of carotenoids in the body, and these carotenoids (lutein, zeaxanthin and meso-zeaxanthin) protect the eye from diseases like age-related macular pigment degeneration (AMD) and glaucoma, which are particularly prominent in the elderly population [7, 8].
Dietary carotenoids have been found to be concentrated mostly in the eyes, skin and blood, although in different compositions [1]. Blood is the most widely studied bodily fluid and the primary specimen of interest in clinical diagnostics [9, 10], presenting it as perhaps the most ideal substrate to estimate carotenoids in the body. Blood (serum/plasma) specifically contains all major dietary carotenoids, albeit in small quantities (>3 μmol/L) [11, 12]. Normal (unsupplemented) serum contains an average profile of different carotenoid structures (beta carotene and lycopene forming about ~65% and lutein and zeaxanthin, ~18% [11]). Presently, blood serum carotenoids are analysed in clinics using the gold standard technique, High-Performance Liquid-Chromatography (HPLC) [13]. However, while the ability of this method to quantify and differentiate carotenoids is continuously improving [14, 15], it is also costly, laborious, and requires large volumes of samples for analysis [13, 16].
As a potential alternative, Raman spectroscopy can detect carotenoids in various biological systems of the body including blood (whole blood, serum/plasma) [1, 10]. Several studies [17-23] have employed Raman spectroscopy to quantify the total serum carotenoids, but only as a means of identifying disease conditions, and thus differentiating and perhaps quantifying the carotenoids was not of primary importance. The information obtained from these types of investigations is very general and not detailed enough to make definitive diagnostic conclusions. Also, Carotenoids found in the blood are poorly soluble in aqueous media and tend to form aggregates [24], which can in turn affect their molecular structure and optical properties. [1]. In human blood, carotenoids are bound to albumin and transported through lipoproteins, which, influence how they aggregate [25-27].
Carotenoids are highly polarisable conjugated organic molecules and are particularly Raman active. In spite of their relatively low concentrations, they can dominate the spectrum of blood serum, especially when using visible lasers as source, at whose wavelengths they are resonantly or near resonantly enhanced [28, 29]. Generally, the Raman spectra of carotenoids are dominated by three characteristic bands at ~1519 cm−1 (v1), ~1158 cm−1 (v2), and ~ 1004 cm−1 (v3) [30]. Ideally, identifying and analysing small shifts in the spectral features of the carotenoids can help distinguish them [31]. This difference comes especially from the v1 band at 1519 cm−1, which is derived from the carbon double bond stretching modes (CC) of the carotenoids and also directly correlates with their conjugation lengths [31, 32]. The relative content of different carotenoid compounds has also been monitored using a combination of different Raman source laser wavelengths, exploiting the different degree of resonant enhancement of each at the different wavelengths [33]. This has been demonstrated in vivo with the dermal carotenoids, beta carotene and lycopene [34, 35] and ex vivo as with the highly similar macula pigment carotenoids, lutein and zeaxanthin from retinal samples [31]. Note that this technique of comparison of the responses at multiple source wavelengths is commonly referred to as Resonance Raman spectroscopy, and therefore, in this study, employing only a single source wavelength (532 nm), the term Raman spectroscopy is used.
The ability to properly differentiate and quantify the individual dietary carotenoids can bring better insight into diagnosis of diseases like AMD and glaucoma.
In a preliminary study, the variation of the UV/visible absorption and the Raman scattering spectra of the carotenoids, beta carotene, lutein and zeaxanthin, complexed in aqueous solution with bovine serum albumin, were examined, indicating that it is possible to identify differences in optical absorption profiles, Raman spectroscopic profiles, and even to quantify the relative contributes in admixtures of various relative compositions of the three carotenoid complexes. Differences in the Raman spectral profiles were particularly evidenced by differences in the relative positioning of the v1 peak at ~1519 cm−1, which in a difference spectrum, or principal components analysis, give rises to a derivative-like line-shape [33].
This study is therefore focused on further exploring the unique potential of Raman spectroscopy to analyse dietary carotenoids directly in blood serum from open-angle glaucoma (OAG) patients participating in the ENIGMA clinical trial, carried out at Centre for Eye Research Ireland (CERI) [36], and who have received supplementation with lutein, zeaxanthin, and meso-zeaxanthin over a period of 18 months. Supplementation with lutein, zeaxanthin, and meso-zeaxanthin has been demonstrated to successfully augment the MP in AMD and recently in glaucomatous eyes as demonstrated by the ENIGMA study [36]. The supplementation in the ENIGMA study resulted in a 60% mean increase in macular pigment optical density (MPOD) over the 18-month period. MPOD is an estimation of the density of Macular Pigment (MP) in the centre of the retina, obtained by measuring blue light attenuation by the macular pigment [37]. In this case, MPOD was measured using the autofluorescence method [38, 39].
Given the positive impact of carotenoid supplementation, it is therefore of keen interest to investigate the systemic impact of supplementation in the blood and explore a more direct way of quantifying this impact using a routine blood test. The study will monitor the overall carotenoid content and structural profile directly in serum samples of patients before and after the 18 months supplementation programme using Raman spectroscopy, coupled with principal components analysis, in terms of the overall quantities and their structural profiles.
2 MATERIALS AND METHODS
2.1 Patient samples
Patient serum samples were obtained from the Centre for Eye Research Ireland (CERI). Blood samples were drawn from a total of 62 patients who were voluntary participants in the European Nutrition in Glaucoma Management (ENIGMA) trial, registered at ClinicalTrials.gov, identifier NCT04460365 [36]. Recruitment was carried out at the Mater Misericordiae University Hospital and Mater Private Hospital (Dublin, Ireland), whereas study visits were conducted at the Centre for Eye Research Ireland, a dedicated academic clinical trial centre at Technological University Dublin. All necessary research ethical approval was obtained from the Mater Misericordiae Institutional Review Board and from Technological University Dublin Research Ethics and Integrity Committee [36]. Written consents were obtained from participants, and the study adhered to the tenets of the Declaration of Helsinki.
The ENIGMA study [36], was a randomised, placebo-controlled, double-masked clinical trial, designed to evaluate the Macular Pigment response of patients with open angle glaucoma (OAG) to supplementation with lutein (10 mg), zeaxanthin (2 mg), and meso-zeaxanthin (10 mg) over an 18-month period. The supplement ratio was the same as that of commercially available macular pigment supplementation, Macushield, provided by Thompson & Capper Ltd, Runcorn, UK. The dose was also deemed safe, with renal, liver, lipid, hematologic, and inflammatory biomarkers all unaffected by supplementation at these concentrations [40].
Forty two participants randomly received the carotenoid supplements, while 20 received the placebo, which was as a soft gel capsule, identical in appearance to the active supplement, but containing only sunflower oil. Blood samples were taken at the beginning of the study (baseline) and at 6-monthly intervals over 18 months. Macular pigment measurements [41] and other optometric parameters were also recorded.
The main outcome of the trial was a statistically significant increase in MPOD volume (significant time effect: F (3,111) = 89.31, mean square error (MSE) = 1656.9; p < 0.01). A 60% mean increase in MPOD volume was observed over the 18-month trial duration among those randomised to receive the macular carotenoid supplement, whereas MPOD remained relatively unchanged among those assigned to placebo.
For the present study, blood serum samples obtained at baseline (before supplementation) and at 18 months, from patients who had received the carotenoid supplements, were used for Raman spectroscopic analysis. Samples from placebo patients were not examined, as the original study reported no observed effects [36]. Blood samples were drawn and processed to obtain serum by personnel from CERI. Samples were stored at −80°C and thawed in a water bath at 37°C, after which Raman spectroscopic measurements were immediately carried out.
In total, serum samples from 40 patients of the ENIGMA study were made available for the Raman spectroscopic analysis. Baseline samples were available for 25 patients and 18 months supplemented samples available for 28 patients. Both baseline and 18-months supplemented samples were available for eight patients, and this set was used for the matched patient analysis (Section 3).
2.2 Reference sample preparation
Beta carotene and bovine serum albumin (BSA) powders were purchased from Sigma Aldrich (Arklow, Ireland). The reference samples were prepared by adding 20 μL of ultra-pure water (Millipore) to 1 g of the powder and mixed until a thick paste was formed. The pastes were measured immediately on a glass slide.
2.3 Raman spectroscopic analysis
Raman spectral measurements [41] were carried out using a Horiba Jobin-Yvon LabRam HR800 spectrometer with a 16-bit Peltier cooled CCD detector, coupled to Olympus 1X71 inverted microscope and a ×60 water immersion objective (LUMPlanF1, Olympus) was employed for serum samples. A 532 nm laser line of 12 mW was used in taking measurements with a 300 lines/mm grating throughout the study, yielding a spectral dispersion of ~1 cm−1 per pixel. The spectral range employed was 400–4000 cm−1 and the back scattered Raman signal was typically accumulated for 5 × 4 s. Depending on the measurement, 4–6 spectra were acquired from different spots on each sample to confirm that the response was stable and there was no discernible degradation occurring as a result of the 532 nm laser.
Raman measurements of the reference samples, water, beta carotene and BSA were measured with ×60 water immersion objective in an upright position. In order to achieve as much as possible water free spectra of the beta carotene and BSA, as references, while minimising any spectral distortions due to local crystal field effects, and so forth. In the powder form, a wet paste of the powder of known concentration was measured [10]. Serum measurements were performed by focussing the objective lens into the samples contained in a cover slip glass bottom 96-well plate (Matek), [10]. Note that the spectra were not corrected for the differing instrument responses, including source power, and responses over the different spectral ranges [42]. However, the uncorrected spectra better represent the quality of the spectral signal collected.
2.4 Data processing and analysis
All data processing and analysis was conducted using the MATLAB platform. The initial Raman spectroscopic analysis was carried out on the entire data set, including both baseline and 18 month-supplemented blood serum. Blood serum is very complex, typically containing more than 10 000 different proteins [43], as well as other components such as metabolites, peptides, sugars, and lipids [44]. Notwithstanding this, carotenoids (even though found in small quantities in the blood) dominate the spectrum of blood serum, especially at resonant or near resonant conditions [28, 29]. A typical Raman spectrum of serum taken with a 532 nm laser source therefore shows a spectral profile of mixed signals from carotenoids, water, serum albumin (as the dominant serum protein), other serum proteins, and stray light scattering [45, 46]. The background correction (BC) algorithm adapted by Kerr and Hennelly [47] was used to improve the spectra by performing background subtraction of water. It was essential to remove water because it makes up 91%–92% of serum [48], so strongly dominates the spectra of blood serum. This was done by inputting a known spectrum of water into the BC algorithm [49]. Before background correction, all spectra were smoothed using the Savitsky-Golay algorithm (polynomial order of 5, window of 9) to reduce the noise. As an extra precaution, the spectrum of glass was also subtracted from the serum spectra. The glass spectrum can contribute to the spectra in the inverted geometry, especially when using very low volume samples [47, 50]. Some of the baseline spectra showed interference from the glass peak at 950 cm−1 (figure not shown). It was therefore important to remove any possible glass signal from both baseline and the supplemented serum spectra; hence it was subtracted alongside water in the BC algorithm by inputting the spectra of the empty glass 96 well plate into the algorithm. The algorithm also fits and subtracts a polynomial baseline to account for any dark and optics related background. The corrected spectra were also water normalised by the co-efficient of the subtracted water, as an internal standard, using a further modification of the method by Parachalil et al. [10, 28].
Figure S1a is the 532 nm spectrum of the glass 96 well plate used for measuring the serum samples. Glass based substrates typically show significant Raman scattering contributions in the region of ~500–1000 cm−1, originating from SiO2 vibrations [47, 50]. Figure S1b is the water spectrum, used in the BC algorithm to subtract water, which constituted a major part of the background. The spectrum of water shows characteristic peaks at ~1640 cm−1 from the HOH scissors, and a broad band from ~3000–3600 cm−1, from the OH symmetric and antisymmetric stretch [33].
Figure S1c is the spectra of pure beta carotene (paste) at 532 nm, which was used as reference for the BC correction. The spectrum clearly exhibits the characteristic carotenoid peaks at ~1519, ~1158 and ~ 1004 cm−1 [1]. Also used as reference for the BC correction was the spectrum of BSA, in Figure S1d. BSA exhibits typical protein features such as the sharp phenyl alanine peak at ~1004 cm−1, the broad Amide I band at ~1620 cm−1, which can be observed in the region of 400–1800 cm−1 and the broad CH band at 2900 cm−1 [51].
2.5 Principal components analysis
The application of multivariate analysis methods better enables visualisation of the variance of the spectral dataset, and for example to identify clustering of the responses for individual patients. Principal Components Analysis (PCA) is a multivariate analysis technique commonly used to analyse multi-dimensional data sets by reducing the number of variables in data sets with multi dimensions without altering the major variations within the data set [52]. The order of the principal component describes the relevance to the data set. PC1 is expected to describe the highest variation in the data, followed by PC2, PC3 and so on. The first three PCs will generally provide up to 99% variance in the data set, giving the best visualisation of the differentiation in the cluster sets. [52, 53].
In this study, PCA was used to explore the differences in both carotenoid content and structure of the baseline and 18 months supplemented blood serum spectral data sets. The data used for PCA was already corrected for interferents (water and glass), noise and normalised for water content. PC1 and PC2 loadings were sufficient to show majority of the variation in the data set. The spectral loading of PC1 was used to highlight the difference in the concentration of carotenoids, while PC2 highlighted the difference in carotenoid structures [33].
The spectra are mean centred as an integral part of the PCA algorithm in Matlab, and the effect of vector normalisation in addition to the normalisation to water content on the analysis is also explored.
3 RESULTS
3.1 Raman spectroscopic analysis of baseline and 18 months supplemented patient serum
Figure 1A,C show the uncorrected Raman spectra from 28 patient baseline and 25 supplemented patient serum samples, respectively. Both figures show the same features, the Raman bands from the carotenoids dominating the fingerprint region and water dominating the high wave number region of the spectra. Carotenoids characteristically are recognised by three bands at ~1004, 1158, and 1519 cm−1. These bands are clearly enhanced in the Raman spectra of serum, especially when using resonant or near resonant laser wavelengths sources [17, 21], as in the case of this study. The bands are associated with the carbon–carbon double and single bond stretches of the polyene backbone and methyl bends of the carotenoid structure. The 1519 cm−1 peak is the most significant and corresponds with the v1band, originating from vibrations of conjugated CC stretching modes of the double bonds [32, 54]. The 1158 cm−1 peak corresponds with the v2 band, originating from stretching vibrations of CC single bonds coupled with CC in-plane bending modes [31, 32]. The 1004 cm−1 peak corresponds to the v3 band, originating from C-CH3 bonds found between the main carbon chain and the side methyl groups in the carotenoid molecule [31, 55]. Other weaker bands exist, especially in the region >2000 cm−1, but are overtone and combination bands which arise from the total symmetric character of v1, v2 and v3 [56, 57]. They are also mostly visible in the resonant or near resonant vibrational state [56, 57]. Notable serum features are the amide band of proteins at ~1620 cm−1, while the strong, sharp characteristic band of phenyl alanine residues at ~1004 cm−1 is obscured by the carotenoid peak in the same region. Serum albumin is the dominant protein in blood serum and contributes the major Raman features of blood serum [58, 59].The solubility of carotenoids in serum albumin complex has previously been demonstrated, as well as the protocol for subtraction of albumin and water [33], which greatly enhances the carotenoid features in the serum spectrum. Also clearly visible is the broad band in the region of 2900 cm−1, which derives from the CH bonds of lipids and proteins [45, 60].

The spectra were improved by performing background correction, inputting known references (BSA and beta carotene) into the algorithm and subtracting the water and glass spectra (Figure S1). A polynomial of 7 was chosen as the best order for the correction and the spectra were further normalised for water [10]. Figure 1B,D shows the corrected spectra for baseline and supplemented serum, respectively. The spectral range has been restricted to 2800 cm−1 to eliminate the serum band at ~2900 cm−1 which appeared to overwhelm the spectra after BC of water. Therefore, the restriction was done to accentuate the region of the carotenoid bands at 1004, 1158 and 1519 cm−1, which is the focus of the study. Some peaks from serum also become clearly visible, for example, the amide band at ~1620 cm−1 and the collagen band at ~1448 cm−1 [61]. Also, important to note is the clear difference in intensity of the carotenoid peaks in baseline and supplemented corrected serum spectra. The supplemented serum spectra show a much higher intensity in the carotenoid peaks, about twice the intensity of the baseline carotenoids.
3.2 Differential analysis of baseline and supplemented patient serum
To properly analyse the carotenoid content in the two sets of data (baseline and supplemented serum) using Raman spectroscopy, it was important to consider whether they could be differentiated. Since this analysis is carried out in patient serum, many factors come into play in differentiating the baseline and supplemented samples, such as the difference in the overall carotenoid content, as well as composition of the samples. Critically, the degree of intra and inter patient variability of the content and composition of the serum should initially be considered. PCA was therefore employed to make detailed comparison of the Raman spectra from baseline and 18 months supplemented serum, by first looking at variations within the individual data sets, then in a matched data set (of serum samples of individuals taken before and after supplementation) for a more accurate comparative analysis. PCA comparison of the full baseline and 18-month cohorts is shown in the Supplementary material (Figure S6). A further PCA comparison of two extreme patient serum sample signals, the patient with the lowest carotenoid Raman signals in both baseline and supplemented serum spectra (ET022) and the patient serum with the highest signal (ET037) is also shown in the supplementary material (Figure S7).
3.3 Baseline samples
Figure 2A is the baseline scatter plot. There is a wide spread of points across the plot from the negative to the positive side, with very loose clustering and differentiation between individual patients. The results of the PCA indicate that the spread of the points in the scatter plot is primarily attributed to the variation of PC1 (68.71%). Figure 2B,C are the PC1 loading plots for the baseline group, with and without vector normalisation, respectively. Remembering that the BC algorithm employed in this study normalises the spectra of all samples based on their water content, the fact that the loading of PC1 (unnormalised) is dominated by the carotenoid spectrum is indicative of a strong variance in the overall carotenoid content of the samples. After vector normalisation, PC1 now represents differences in the serum content itself, and distinguishes the carotenoids from serum peaks with a dominance of carotenoid peaks in the positive side and serum peaks on the negative side of the plot. This, in essence, describes the relative amounts of the carotenoids compared to the serum, although there is no obvious indication of differences in the composition of carotenoids present, which would result, for example, in a shifting of the dominant peaks [33]. The corresponding loadings of PC2 are shown in Figure 2D,E Unnormalised (Figure 2D), the loading shows a strong resemblance to the normalised PC1 loading (Figure 2C), although inverted, differentiating between the carotenoids (on the negative side) and serum peaks (on the positve side) on each side of the plot. Again, there is no strong indication of variability in the composition of carotenoids present in the baseline samples. The vector normalised PC2 loading (Figure 2E) does not show any obvious strong peaks from carotenoids or serum.

3.3.1 A 18 months supplemented samples
Figure 3A is the scatter plot which shows a spread of points across the plot from the negative to the positive side, with a greater density towards the positive side. There is a more defined clustering and differentiation between patients indicating a high interpatient variability in the Raman spectra measurements. Again, the spread of the points in the scatter plot is primarily attributed to the variation of PC1 which accounts for majority of the variance (76.69%). Figure 3B,C shows the PC1 loadings for this group, without and with vector normalisation, respectively. Without the vector normalisation, the PC1 loading plot is completely dominated by the carotenoid peaks on the positive side. Also, similar to the unnormalised PC1 loading of the baseline samples, there is no indication of the presence of serum peaks. Again similarly, when vector normalised (Figure 3C), PC1 distinguishes the relative amounts of carotenoids from serum, with a dominance of carotenoid peaks in the positive side and serum peaks on the negative side of the plot. There is also no obvious indication of variability in the composition of carotenoids present from PC1. Figure 3D,E shows the PC2 loadings without and with vector normalisation, respectively. In the unnormalised plot, the PC2 loading is similar to that of PC1 in the normalised dataset (Figure 3C), carotenoid peaks dominating the positive side, while serum peaks appear on the negative side. Notably, the 1519 cm−1 carotenoid peak now shows a derivative-like profile across the positive and negative side of the loading, possibly indicating a variance in the carotenoid composition [33]. When vector normalised, the PC2 loading (Figure 3E) clearly shows a derivative line-shape coming from the 1519 cm−1 peak. An additional carotenoid peak at 1158 cm−1 can also be seen on the negative side of the loading. Such derivative-type line-shapes in the PC loadings have previously been observed in the comparative analysis of lutein, zeaxanthin and beta-carotene [33], and are a strong indication that the PCA is highlighting variability in the relative carotenoid composition, as well as overall content, of the supplemented patient samples. While the differences in overall carotenoid content are immediately apparent from the PC1 of the unnormalized data sets, normalising accentuates any structural differences in the carotenoid composition, particularly evident in PC2.

3.4 Matched baseline and supplemented patients' serum
Figure 4A compares the mean spectra of the baseline and supplemented serum samples, showing a higher intensity in the supplemented samples, but no obvious shifts in the peaks. However, on closer examination of the 1519 cm−1 peak from the vector normalised mean spectra (Figure 4B), there is a subtle but evident shift in the supplemented samples peak from high to low frequency (1522 to 1519 cm−1), which may indicate structural differences between the carotenoids in both groups of serum and suggest the potential to evaluate the relative contributions of the carotenoids in the serum groups.

The scatter plot of PC2 versus PC1 (Figure 4C) scores shows a high degree of clustering of the spectra of each patient sample (e.g., rings for patients ET001, ET0013, ET0022, and ET037) from baseline and 18-months supplemented. The plot also shows differentiation between the groups, most of the spectra from the baseline samples clustering on the negative side of PC1, while those from the 18-month supplementation samples are clustered on the positive side. The distribution of the points in the scatter plot is primarily attributed to the variation of PC1, which accounts for majority of the variance.
Figure 4D,E shows the PC1 loadings from the PCA, without and with vector normalisation, respectively. The PC1 loading without vector normalisation is similar to the PC 1 loading of the individual groups (Figures 2C and 3C), carotenoid peaks completely dominating the positive side of the loading and no diffrentiation between baseline and supplemented samples. When normalised, the PC1 loading reveals differences in the relative amounts of carotenoids compared to serum, carotenoid peaks appearing on the positive side and serum peaks on the negative side of the loading. There is much higher carotenoid content in the positive side (supplemented serum) than the negative (baseline samples). Relative serum content is also much higher in the baseline than in the supplemented samples. In the unnormalised PC2 loading (Figure 4F), a much clearer differentiation can be observed, as there is a distinction in the relative amounts of serum and carotenoids, but also indications of structural differences in the carotenoid content. In the normalised PC2 (Figure 4G), this structural difference becomes more prominent, as seen in the derivative line-shape at ~1519 cm−1. This variance comes from both baseline and supplemented serum samples. Again, carotenoid content is much higher in the 18 months supplemented samples. Another major variance in carotenoid structure can be seen in the 1158 cm−1 peak which comes from the baseline samples.
It is notable that the scatter plot also shows a pattern in the distribution of the groups associated with different individual patients, from those clustering around the zero mark to those on the extreme negative (baseline) and positive (supplemented) ends. Generally, the closer the points are to zero, the lower the carotenoid concentration, and vice versa. For instance, in the case of patient ET001 and ET022 (highlighted), the carotenoid baseline and supplemented levels are very low, compared to the other patients. Because of the low carotenoid levels, the baseline and 18 months supplemented points for these patients, cluster close to the zero line, with the baseline points slightly past the negative (baseline) side of the plot for patient ET022, indicative of low carotenoid levels and a smaller variance gap between baseline carotenoid and supplemented carotenoid content. On the other hand, in the case of ET037 and ET013 (highlighted), the points cluster much further away from the zero line on the negative (baseline) and positive (supplemented) side of the plot, indicative of high carotenoid content on both sides and a much larger difference in serum carotenoid content before and after the supplementation regime. Further examination of these extreme cases, showing their relative carotenoid compositions in the serum before and after the period of supplementation is shown in the supplementary material (Figure S7).
4 DISCUSSION
In this study, Raman spectroscopy was employed to analyse carotenoids in blood serum samples from glaucoma patients who participated in the ENIGMA study, with the aim of investigating the effect of the supplementation on the overall content and structural composition of the carotenoids [36]. The objective was to establish whether the analysis could verify differences in carotenoid content and composition in patient serum samples pre-(baseline) and post supplementation regime, following a prior clinical trial on the macular pigment response to lutein, zeaxanthin, and meso-zeaxanthin in open-angle glaucoma patients. A 532 nm laser source was used for the entire analysis, and following background correction of the spectra, which removed the interferents water and glass, the three prominent carotenoid peaks at ~1004, 1158, and 1519 cm−1 were seen to dominate the spectra of the serum samples, as expected from the resonance enhancement. Note that a further self-absorption correction of the spectra to account for depletion of the laser source and Raman scattered light as it propagated through the sample was not necessary since the concentration of the serum carotenoids as recorded from the intensity of the carotenoid peaks were low compared to those of previous studies [33, 62], for which was required.
Overall, a consistent and substantial difference is observed in the concentration of carotenoids between the baseline and supplemented serum groups, as evidenced by the intensity of the carotenoid peaks in the background-corrected spectra and the PC1 loadings throughout the study. In the entire analysis, the biggest variance as revealed in the PC1 loading was in the carotenoid and serum peaks, which were clearly distinguished. PC2 on the other hand, which accounted for a much smaller percentage of the variance revealed a change in the structural profile of the carotenoid content in supplemented serum. There is also a consistent difference in structural profile of the serum carotenoids between the two data sets. The structural changes in the serum carotenoid recorded through the study were evidenced by a characteristic derivative line-shape at the 1519 cm−1 peak position. This was caused by spectral shift in that position to a lower wavenumber (from 1522 to 1519 cm−1). The shift is therefore an indication of the presence of more than one carotenoid. This derivative peak is absent in the ‘baseline only’ analysis and therefore indicates that the structural change was brought about by the supplementation with macula pigment carotenoids. The carotenoid supplements administered in this study contained the xanthophylls lutein, zeaxanthin and meso-zeaxanthin (an isomer of zeaxanthin). Usually, the carotenes beta carotene and lycopene form about ~65% of the serum carotenoid pool [11], making lutein and zeaxanthin, which form a much smaller ratio (~18%) [11], less significant. The supplementation therefore caused a remarkable rise in the serum content of macula carotenoids lutein and zeaxanthin and the carotenoid spectra from the supplemented serum can be said to have a greater contribution from lutein and zeaxanthin compared to the usually dominant serum carotenoids like beta carotene. Similar spectral shifting was observed in the previous study, in which the three carotenoids, beta carotene, lutein and zeaxanthin, complexed with BSA, were successfully distinguished by PCA [33]. In this case, however, the 1519 cm−1 peaks shifted to higher wavenumbers relative to beta carotene [33]. It is therefore worthy of note that, depending on their native environment (e.g. ethanol, BSA or blood serum), carotenoids tend to aggregate, and the aggregation influences the degree of shifting of the Raman peaks [27, 63]. Nevertheless, the different Raman spectroscopic profiles observed in the current study are indicative of differences between the carotenoid compositional profiles in the serum of the supplemented patients, compared to those of the study baseline, which by inference is associated with the supplemented carotenoids lutein, zeaxanthin and meso-zeaxanthin.
The study thus indicates that the supplemented serum samples have a higher concentration of the carotenoid supplements, lutein/zeaxanthin/mesozeaxanthin. This significant increase in xanthophyll content is consistent with the outcome of the ENIGMA clinical trial [36], from which the patient samples were obtained. This consistency can be seen for example in Figure 5, where the Raman intensity of the dominant carotenoid peak was compared with the change in MPOD.

The Raman spectroscopic measurements in serum in the present study are therefore clearly reflective of the MPOD results. Notably, Raman spectroscopy of serum can provide a more direct approach of monitoring the carotenoid supplementation in the body compared to the clinical method employed in the ENIGMA study, which measures the carotenoids more indirectly by estimating the optical density of the macular pigment.
The analysis of the baseline serum samples indicates that there was a clear interpatient variability in the concentration of carotenoids measured. However, no indication of any variation in the structural profile of the baseline serum samples was observed. This suggests that Raman spectroscopy can be reliably employed for the direct quantification of serum carotenoids in individuals. The use of Raman in the measurement of dietary carotenoids has been explored extensively and is currently being employed in the skin for evaluating the nutritional status of people, especially women and children [4, 5]. Raman spectroscopic measurements in serum could provide a more accurate quantitative estimation of the carotenoids, as serum contains a more robust composition of dietary carotenoids compared to the skin or eyes [1].
Similarly, the analysis of the serum samples of patients after the 18-month course of supplementation also showed a clear variability in the concentration of the carotenoids from person to person. However, in addition, it indicated differences in the structural profile of the carotenoids, and this was variable from patient to patient, suggesting that the supplementation had a varied degree of effectiveness on each patient. This is expected, as even though there was an overall increase in the carotenoid content after supplementation, the effect differed individually, for a variety of potential reasons. For instance, studies have shown that carotenoids uptake from diet and supplements can be affected by factors like diet, lifestyle, and general health conditions [4, 5, 64, 65]. Also, the low impact of supplementation could have been caused by low baseline serum carotenoid levels, low baseline MPOD, increased tissue uptake out of serum [66] and glaucoma severity (those with the severest disease may have the greatest inflammatory and oxidative load and therefore may not exhibit as strong a serum response) [67].
In comparing the baseline and supplemented serum samples, the matched baseline/supplemented analysis provided some more specific details as to how the supplementation affected different patients. A good distinction was seen between baseline and supplemented serum in carotenoid concentration and structure, as expected. It can therefore be inferred that the degree of structural differences in the carotenoid content of the serum is related to the levels of supplemented carotenoids in the blood. The matched analysis also indicates a variable effectiveness of the supplementation on different patients. For instance, some patients experienced up to three times increase in carotenoids after the supplementation, while some were not impacted as much by the supplementation. In this context, the extreme cases noted in the matched patients analysis reveals a potentially significant trend, indicating that the patients which registered the lowest baseline levels of carotenoids registered the lowest impact of the supplementation regimen, whereas the patients which had the highest levels of baseline carotenoids were impacted most by supplementation.
Information from this type of analysis therefore points towards the possibility of guiding carotenoid supplementation.
5 CONCLUSION
The findings from this study highlight promising potential of Raman spectroscopy to quantify and differentiate carotenoids directly in blood serum based on minute structural differences in the dietary carotenoids. Analysing a wider range of matching pairs of patients' samples before and after supplementation, in future, can bring even more significance to the study.
A further step in this direction will also be to correlate the Raman results with the measured ocular clinical parameters, such as MPOD, visual function and structure. The ability to quantify and differentiate serum carotenoids can provide an alternative, easier but highly sensitive method for routinely accessing carotenoid status in the clinic. It could additionally guide individualised supplementation strategies, while advancing the understanding of the specific advantages of individual carotenoids which can, in the long run, be harnessed and directed towards a more accurate diagnosis and treatment of glaucoma, AMD and various other disease for which the dietary carotenoids are directly implicated.
EXTERNALLY HOSTED SUPPLEMENTARY FILE
AUTHOR CONTRIBUTIONS
Conceptualization: J. U., E. L., J. L. and H. J. B.; Methodology: J. U. and H. J. B.; Formal analysis: J. U. and H. J. B.; Investigation: J. U., E. L; Resources: H. J. B.; Data curation: J. U.; Writing— original draft preparation: J. U. and H. J. B.; Writing—review and editing: J. U., E. L., J. L. and H. J. B.; Supervision: E. L., J. L. and H. J. B.; Funding acquisition: H. J. B.
ACKNOWLEDGMENT
Open access funding provided by IReL.
FUNDING INFORMATION
This research was funded by the Technological University Dublin Postgraduate Scholarship, 2020.
CONFLICT OF INTEREST STATEMENT
The authors declare no conflicts of interest.
Open Research
DATA AVAILABILITY STATEMENT
The data that support the findings of this study are openly available in Arrow at https://arrow.tudublin.ie/datas/25/.